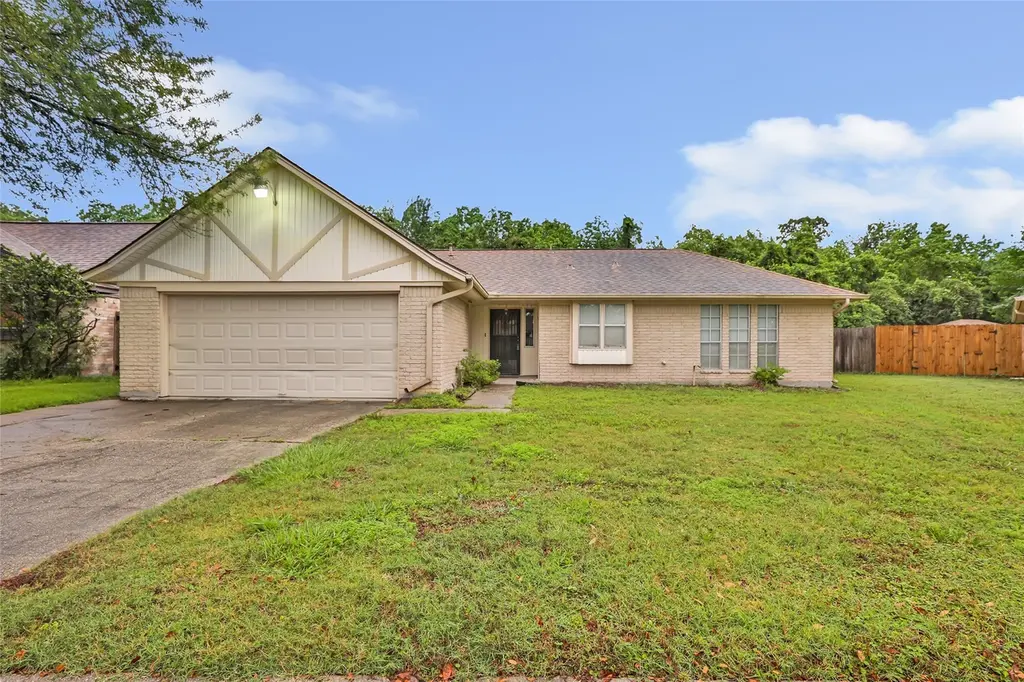
3703 Stoneybrook St · Baytown, TX
Flood risk 4/10 · Minor
- FEMA flood zone
- X (unshaded)
- Chance of flooding over 30 yrs
- 0.22%
- Est. flood insurance / yr
- $507 – $1,088
Fire risk 2/10 · Minimal
- Est. fire insurance / yr
- $1,222 – $2,270
Heat risk 9/10 · Severe
- Hot days now (above 110°F)
- 7 days/yr
- Hot days in 30 yrs
- 25 days/yr
Wind risk 9/10 · Severe
- Chance of severe wind over 30 yrs
- 99.0%
Air-quality risk 2/10 · Minimal
- Unhealthy air days now
- 1 days/yr
- Unhealthy air days in 30 yrs
- 2 days/yr
Risk factors via First Street. Map © Google.
Why this score? — see what drove the D grade
The composite is a weighted blend of 9 inputs, each scored 0–100. Each bar is that input's sub-score; the figure is the points it added to the 100-point composite (weight × sub-score).
- ARV discount +15.0/15.0
- Cash flow +8.6/30.0
- 1% rule +4.0/10.0
- Livability +3.5/5.0
- Schools +3.2/10.0
- Rent growth +2.9/5.0
- Condition / age +2.5/5.0
- DSCR +2.4/10.0
- Appreciation +0.0/10.0
$179,000
🖨 Deal sheet (PDF) 📄 Offer letter ✓ Due diligence
Listing remarks
Welcome to this charming 1,388 sq ft home nestled in a well-established neighborhood with no HOA. This quaint residence features three spacious bedrooms and two full bathrooms, offering a comfortable and functional layout for everyday living. The attached two-car garage provides convenience and ample storage. Situated on a generous 9,317 sq ft lot, the property boasts a nicely sized backyard complete with a fence and a covered patio—perfect for relaxing or entertaining. Enjoy added privacy with a green space behind the home and no back neighbors. Inside, a cozy wood-burning fireplace creates a warm and inviting atmosphere. Centrally located in the heart of Baytown with easy access to
Key facts
- 9,317 sq ft lot
- 2 garage spots
- Built 1981
Property features AI
Exterior
- Parking: Attached 2-car garage
- Utilities: Public water; Public sewer
- Home design: Residential property; Built in 1981; Slab foundation; Composition roof
- Construction: Brick construction
- Exterior features: Subdivision lot
Interior
- Kitchen: Kitchen on the first floor (10 x 8); Breakfast nook on the first floor (12 x 10)
- Bedrooms: Primary bedroom on the first floor (15 x 12); Bedroom on the first floor (12 x 11); Bedroom on the first floor (12 x 11)
- Bathrooms: 2 full bathrooms
- Heating & cooling: Central gas heating; Central electric air conditioning
- Interior features: One fireplace; 6 total rooms
Neighborhood map
What this means for you Summary
Snapshot
- This is a 3-bed/2.0-bath single-family listed at $179k.
Deal economics
- At list price, monthly cash flow is $-153 ($-2k/yr) — negative.
- To cash-flow at today's rent, offer at most $152k (15.1% below list).
- To meet the 1% rule (rent ≥ 1% of price), the offer needs to be $161k (9.8% below list).
- Recommended offer: $152k (15.1% below list) — sets the bar for cash-flow.
- Cap rate 5.3% vs local median 4.2% in Baytown — meaningfully above typical; check what's discounted (condition, days-on-market, listing class) to confirm the premium yield is real.
Location & tenants
- Location reads 69/100 on livability (#412 in TX) — a middle-class / working-renter tenant base. Strengths: cost of living A+, housing A+; Watch: employment D+, crime F, amenities F.
- Goose Creek CISD (urban): math 37% / reading 36% proficiency, ranked #473 of 826 in TX (top 57%) — families likely to look elsewhere, expect single-tenant / working-renter base with shorter leases; 61% free/reduced lunch — lower-income household profile, screen leases tightly.
- Zoned schools: Crockett El (math 38% / reading 40%, grade F, #1,651 of 4,322 statewide, top 39%, 628 students, 75% FRL); Cedar Bayou J H (math 46% / reading 32%, grade F, #690 of 1,662 statewide, top 42%, 969 students, 81% FRL); High Point School (12 students, 75% FRL) — zoned schools average 77% FRL vs 61% district-wide (16 pts higher); higher-poverty schools than district average — tighter screening recommended.
- Market conditions: Rents rising (+1.5%/yr); 624 active listings in the ZIP; 24 comparable units currently listed for rent nearby; rentals lingering (median 46d on market — plan ~5-8 weeks vacancy on turnover, expect pricing pressure); 54% of comp listings sitting > 30 days — soft ceiling on asking rent; 29,883 units permitted in Harris County in 2024 (8,621 in 5+ unit buildings).
Forward outlook
- Local home prices are declining (-3.0%/yr); year-one equity from $1k of loan paydown is wiped out by about $5k of value loss. Plan a longer hold.
- Harris County population projected at +47% by 2050 — long-run rental-demand tailwind backs the buy-and-hold thesis.
Negotiation context
- It's been on market 15 days — a 2% lower offer ($176k) is reasonable based on typical stale-listing flexibility.
Risks & watch-outs
- Watch-outs: property tax is 2.8% of price.
- Climate carrying-cost: severe wind risk, 99% chance of damaging wind over 30y; extreme-heat days projected 7→25/yr by 2055 (HVAC capex compounding) — expect insurance premiums to compound above CPI over the hold.
Questions for the listing agent
- What do current leases actually rent for vs. the listed asking? Can we see a recent rent roll and the last 12 months of T-12 income?
- Property tax is high relative to price — has the assessment been appealed recently, and will the sale trigger a re-assessment?
- Is there a deadline driving the sale (1031 exchange, divorce, estate, relocation)? That informs how much negotiation room exists.
- Schools are D-rated, which usually means shorter tenancies and higher turnover. Who's the typical renter profile here, and what's been the actual vacancy rate?
- Crime grade is F in this area — have there been break-ins, vandalism, or insurance claims at this property in the last 3 years? What carrier currently insures it and at what premium?
- The area grade is low — what's the realistic commute time and amenity access for the typical tenant pool here? Any planned neighborhood developments (good or bad) we should know about?
- What's the average days-on-market for RENTAL listings here right now (not sales)? A rising rental-DOM trend means longer vacancies and softer asking-rent achievability than the comps imply.
- What's the recent tenant-quality profile in this submarket — average credit score on applications, eviction rate, late-payment / NSF rate, and stable-employment percentage? A property-management company in the area should have these aggregated.
- How much new for-sale + rental construction is in the pipeline within 1–3 miles? Heavy new supply typically softens prices + rents 12–24 months out; constrained supply supports both.
Investment metrics
- 1% rule
- 0.90% ✗
- Cap rate
- 5.27%
- Cash-on-cash
- -3.66%
- DSCR
- 0.84
- GRM
- 9.2
CMA / ARV
- ARV (median comp)
- $233,676
- List price
- $179,000
- Delta
- -23.40%
- Verdict
- UNDERPRICED
- Comps
- 20 within 1.0 mi
Show comp detail 12 sales within ~0.75 mi
| Address | Dist | Beds/Ba | Sqft | Sold | Price | $/sf | Match |
|---|---|---|---|---|---|---|---|
| 3703 Stoneybrook St | 0.00mi | 3/2.0 | 1,388 (0%) | 0mo | $179,000 | $129 | 100 |
| 4002 Montego Dr | 0.24mi | 3/2.0 | 1,373 (-1%) | 2mo | $160,000 | $117 | 85 |
| 604 Briarclift Ln | 0.23mi | 3/2.0 | 1,429 (+3%) | 3mo | $210,000 | $147 | 81 |
| 4001 Stoneybrook St | 0.17mi | 3/2.0 | 1,468 (+6%) | 5mo | $199,000 | $136 | 78 |
| 4005 Stoneybrook St | 0.20mi | 3/2.0 | 1,468 (+6%) | 10mo | $245,000 | $167 | 73 |
| 609 Heather Ln | 0.12mi | 3/2.0 | 1,506 (+8%) | 14mo | $249,900 | $166 | 69 |
| 804 Edgebrook Dr | 0.22mi | 3/2.0 | 1,469 (+6%) | 17mo | $209,900 | $143 | 65 |
| 702 Pinebrook Ln | 0.10mi | 3/2.0 | 1,550 (+12%) | 16mo | $219,000 | $141 | 62 |
| 807 Sunnybrook Ln | 0.26mi | 3/2.0 | 1,580 (+14%) | 7mo | $215,000 | $136 | 59 |
| 602 Heather Ln | 0.13mi | 3/2.0 | 1,588 (+14%) | 14mo | $225,000 | $142 | 58 |
| 827 Hartman Dr | 0.65mi | 3/2.0 | 1,514 (+9%) | 10mo | $220,000 | $145 | 46 |
| 507 Pamela Dr | 0.75mi | 3/1.5 | 1,293 (-7%) | 19mo | $190,000 | $147 | 36 |
Match score weights: distance 35% · size 25% · config 20% · recency 20%. Top-matched comps best support the ARV.
Projected returns pro-forma
-3.0% appreciation · 1.48% rent growth · sell at horizon
- IRR
- -24.3%
- Equity multiple
- 0.18×
- Total profit
- $-41,027
- Equity at exit
- $26,689
- IRR
- -25.4%
- Equity multiple
- -0.14×
- Total profit
- $-57,360
- Equity at exit
- $15,477
Cash invested: $50,120 (down + closing). Projections, not guarantees.
Landlord ↔ Tenant lean methodology
- Overall (STATE)
- 87 Strongly Landlord-Friendly
- State Texas
- 87 Strongly Landlord-Friendly · R+5
- County
- — inherits STATE
- City
- — inherits STATE
ZIP-level market 77521
- Rents YoY
- 1.5%
- Active inventory
- 624
- Price-to-rent
- 9.2×
Monthly cashflow live
- Estimated rent
- $1,615 high interval (Pro) →
- Mortgage (P&I)
- −$939
- Tax from tax record
- −$415 /mo · $4,984/yr
- Insurance
- −$75
- HOA
- −$0
- Vacancy / Maint / Mgmt
- −$339
- Net cashflow
- $-153
Break-even live
Sensitivity live
| Price | -10% $-51 | -5% $-102 | +0% $-153 | +5% $-203 | +10% $-254 |
|---|---|---|---|---|---|
| Rent | -10% $-280 | -5% $-217 | +0% $-153 | +5% $-89 | +10% $-25 |
| Rate | -1.0pp $-63 | -0.5pp $-107 | base $-153 | +0.5pp $-199 | +1.0pp $-246 |
UW: 25.0% down · 7.5% · 30yr · 1.5% tax · 5.0% vac · 8.0% maint · 8.0% mgmt
Financing live
Cash to close
- Down payment
- $44,750
- Closing costs
- $5,370
- Reserves months
- —
- Total cash needed
- —
Loan-product check · same deal, 3 products live
Conventional
25% down · 7.5% · 30yr
- Down + closing
- —
- Monthly P&I
- —
- Monthly cashflow
- —
- DSCR
- —
- Eligible?
- —
Personal DTI + credit; lowest rate.
DSCR
20% down · 8.5% · 30yr
- Down + closing
- —
- Monthly P&I
- —
- Monthly cashflow
- —
- DSCR
- —
- Eligible?
- —
No personal income docs; deal must DSCR.
Hard money
10% down · 12.0% · 12mo
- Down + closing
- —
- Monthly P&I
- —
- Monthly cashflow
- —
- DSCR
- —
- Eligible?
- —
Short-term bridge; refi at stabilization.
Rent comps 24 comps
| Address | Beds | Baths | Sqft | Rent | $/sqft | DOM | Units | Dist |
|---|---|---|---|---|---|---|---|---|
| 619 Rollingbrook Dr Baytown, TX | 1.0–3.0 | 1.0–2.0 | 913 | $1,884 | $2.06 | 0d | 33 | 0.26mi |
| 10960 Bradford Way Dr Baytown, TX | 2.0 | 2.0 | 933 | $1,290 | $1.38 | 45d | 1 | 0.32mi |
| 3409 Garth Rd Baytown, TX | 2.0 | 2.0 | 920 | $950 | $1.03 | 45d | 1 | 0.66mi |
| 305 Kelly Ln Baytown, TX | 3.0 | 2.0 | 1650 | $1,000 | $0.61 | 17d | 1 | 0.68mi |
| 1706 Rollingbrook Dr Baytown, TX | 2.0 | 2.0 | 1033 | $1,450 | $1.40 | 45d | 1 | 0.76mi |
| 700 Meadowglen Dr Baytown, TX | 3.0 | 2.0 | 1472 | $1,800 | $1.22 | 1d | 1 | 0.86mi |
| 700 Meadowglen Dr Baytown, TX | 3.0 | 2.0 | 1472 | $1,800 | $1.22 | 26d | 1 | 0.86mi |
| 99 W Cedar Bayou Lynchburg Rd Baytown, TX | 1.0–3.0 | 1.0–2.0 | 1027 | $2,254 | $2.19 | 0d | 16 | 0.86mi |
| 4925 N Main St Baytown, TX | 2.0 | 2.0 | 1180 | $1,550 | $1.31 | 45d | 1 | 1.00mi |
| 3723 Emmett Hutto Blvd Baytown, TX | 2.0 | 2.0 | 1216 | $1,650 | $1.36 | 45d | 1 | 1.10mi |
| 2257 W Baker Rd Baytown, TX | 2.0 | 2.0 | 1007 | $1,525 | $1.51 | 45d | 1 | 1.14mi |
| 2200 W Baker Rd Baytown, TX | 1.0–2.0 | 1.0–2.0 | 863 | $1,664 | $1.93 | 3d | 13 | 1.28mi |
| 516 William Ave Baytown, TX | 2.0 | 1.0 | 931 | $1,250 | $1.34 | 45d | 1 | 1.29mi |
| 4313 Lariat Dr Baytown, TX | 3.0 | 2.0 | 1549 | $1,713 | $1.11 | 7d | 1 | 1.38mi |
| 1305 Memorial Dr Baytown, TX | 1.0–2.0 | 1.0 | 845 | $1,193 | $1.41 | 26d | 3 | 1.39mi |
| 2800 W Baker Rd Baytown, TX | 1.0–3.0 | 1.0–2.0 | 988 | $1,775 | $1.80 | 1d | 27 | 1.40mi |
| 2898 W Baker Rd Baytown, TX | 2.0 | 2.0 | 896 | $1,216 | $1.36 | 45d | 1 | 1.43mi |
| 907 South Rd Baytown, TX | 2.0 | 2.0 | 1081 | $1,780 | $1.65 | 45d | 1 | 1.44mi |
| 1525 Barcelona Way Baytown, TX | 3.0 | 2.0 | 1112 | $1,250 | $1.12 | 26d | 1 | 1.45mi |
| 1519 Barcelona Way Baytown, TX | 3.0 | 2.0 | 1325 | $1,250 | $0.94 | 45d | 1 | 1.47mi |
| 1512 Beaumont Rd Baytown, TX | 3.0 | 2.0 | 1112 | $1,200 | $1.08 | 45d | 1 | 1.48mi |
| 1510 Beaumont Rd Baytown, TX | 2.0 | 1.0 | 1010 | $1,100 | $1.09 | 45d | 1 | 1.49mi |
| 1607 Garth Rd Baytown, TX | 2.0 | 2.0 | 1017 | $1,025 | $1.01 | 45d | 1 | 1.49mi |
| 1601 Garth Rd Baytown, TX | 2.0–3.0 | 1.0–2.5 | 1190 | $1,499 | $1.26 | 4d | 5 | 1.49mi |
Listing history 4 events
-
2026-05-12status Pending 862-char remark
-
2026-05-05$179,000 Active 862-char remark
-
2025-07-03soldstatus
-
1988-06-01soldstatus
ⓘ Source: listings_history table (triggers on properties + properties_extension) + one-shot
backfill from property_details.listing_events for pre-trigger history.
Tax reassessment forecast TX · Resets to sale price
- Current annual tax
- $4,984 · $415/mo
- Projected year-2 tax
- $4,984 · $415/mo
- Expected delta
- $0/yr ($0/mo · 0.0%)
ⓘ Screening estimate from a state-policy table — verify with the county assessor before closing.
Climate risk First Street
- Flood 4/10 Moderate FEMA zone X (unshaded) · 22% chance over 30 yrs
- Wildfire 2/10 Low
- Heat 9/10 Extreme 7 d/yr ≥110°F today · 25 d/yr by 30 yrs out
- Wind 9/10 Extreme 99% chance of damaging wind over 30 yrs
- Air quality 2/10 Low 1 unhealthy d/yr today · 2 by 30 yrs out
Nearby sold comps map
Loading sold comps map…
Walkable amenities ~0.75 mi
Loading nearby amenities…
Taxation est. · year 1
- Rental income
- $19,379
- − Mortgage interest
- −$10,027
- − Property taxes
- −$4,984
- − Insurance
- −$895
- − Repairs & maintenance
- −$1,550
- − Management
- −$1,550
- − Depreciation
- −$5,207
- Taxable loss
- −$4,834
- Est. tax savings @ 24.0%
- +$1,160
- After-tax cash flow
- $-673/yr
For passive investors: Depreciation is non-cash, so a rental often shows a tax loss while cash-flowing — sheltering income. Rental losses are passive: they offset passive income freely, and up to $25,000/yr can offset ordinary (W-2) income if you actively participate and your MAGI is under $100k (phasing out to $0 by $150k); unused losses carry forward. On sale, claimed depreciation is recaptured at up to 25%, and gains may owe capital-gains tax (a 1031 exchange can defer both). Figures are a year-1 estimate at your 24.0% rate — not tax advice; consult a CPA.
Schools (NCES district)
- District
- Goose Creek CISD
- NCES district ID
- 4821150
- Math proficiency
- 37% ▼ -11.00%
- Reading proficiency
- 36% ▼ -4.00%
- Median HH income
- $52,468
- Composite
- 31.84/100
- National rank
- #5877
- State rank
- #473 of 826 in TX
Livability — Baytown
- Score
- 69/100
- State rank
- #412
- US rank
- #8494
Category grades
Schools grade is shown separately in the Schools card above.
Census & demographics
- Census place
- Baytown, TX
- County
- Harris County · 4,702,590 people
- City population
- 135,579
- Metro
- Houston-The Woodlands-Sugar Land, TX
- Population (ZIP)
- 69,038
- Household income
- $73,629
- Rent vs Own
- Severe rent burden
- 2121.0
Population outlook (Harris County) Hauer SSP2
- Today (2025)
- 5,571,493 people
- By 2030
- 6,089,821 · +9.3%
- By 2040
- 7,142,806 · +28.2%
- By 2050
- 8,185,864 · +46.9%
- By 2075
- 10,574,329 · +89.8%
- By 2100
- 12,109,958 · +117.4%
Race, ethnicity, and origin ACS 2023
- Neighborhood character
- Diverse neighborhood (Simpson 0.64)
- Race & ethnicity
- Hispanic / Latino 50% White 28% Two or more races 18% Black 17% Asian 3%
- Hispanic origin (detail)
- Mexican 42% Puerto Rican 2%
- Common ancestry
- Lithuanian 2% Slovak 1%
- Foreign-born
- 20% · Canada, Vietnam
- Languages at home
- 59% English-only · Spanish 36% French/Haitian/Cajun 1% Other Asian/Pacific 1%
Political lean MEDSL · Harris
- 2024 margin
- Lean D (+5.5) · D 52.0% · R 46.4% · Other 1.6%
- 2008→2024 swing
- +3.9pp toward D · 2008: 1.6pp · 2024: 5.5pp
- All cycles
- 2024: D+5.5 2020: D+13.3 2016: D+12.4 2012: D+0.1 2008: D+1.6
Not yet ingested
- Civics
- —
Market trends
- HPI YoY
- ▼ -154.80%
- Current HPI
- 246.1892
- Rent YoY
- ▲ 1.48%
- Metro
- Houston-The Woodlands-Sugar Land, TX
- State GDP YoY
- ▲ 3.95%
- F500 in state
- 110
Industry mix (Fortune 500 HQ in TX)
| Industry | F500 HQs | Revenue |
|---|---|---|
| Energy | 16 | $1,198B |
|
||
| Technology | 5 | $198B |
|
||
| Engineering / Construction | 4 | $72B |
|
||
| Energy Services | 3 | $60B |
|
||
| Utilities | 3 | $41B |
|
||
| Healthcare | 2 | $330B |
|
||
Price history
7 events — show timeline
- 2026-06-09 Sold (Public Records) — Public Records
- 2026-06-08 Sold (MLS) — HARMLS
- 2026-05-21 Pending — HARMLS
- 2026-05-12 Pending — HARMLS
- 2026-05-05 Listed $179,000 HARMLS
- 2025-07-03 Sold (Public Records) — Public Records
- 1988-06-01 Sold (Public Records) — Public Records
Property tax history
+3.1%/yrLatest (2025): $4,984 · +0.3% YoY. Source: county tax records.
Cash-flow waterfall
monthlySold comps — $/sqft
last 12 mo · ≤1 miLoading sold comps…