 🏗️ New Construction
Jazz Plan · Pearland, TX
Flood risk 1/10 · Minimal
- FEMA flood zone
- X (unshaded)
- Chance of flooding over 30 yrs
- 0.0%
- Est. flood insurance / yr
- $507 – $1,088
Fire risk 4/10 · Minor
- Est. fire insurance / yr
- $1,222 – $2,270
Heat risk 9/10 · Severe
- Hot days now (above 107°F)
- 7 days/yr
- Hot days in 30 yrs
- 24 days/yr
Wind risk 9/10 · Severe
- Chance of severe wind over 30 yrs
- 99.0%
Air-quality risk 2/10 · Minimal
- Unhealthy air days now
- 1 days/yr
- Unhealthy air days in 30 yrs
- 1 days/yr
Risk factors via First Street. Map © Google.
Why this score? — see what drove the D- grade
The composite is a weighted blend of 9 inputs, each scored 0–100. Each bar is that input's sub-score; the figure is the points it added to the 100-point composite (weight × sub-score).
- 1% rule +8.5/10.0
- ARV discount +7.5/15.0
- Cash flow +6.0/30.0
- Schools +5.4/10.0
- Condition / age +4.8/5.0
- Livability +4.0/5.0
- Rent growth +3.2/5.0
- DSCR +0.3/10.0
- Appreciation +0.0/10.0
$109,900
🖨 Deal sheet 📄 Offer letter ✓ Due diligence
Listing remarks MLS
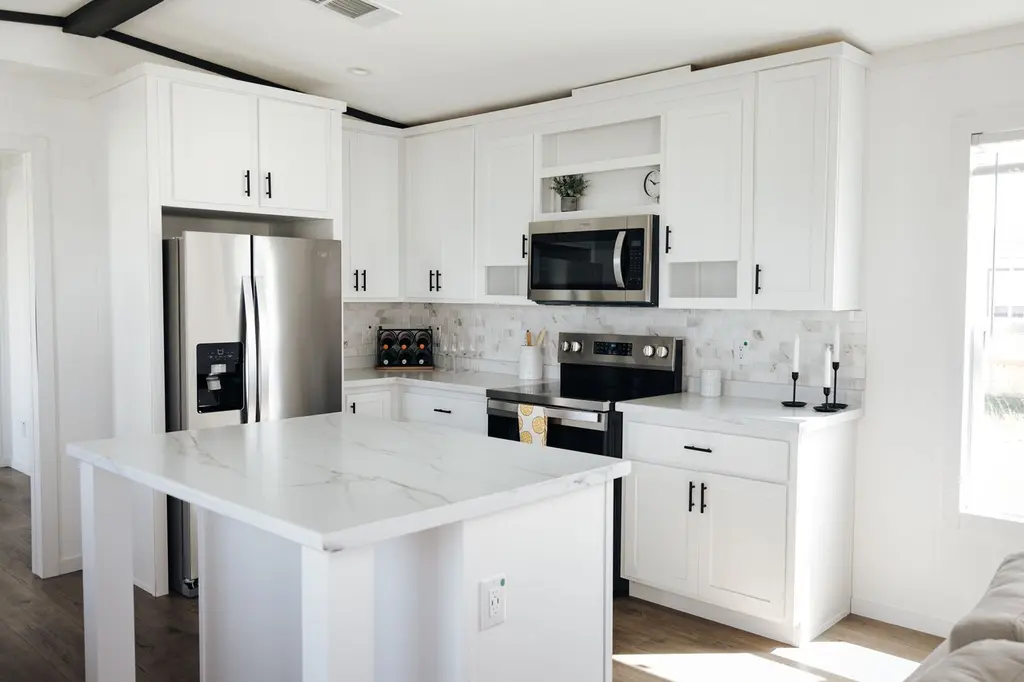
We currently have a stunning brand-new manufactured home available, built in 2025, that is move-in ready and just waiting for you to make it your own! This home boasts an array of impressive features that are sure to enhance your living experience. As you step inside, you'll immediately notice the elegant, pitched ceiling complemented by a beautifully crafted beam across the living area, creating a spacious and inviting atmosphere. The heart of the home is undoubtedly the large kitchen island, perfect for hosting gatherings or simply enjoying a casual meal. Equipped with modern appliances, this kitchen comes complete with a stove, refrigerator, dishwasher, and microwave, making meal prep a breeze. Additionally, the convenience of a dedicated laundry room ensures that your laundry tasks are easily managed. Retreat to the primary bathroom, where you'll find a luxurious walk-in shower. This thoughtfully designed space combines functionality with sophisticated style. Located in The Landing at Pearland, this manufactured home offers not only a beautiful living space but also a warm and welcoming community atmosphere. Whether you're seeking a serene getaway or a vibrant neighborhood, this location has it all. If you're interested in exploring this amazing opportunity further, please feel free to reach out to me at your convenience. I would be delighted to answer any questions you may have or to arrange a tour of the home. Land is leased, not owned.
Key facts
- Large kitchen island
- Walk-in shower
- Listed 415 days
Tags
Neighborhood map
What this means for you Summary
Snapshot
- This is a 3-bed/2.0-bath manufactured listed at $110k. Condition is rated excellent.
Deal economics
- At list price, monthly cash flow is $-289 ($-3k/yr) — negative.
- To cash-flow at today's rent, offer at most $108k (1.6% below list).
- Meets the 1% rule at list price ($2k rent vs $110k).
- Recommended offer: $97k (12.0% below list) — sets the bar for market timing.
- Cap rate 4.0% vs local median 3.0% in Pearland — top-decile yield for the area; either an underpriced asset or a hidden risk that comps aren't pricing in. Stress-test before assuming the spread holds.
Location & tenants
- Location reads 81/100 on livability (#32 in TX, #1,539 nationally) — a professional / high-income tenant draw. Strengths: schools A+, employment A+, housing A+; Watch: amenities D-, commute F.
- Pearland ISD (suburban): math 58% / reading 59% proficiency, ranked #47 of 826 in TX (top 6%) — acceptable for families but not a draw, mixed tenant base, ~2y average lease.
- Market conditions: Rents rising (+2.9%/yr); 316 active listings in the ZIP; 1 comparable units currently listed for rent nearby; high-income renter base; 3,960 units permitted in Brazoria County in 2024 (593 in 5+ unit buildings).
Forward outlook
- Local home prices are declining (-3.0%/yr); year-one equity from $1k of loan paydown is wiped out by about $4k of value loss. Plan a longer hold.
- Brazoria County population projected at +44% by 2050 — long-run rental-demand tailwind backs the buy-and-hold thesis.
Negotiation context
- It's been on market 416 days — a 12% lower offer ($97k) is reasonable based on typical stale-listing flexibility.
Risks & watch-outs
- Watch-outs: HOA is 42% of rent.
- Climate carrying-cost: severe wind risk, 99% chance of damaging wind over 30y; extreme-heat days projected 7→24/yr by 2055 (HVAC capex compounding) — expect insurance premiums to compound above CPI over the hold.
Questions for the listing agent
- What do current leases actually rent for vs. the listed asking? Can we see a recent rent roll and the last 12 months of T-12 income?
- It's been on market 416 days. Have you received any prior offers? Is the seller open to a 12% concession, seller financing, or rate buy-down credit?
- What does the HOA fee cover, when was the last increase, and are there any pending special assessments or reserve-fund shortfalls?
- Why hasn't it sold? Are there any deal-killer items the seller is aware of (foundation, flood, title, zoning, code violations)?
- Is there a deadline driving the sale (1031 exchange, divorce, estate, relocation)? That informs how much negotiation room exists.
- Schools are A-rated — typically a magnet for longer-tenancy family renters. What's the average tenant stay here, and is there a school-zone premium baked into asking?
- The area grade is low — what's the realistic commute time and amenity access for the typical tenant pool here? Any planned neighborhood developments (good or bad) we should know about?
- What's the average days-on-market for RENTAL listings here right now (not sales)? A rising rental-DOM trend means longer vacancies and softer asking-rent achievability than the comps imply.
- What's the recent tenant-quality profile in this submarket — average credit score on applications, eviction rate, late-payment / NSF rate, and stable-employment percentage? A property-management company in the area should have these aggregated.
- How much new for-sale + rental construction is in the pipeline within 1–3 miles? Heavy new supply typically softens prices + rents 12–24 months out; constrained supply supports both.
Investment metrics
- 1% rule
- 1.35% ✓
- Cap rate
- 3.98%
- Cash-on-cash
- -8.26%
- DSCR
- 0.63
- GRM
- 6.2
CMA / ARV
- ARV (median comp)
- $150,000
- List price
- $109,900
- Delta
- -26.73%
- Verdict
- UNDERPRICED
- Comps
- 1 within 2.0 mi
Projected returns pro-forma
-3.0% appreciation · 2.94% rent growth · sell at horizon
- IRR
- -30.4%
- Equity multiple
- -0.01×
- Total profit
- $-42,293
- Equity at exit
- $22,365
- IRR
- -30.4%
- Equity multiple
- -0.40×
- Total profit
- $-58,798
- Equity at exit
- $12,969
Cash invested: $42,000 (down + closing). Projections, not guarantees.
Landlord ↔ Tenant lean methodology
- Overall (STATE)
- 87 Strongly Landlord-Friendly
- State Texas
- 87 Strongly Landlord-Friendly · R+5
- County
- — inherits STATE
- City
- — inherits STATE
ZIP-level market 77581
- Home prices YoY
- -29.1%
- Rents YoY
- 2.9%
- Active inventory
- 316
- Price-to-rent
- 4.5×
Monthly cashflow live
- Estimated rent
- $2,022 medium interval (Pro) →
- Mortgage (P&I)
- −$787
- Tax est. 1.5%
- −$188 /mo · $2,250/yr
- Insurance
- −$62
- HOA
- −$850
- Vacancy / Maint / Mgmt
- −$425
- Net cashflow
- $-289
Break-even live
UW: 25.0% down · 7.5% · 30yr · 1.5% tax · 5.0% vac · 8.0% maint · 8.0% mgmt
Financing live
Cash to close
- Down payment
- $37,500
- Closing costs
- $4,500
- Reserves months
- —
- Total cash needed
- —
Loan-product check · same deal, 3 products live
Conventional
25% down · 7.5% · 30yr
- Down + closing
- —
- Monthly P&I
- —
- Monthly cashflow
- —
- DSCR
- —
- Eligible?
- —
Personal DTI + credit; lowest rate.
DSCR
20% down · 8.5% · 30yr
- Down + closing
- —
- Monthly P&I
- —
- Monthly cashflow
- —
- DSCR
- —
- Eligible?
- —
No personal income docs; deal must DSCR.
Hard money
10% down · 12.0% · 12mo
- Down + closing
- —
- Monthly P&I
- —
- Monthly cashflow
- —
- DSCR
- —
- Eligible?
- —
Short-term bridge; refi at stabilization.
Rent comps 1 comps
| Address | Beds | Baths | Sqft | Rent | $/sqft | DOM | Units | Dist |
|---|---|---|---|---|---|---|---|---|
| 500 Stoneledge Dr Friendswood, TX | 3.0 | 2.0 | 1268 | $1,995 | $1.57 | 24d | 1 | 1.34mi |
HOA detail
- Monthly dues
- $850 · $10,200/yr
Listing history 14 events
-
2026-06-18days on market $109,900 Active 416 DOM
-
2026-06-17days on market $109,900 Active 415 DOM
-
2026-06-16days on market $109,900 Active 414 DOM
-
2026-06-15days on market $109,900 Active 413 DOM
-
2026-06-13days on market $109,900 Active 411 DOM
-
2026-06-09days on market $109,900 Active 407 DOM
-
2026-06-08days on market $109,900 Active 406 DOM
-
2026-06-07days on market $109,900 Active 405 DOM
-
2026-06-04days on market $109,900 Active 402 DOM
-
2026-06-03days on market $109,900 Active 401 DOM
-
2026-06-02days on market $109,900 Active 400 DOM
-
2026-06-01days on market $109,900 Active 399 DOM
-
2026-05-31days on market $109,900 Active 398 DOM
-
2025-04-29$109,900 Active 1467-char remark
Show marketing remark (1467 chars)
We currently have a stunning brand-new manufactured home available, built in 2025, that is move-in ready and just waiting for you to make it your own! This home boasts an array of impressive features that are sure to enhance your living experience. As you step inside, you'll immediately notice the elegant, pitched ceiling complemented by a beautifully crafted beam across the living area, creating a spacious and inviting atmosphere. The heart of the home is undoubtedly the large kitchen island, perfect for hosting gatherings or simply enjoying a casual meal. Equipped with modern appliances, this kitchen comes complete with a stove, refrigerator, dishwasher, and microwave, making meal prep a breeze. Additionally, the convenience of a dedicated laundry room ensures that your laundry tasks are easily managed. Retreat to the primary bathroom, where you'll find a luxurious walk-in shower. This thoughtfully designed space combines functionality with sophisticated style. Located in The Landing at Pearland, this manufactured home offers not only a beautiful living space but also a warm and welcoming community atmosphere. Whether you're seeking a serene getaway or a vibrant neighborhood, this location has it all. If you're interested in exploring this amazing opportunity further, please feel free to reach out to me at your convenience. I would be delighted to answer any questions you may have or to arrange a tour of the home. Land is leased, not owned.
ⓘ Source: listings_history table (triggers on properties + properties_extension) + one-shot
backfill from property_details.listing_events for pre-trigger history.
Climate risk First Street
- Flood 1/10 Low FEMA zone X (unshaded) · 0% chance over 30 yrs
- Wildfire 4/10 Moderate
- Heat 9/10 Extreme 7 d/yr ≥107°F today · 24 d/yr by 30 yrs out
- Wind 9/10 Extreme 99% chance of damaging wind over 30 yrs
- Air quality 2/10 Low 1 unhealthy d/yr today · 1 by 30 yrs out
Nearby sold comps map
Loading sold comps map…
Walkable amenities ~0.75 mi
Loading nearby amenities…
Taxation est. · year 1
- Rental income
- $24,265
- − Mortgage interest
- −$8,402
- − Property taxes
- −$2,250
- − Insurance
- −$750
- − Repairs & maintenance
- −$1,941
- − Management
- −$1,941
- − HOA
- −$10,200
- − Depreciation
- −$4,364
- Taxable loss
- −$5,583
- Est. tax savings @ 24.0%
- +$1,340
- After-tax cash flow
- $-2,130/yr
For passive investors: Depreciation is non-cash, so a rental often shows a tax loss while cash-flowing — sheltering income. Rental losses are passive: they offset passive income freely, and up to $25,000/yr can offset ordinary (W-2) income if you actively participate and your MAGI is under $100k (phasing out to $0 by $150k); unused losses carry forward. On sale, claimed depreciation is recaptured at up to 25%, and gains may owe capital-gains tax (a 1031 exchange can defer both). Figures are a year-1 estimate at your 24.0% rate — not tax advice; consult a CPA.
Condition & rehab AI · 12 photos
This move-in ready manufactured home is in excellent condition with modern finishes and a clean, bright interior. Potential buyers will appreciate the curb appeal and functionality improvements that can be made to further enhance its value.
Value-add opportunities
- Resale Painting the exterior — Enhances curb appeal and can add value
- Resale Landscaping improvements — Can add value and improve curb appeal
- Both Add a smart home system — Improves functionality and can add value
Renovation cost estimate screening
Value-add ROI direction
- Resale Painting the exterior — Enhances curb appeal and can add value ↑
- Resale Landscaping improvements — Can add value and improve curb appeal ↑
- Both Add a smart home system — Improves functionality and can add value ↑
ⓘ Cost ranges are severity-bucket heuristics (US national rule-of-thumb). Get contractor quotes + a written scope before underwriting a rehab budget.
Schools (NCES district)
- District
- Pearland ISD
- NCES district ID
- 4834440
- Math proficiency
- 58% ▼ -13.00%
- Reading proficiency
- 59% ▼ -6.00%
- Median HH income
- $90,091
- Composite
- 53.67/100
- National rank
- #1430
- State rank
- #47 of 826 in TX
Livability — Pearland
- Score
- 81/100
- State rank
- #32
- US rank
- #1539
Category grades
Schools grade is shown separately in the Schools card above.
Census & demographics
- County
- Brazoria County · 374,982 people
- City population
- 142,397
- Metro
- Houston-The Woodlands-Sugar Land, TX
- Population (ZIP)
- 51,332
- Household income
- $111,139
- Rent vs Own
- Severe rent burden
- 826.0
Population outlook (Brazoria County) Hauer SSP2
- Today (2025)
- 420,414 people
- By 2030
- 457,585 · +8.8%
- By 2040
- 532,232 · +26.6%
- By 2050
- 605,399 · +44.0%
- By 2075
- 779,358 · +85.4%
- By 2100
- 883,759 · +110.2%
Race, ethnicity, and origin ACS 2023
- Neighborhood character
- Diverse neighborhood (Simpson 0.66)
- Race & ethnicity
- White 47% Hispanic / Latino 33% Two or more races 20% Black 10% Asian 7%
- Hispanic origin (detail)
- Mexican 26% Puerto Rican 2%
- Common ancestry
- Lithuanian 2% Slovak 2% Romanian 2%
- Foreign-born
- 12% · Canada, Vietnam, Guatemala
- Languages at home
- 77% English-only · Spanish 16% Other Indo-European 3% Vietnamese 2%
Political lean MEDSL · Brazoria
- 2024 margin
- R (+19.7) · D 39.5% · R 59.2% · Other 1.3%
- 2008→2024 swing
- +9.9pp toward D · 2008: -29.6pp · 2024: -19.7pp
- All cycles
- 2024: R+19.7 2020: R+18.2 2016: R+24.6 2012: R+34.2 2008: R+29.6
Not yet ingested
- Civics
- —
Market trends
- HPI YoY
- ▼ -100.56%
- Current HPI
- 244.7942
- Rent YoY
- ▲ 2.94%
- Metro
- Houston-The Woodlands-Sugar Land, TX
- State GDP YoY
- ▲ 3.95%
- F500 in state
- 110
Industry mix (Fortune 500 HQ in TX)
| Industry | F500 HQs | Revenue |
|---|---|---|
| Energy | 16 | $1,198B |
|
||
| Technology | 5 | $198B |
|
||
| Engineering / Construction | 4 | $72B |
|
||
| Energy Services | 3 | $60B |
|
||
| Utilities | 3 | $41B |
|
||
| Healthcare | 2 | $330B |
|
||
Price history
1 event — show timeline
- 2025-04-29 Listed $109,900 Zillow
Cash-flow waterfall
monthlySold comps — $/sqft
last 12 mo · ≤1 miLoading sold comps…