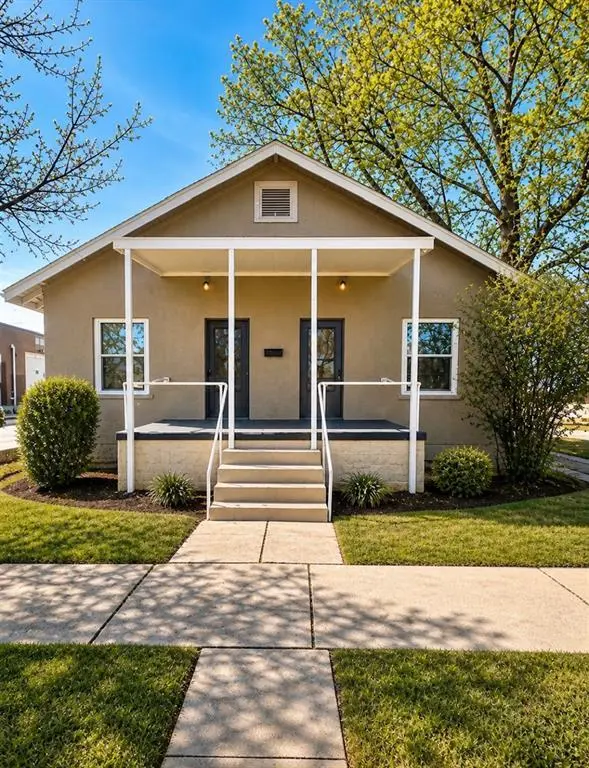
408 S 5th St · Chickasha, OK
Flood risk No data
- FEMA flood zone
- —
- Chance of flooding over 30 yrs
- —
- Est. flood insurance / yr
- —
Fire risk No data
- Est. fire insurance / yr
- —
Heat risk 6/10 · Moderate
- Hot days now (above threshold)
- 7 days/yr
- Hot days in 30 yrs
- 19 days/yr
Wind risk No data
- Chance of severe wind over 30 yrs
- —
Air-quality risk 2/10 · Minimal
- Unhealthy air days now
- 1 days/yr
- Unhealthy air days in 30 yrs
- 2 days/yr
Risk factors via First Street. Map © Google.
Why this score? — see what drove the B- grade
The composite is a weighted blend of 9 inputs, each scored 0–100. Each bar is that input's sub-score; the figure is the points it added to the 100-point composite (weight × sub-score).
- Cash flow +26.4/30.0
- ARV discount +15.0/15.0
- DSCR +9.0/10.0
- 1% rule +5.9/10.0
- Livability +3.3/5.0
- Rent growth +2.5/5.0
- Condition / age +2.5/5.0
- Schools +2.1/10.0
- Appreciation +0.0/10.0
$133,500
🖨 Deal sheet 📄 Offer letter ✓ Due diligence
Listing remarks
Unique and versatile property in the heart of Chickasha! 408 S 5th Street offers endless possibilities with two spacious living areas connected by a stunning double-sided fireplace. Currently modified into a single-family residence, this property still retains a flexible layout that could easily be converted back into a duplex for added income potential. Featuring central heat & air, this home is ideal for multi-generational living, rental income, or a live/work setup with one side serving as office space and the other as comfortable living quarters. Conveniently located near downtown Chickasha, shopping, dining, and local amenities. Whether you’re an investor, business owner, o
Key facts
- Central heat & air
- Live/work setup
- Flexible layout
Tags
Property features AI
Finance
- Other: Homestead exempt; Located in Chickasha Ot addition
- Financial info: Loan qualification possible; Not assumable
- HOA & community: No mandatory association dues
Exterior
- Utilities: Cable available; Electricity available; Natural gas available; High-speed internet available
- Home design: Single family residence; Two-level home; Residential property; Existing construction
- Construction: Stucco exterior; Composition roof; Conventional foundation
- Exterior features: Covered porch; Interior lot
Interior
- Bedrooms: 4 bedrooms
- Flooring: Carpet; Wood
- Bathrooms: 2 full bathrooms
- Heating & cooling: Electric heating
- Interior features: Two living areas; Study; Mock fireplace
Neighborhood map
What this means for you Summary
Snapshot
- This is a 3-bed/2.0-bath single-family listed at $134k.
Deal economics
- At list price, monthly cash flow is $350 ($4k/yr) — positive.
- The deal already cash-flows at list — no discount required.
- Meets the 1% rule at list price ($1k rent vs $134k).
- Cap rate 9.4% vs local median 4.8% in Chickasha — top-decile yield for the area; either an underpriced asset or a hidden risk that comps aren't pricing in. Stress-test before assuming the spread holds.
Location & tenants
- Location reads 66/100 on livability (#117 in OK) — a middle-class / working-renter tenant base. Strengths: cost of living A+, housing A+; Watch: amenities F, commute F, health & safety F.
- Chickasha (town): math 23% / reading 27% proficiency, ranked #115 of 270 in OK (top 43%) — low school quality limits family demand, transient renter base, plan for 1-2y turnover; 64% free/reduced lunch — lower-income household profile, screen leases tightly.
- Zoned schools: Bill Wallace Ec Ctr (460 students, 0% FRL); Chickasha Hs (math 12% / reading 27%, grade F, #296 of 447 statewide, top 67%, 749 students, 0% FRL) — zoned schools average 0% FRL vs 64% district-wide (64 pts lower); this property's tenant base skews higher-income than the district average.
- Market conditions: 203 active listings in the ZIP; 224 units permitted in Grady County in 2024 (0 in 5+ unit buildings).
- This rent runs 31% of the median local income ($56k/yr) — at the standard rent-burdened threshold; future hikes will face affordability resistance.
Forward outlook
- Local home prices are declining (-3.0%/yr); year-one equity from $923 of loan paydown is wiped out by about $4k of value loss. Plan a longer hold.
- Grady County population projected at +20% by 2050 — long-run rental-demand tailwind backs the buy-and-hold thesis.
- At projected returns (-3.0% appreciation + 3.0% rent growth), your $37k cash investment doubles in ~10 years — after that, you're playing with house money.
Negotiation context
- Only 1 days on market — expect competitive offers; lowballing is unlikely to land.
- 6 sale attempts since 21y ago with the ask held roughly flat each time — persistent listings suggest the price (not the market) is what's stuck; bring a comps-based counter.
- Current owner paid $19k; list at $134k implies a 615% gain — meaningful room to come down on a strong offer.
Risks & watch-outs
- Watch-outs: built in 1930 — expect roof / HVAC / electrical / plumbing capex.
- Climate carrying-cost: extreme-heat days projected 7→19/yr by 2055 (HVAC capex compounding) — expect insurance premiums to compound above CPI over the hold.
Questions for the listing agent
- Built in 1930 — when were the roof, HVAC, electrical panel, plumbing, and water heater last replaced?
- Is there a deadline driving the sale (1031 exchange, divorce, estate, relocation)? That informs how much negotiation room exists.
- Schools are D-rated, which usually means shorter tenancies and higher turnover. Who's the typical renter profile here, and what's been the actual vacancy rate?
- What's the average days-on-market for RENTAL listings here right now (not sales)? A rising rental-DOM trend means longer vacancies and softer asking-rent achievability than the comps imply.
- What's the recent tenant-quality profile in this submarket — average credit score on applications, eviction rate, late-payment / NSF rate, and stable-employment percentage? A property-management company in the area should have these aggregated.
- How much new for-sale + rental construction is in the pipeline within 1–3 miles? Heavy new supply typically softens prices + rents 12–24 months out; constrained supply supports both.
Investment metrics
- 1% rule
- 1.09% ✓
- Cap rate
- 9.44%
- Cash-on-cash
- 11.24%
- DSCR
- 1.50
- GRM
- 7.6
CMA / ARV
- ARV (on-the-fly)
- $190,080
- Comps found
- 6
Show comp detail 6 sales within ~0.75 mi
| Address | Dist | Beds/Ba | Sqft | Sold | Price | $/sf | Match |
|---|---|---|---|---|---|---|---|
| 511 W Minnesota Ave | 0.08mi | 4/2.5 (+1) | 2,784 (-6%) | 4mo | $108,000 | $39 | 75 |
| 1028 S 7th St | 0.51mi | 4/2.5 (+1) | 2,880 (-3%) | 3mo | $161,000 | $56 | 62 |
| 99 Todd Estates Dr | 0.42mi | 4/3.0 (+1) | 2,861 (-4%) | 10mo | $355,000 | $124 | 57 |
| 901 S 12th St | 0.63mi | 3/3.0 | 2,856 (-4%) | 20mo | $250,000 | $88 | 44 |
| 328 N 9th Cor | 0.58mi | 3/1.5 | 2,624 (-12%) | 14mo | $169,000 | $64 | 40 |
| 1402 W Minnesota Ave | 0.70mi | 3/2.0 | 2,559 (-14%) | 10mo | $80,000 | $31 | 36 |
Match score weights: distance 35% · size 25% · config 20% · recency 20%. Top-matched comps best support the ARV.
Projected returns pro-forma
-3.0% appreciation · 3.0% rent growth · sell at horizon
- IRR
- 0.4%
- Equity multiple
- 1.02×
- Total profit
- $613
- Equity at exit
- $19,905
- IRR
- 10.0%
- Equity multiple
- 1.78×
- Total profit
- $29,028
- Equity at exit
- $11,543
Cash invested: $37,380 (down + closing). Projections, not guarantees.
Landlord ↔ Tenant lean methodology
- Overall (STATE)
- 83 Strongly Landlord-Friendly
- State Oklahoma
- 83 Strongly Landlord-Friendly · R+20
- County
- — inherits STATE
- City
- — inherits STATE
ZIP-level market 73018
- Home prices YoY
- -21.1%
- Active inventory
- 203
- Price-to-rent
- 7.6×
Monthly cashflow live
- Estimated rent
- $1,455 medium interval (Pro) →
- Mortgage (P&I)
- −$700
- Tax from tax record
- −$44 /mo · $522/yr
- Insurance
- −$56
- HOA
- −$0
- Vacancy / Maint / Mgmt
- −$306
- Net cashflow
- $350
Break-even live
UW: 25.0% down · 7.5% · 30yr · 1.5% tax · 5.0% vac · 8.0% maint · 8.0% mgmt
Financing live
Cash to close
- Down payment
- $33,375
- Closing costs
- $4,005
- Reserves months
- —
- Total cash needed
- —
Loan-product check · same deal, 3 products live
Conventional
25% down · 7.5% · 30yr
- Down + closing
- —
- Monthly P&I
- —
- Monthly cashflow
- —
- DSCR
- —
- Eligible?
- —
Personal DTI + credit; lowest rate.
DSCR
20% down · 8.5% · 30yr
- Down + closing
- —
- Monthly P&I
- —
- Monthly cashflow
- —
- DSCR
- —
- Eligible?
- —
No personal income docs; deal must DSCR.
Hard money
10% down · 12.0% · 12mo
- Down + closing
- —
- Monthly P&I
- —
- Monthly cashflow
- —
- DSCR
- —
- Eligible?
- —
Short-term bridge; refi at stabilization.
Listing history 17 events
-
2026-05-04status Pending
-
2026-05-01$133,500 Active
-
2025-11-24historical
-
2025-11-01price $95,000
-
2025-10-18price $119,000
-
2025-08-15$132,500 Active
-
2025-02-28historical
-
2024-11-25price $135,000
-
2024-09-21$137,000 Active
-
2024-08-01historical
-
2024-05-07price $129,000
-
2024-01-12$147,000 Active
-
2011-11-23soldstatus $18,678
-
2011-10-10$14,999
-
2005-09-21soldstatus $25,000
-
2005-07-11$30,000
-
1997-05-02soldstatus $37,500
ⓘ Source: listings_history table (triggers on properties + properties_extension) + one-shot
backfill from property_details.listing_events for pre-trigger history.
Tax reassessment forecast OK · Resets to sale price
- Current annual tax
- $522 · $44/mo
- Projected year-2 tax
- $1,202 · $100/mo
- Expected delta
- +$680/yr (+$57/mo · 130.2%)
ⓘ Screening estimate from a state-policy table — verify with the county assessor before closing.
Climate risk First Street
- Heat 6/10 Major
- Air quality 2/10 Low 1 unhealthy d/yr today · 2 by 30 yrs out
Nearby sold comps map
Loading sold comps map…
Walkable amenities ~0.75 mi
Loading nearby amenities…
Taxation est. · year 1
- Rental income
- $17,458
- − Mortgage interest
- −$7,478
- − Property taxes
- −$522
- − Insurance
- −$668
- − Repairs & maintenance
- −$1,397
- − Management
- −$1,397
- − Depreciation
- −$3,884
- Taxable income
- $2,114
- Est. tax owed @ 24.0%
- −$507
- After-tax cash flow
- $3,694/yr
For passive investors: Depreciation is non-cash, so a rental often shows a tax loss while cash-flowing — sheltering income. Rental losses are passive: they offset passive income freely, and up to $25,000/yr can offset ordinary (W-2) income if you actively participate and your MAGI is under $100k (phasing out to $0 by $150k); unused losses carry forward. On sale, claimed depreciation is recaptured at up to 25%, and gains may owe capital-gains tax (a 1031 exchange can defer both). Figures are a year-1 estimate at your 24.0% rate — not tax advice; consult a CPA.
Schools (NCES district)
- District
- Chickasha
- NCES district ID
- 4007560
- Math proficiency
- 23% ▼ -11.00%
- Reading proficiency
- 27% ▼ -8.00%
- Median HH income
- $38,561
- Composite
- 20.95/100
- National rank
- #8476
- State rank
- #115 of 270 in OK
Livability — Chickasha
- Score
- 66/100
- State rank
- #117
- US rank
- #11902
Category grades
Schools grade is shown separately in the Schools card above.
Census & demographics
- Census place
- Chickasha, OK
- County
- Grady County · 20,505 people
- City population
- 20,505
- Metro
- Oklahoma City, OK
- Population (ZIP)
- 20,505
- Household income
- $56,484
- Rent vs Own
- Severe rent burden
- 685.0
Population outlook (Grady County) Hauer SSP2
- Today (2025)
- 59,962 people
- By 2030
- 62,513 · +4.3%
- By 2040
- 67,338 · +12.3%
- By 2050
- 71,719 · +19.6%
- By 2075
- 82,684 · +37.9%
- By 2100
- 89,387 · +49.1%
Race, ethnicity, and origin ACS 2023
- Neighborhood character
- Predominantly White (74%)
- Race & ethnicity
- White 74% Two or more races 11% Hispanic / Latino 9% Black 5% Native American 5%
- Hispanic origin (detail)
- Mexican 6%
- Common ancestry
- Slovak 2% Iranian 2% Italian 2%
- Foreign-born
- 2% · Canada
- Languages at home
- 96% English-only · Spanish 3%
Political lean MEDSL · Grady
- 2024 margin
- Solid R (+62.7) · D 17.9% · R 80.6% · Other 1.5%
- 2008→2024 swing
- -16.0pp toward R · 2008: -46.7pp · 2024: -62.7pp
- All cycles
- 2024: R+62.7 2020: R+62.3 2016: R+60.3 2012: R+51.2 2008: R+46.7
Not yet ingested
- Civics
- —
Market trends
- HPI YoY
- ▼ -66.82%
- Current HPI
- 249.6051
- Rent YoY
- —
- Metro
- Oklahoma City, OK
- State GDP YoY
- ▲ 1.55%
- F500 in state
- 6
Industry mix (Fortune 500 HQ in OK)
| Industry | F500 HQs | Revenue |
|---|---|---|
| Energy | 3 | $48B |
|
||
Price history
+256.0% since first listed17 events — show timeline
- 2026-05-04 Pending — MLSOK
- 2026-05-01 Listed $133,500 MLSOK
- 2025-11-24 Listing Removed — MLSOK
- 2025-11-01 Price Changed $95,000 MLSOK
- 2025-10-18 Price Changed $119,000 MLSOK
- 2025-08-15 Listed $132,500 MLSOK
- 2025-02-28 Listing Removed — MLSOK
- 2024-11-25 Price Changed $135,000 MLSOK
- 2024-09-21 Listed $137,000 MLSOK
- 2024-08-01 Listing Removed — MLSOK
- 2024-05-07 Price Changed $129,000 MLSOK
- 2024-01-12 Listed $147,000 MLSOK
- 2011-11-23 Sold (MLS) $18,678 MLSOK
- 2011-10-10 Listed $14,999 MLSOK
- 2005-09-21 Sold (MLS) $25,000 MLSOK
- 2005-07-11 Listed $30,000 MLSOK
- 1997-05-02 Sold (Public Records) $37,500 Public Records
Property tax history
+4.7%/yrLatest (2025): $522 · +5.7% YoY. Source: county tax records.
Cash-flow waterfall
monthlySold comps — $/sqft
last 12 mo · ≤1 miLoading sold comps…