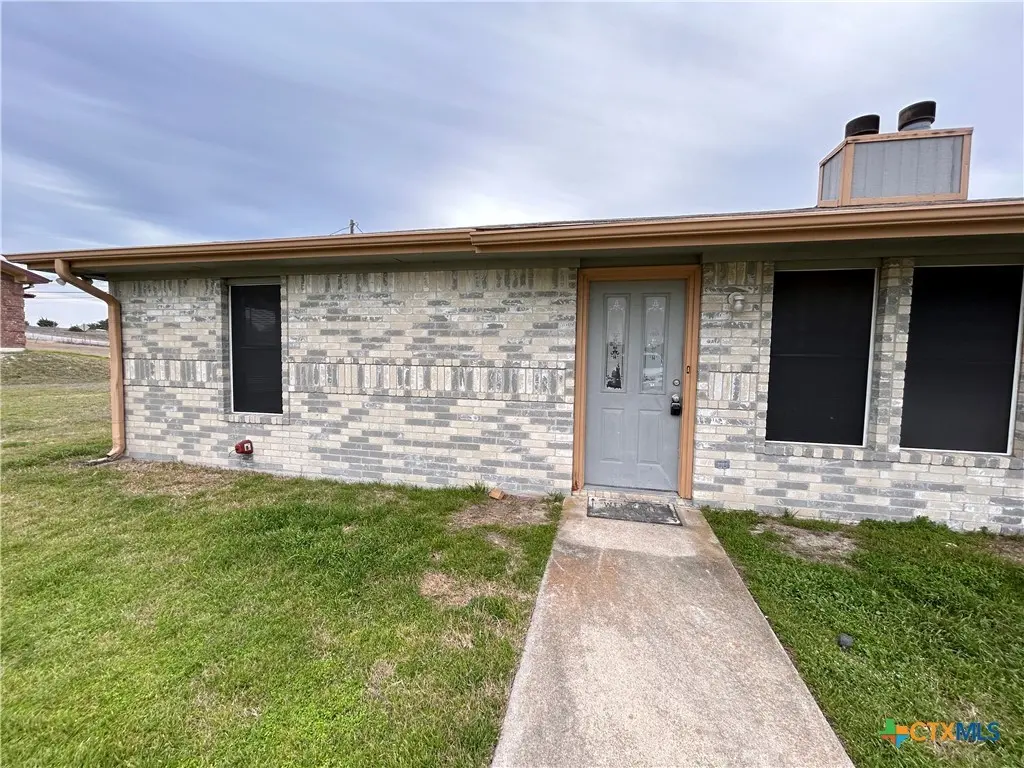
10411 Chaparral Rd · Killeen, TX
Flood risk 1/10 · Minimal
- FEMA flood zone
- X (unshaded)
- Chance of flooding over 30 yrs
- 0.0%
- Est. flood insurance / yr
- $507 – $1,088
Fire risk 6/10 · Moderate
- Est. fire insurance / yr
- $1,222 – $2,270
Heat risk 8/10 · Major
- Hot days now (above 107°F)
- 7 days/yr
- Hot days in 30 yrs
- 24 days/yr
Wind risk 6/10 · Moderate
- Chance of severe wind over 30 yrs
- 70.0%
Air-quality risk 2/10 · Minimal
- Unhealthy air days now
- 0 days/yr
- Unhealthy air days in 30 yrs
- 1 days/yr
Risk factors via First Street. Map © Google.
Why this score? — see what drove the D grade
The composite is a weighted blend of 9 inputs, each scored 0–100. Each bar is that input's sub-score; the figure is the points it added to the 100-point composite (weight × sub-score).
- Cash flow +14.5/30.0
- ARV discount +7.5/15.0
- 1% rule +4.9/10.0
- DSCR +4.4/10.0
- Livability +3.2/5.0
- Schools +3.0/10.0
- Condition / age +2.5/5.0
- Rent growth +2.0/5.0
- Appreciation +0.0/10.0
$189,000
🖨 Deal sheet (PDF) 📄 Offer letter ✓ Due diligence
Listing remarks MLS
Selling as a package of 3 duplexes only, cannot sell individually. no showings until after an accepted offer due to tenant coordination. MLS 605639, 605636, 605633. It is too difficult co corrdinate 6 tenants for showings at 1 time. These 3 duplexes sit next to each other and share the same road. All units are occupied with leases expiring in 2026. Total price is 690k for all 3 duplexes.
Key facts
- Built 1995
- Listed 115 days
Neighborhood map
What this means for you Summary
Snapshot
- This is a 4-bed/2.0-bath townhouse listed at $189k.
Deal economics
- At list price, monthly cash flow is $43 ($511/yr) — positive.
- The deal already cash-flows at list — no discount required.
- To meet the 1% rule (rent ≥ 1% of price), the offer needs to be $187k (1.0% below list).
- Recommended offer: $172k (9.0% below list) — sets the bar for market timing.
- Cap rate 6.6% vs local median 3.9% in Killeen — top-decile yield for the area; either an underpriced asset or a hidden risk that comps aren't pricing in. Stress-test before assuming the spread holds.
Location & tenants
- Location reads 63/100 on livability (#853 in TX) — a middle-class / working-renter tenant base. Strengths: cost of living A+, housing A+; Watch: amenities D, employment D, crime D-.
- Killeen ISD (urban): math 31% / reading 38% proficiency, ranked #524 of 826 in TX (top 63%) — families likely to look elsewhere, expect single-tenant / working-renter base with shorter leases.
- Zoned schools: Haynes El (math 23% / reading 29%, grade F, #2,954 of 4,322 statewide, top 69%, 780 students, 57% FRL); Charles E Patterson Middle (math 38% / reading 38%, grade F, #717 of 1,662 statewide, top 44%, 1,003 students, 56% FRL); C E Ellison H S (math 20% / reading 51%, grade F, #941 of 1,632 statewide, top 58%, 1,682 students, 57% FRL).
- Market conditions: Rents soft (-1.9%/yr); 653 active listings in the ZIP; 16 comparable units currently listed for rent nearby; rentals at typical pace (median 25d on market — plan ~3-4 weeks tenant-placement turnaround); 3,222 units permitted in Bell County in 2024 (246 in 5+ unit buildings).
- This rent runs 30% of the median local income ($74k/yr) — at the standard rent-burdened threshold; future hikes will face affordability resistance.
Forward outlook
- Local home prices are declining (-3.0%/yr); year-one equity from $1k of loan paydown is wiped out by about $6k of value loss. Plan a longer hold.
- Bell County population projected at +21% by 2050 — long-run rental-demand tailwind backs the buy-and-hold thesis.
Negotiation context
- It's been on market 115 days — a 9% lower offer ($172k) is reasonable based on typical stale-listing flexibility.
- 7 sale attempts since 14y ago; this cycle's ask has dropped $41k (18%) from the opening price — seller is motivated, your offer sets the floor, not the list.
- Current owner paid $73k; list at $189k implies a 160% gain — meaningful room to come down on a strong offer.
Risks & watch-outs
- Climate carrying-cost: major wind risk, 70% chance of damaging wind over 30y; major wildfire risk; extreme-heat days projected 7→24/yr by 2055 (HVAC capex compounding) — expect insurance premiums to compound above CPI over the hold.
Questions for the listing agent
- It's been on market 115 days. Have you received any prior offers? Is the seller open to a 9% concession, seller financing, or rate buy-down credit?
- Why hasn't it sold? Are there any deal-killer items the seller is aware of (foundation, flood, title, zoning, code violations)?
- Is there a deadline driving the sale (1031 exchange, divorce, estate, relocation)? That informs how much negotiation room exists.
- Schools are D-rated, which usually means shorter tenancies and higher turnover. Who's the typical renter profile here, and what's been the actual vacancy rate?
- Crime grade is D in this area — have there been break-ins, vandalism, or insurance claims at this property in the last 3 years? What carrier currently insures it and at what premium?
- The area grade is low — what's the realistic commute time and amenity access for the typical tenant pool here? Any planned neighborhood developments (good or bad) we should know about?
- What's the average days-on-market for RENTAL listings here right now (not sales)? A rising rental-DOM trend means longer vacancies and softer asking-rent achievability than the comps imply.
- What's the recent tenant-quality profile in this submarket — average credit score on applications, eviction rate, late-payment / NSF rate, and stable-employment percentage? A property-management company in the area should have these aggregated.
- How much new for-sale + rental construction is in the pipeline within 1–3 miles? Heavy new supply typically softens prices + rents 12–24 months out; constrained supply supports both.
Investment metrics
- 1% rule
- 0.99% ✗
- Cap rate
- 6.56%
- Cash-on-cash
- 0.96%
- DSCR
- 1.04
- GRM
- 8.4
CMA / ARV
No comps found within radius.
Projected returns pro-forma
-3.0% appreciation · 0.0% rent growth · sell at horizon
- IRR
- -18.5%
- Equity multiple
- 0.37×
- Total profit
- $-33,290
- Equity at exit
- $28,181
- IRR
- -19.2%
- Equity multiple
- 0.13×
- Total profit
- $-46,245
- Equity at exit
- $16,341
Cash invested: $52,920 (down + closing). Projections, not guarantees.
Landlord ↔ Tenant lean methodology
- Overall (STATE)
- 87 Strongly Landlord-Friendly
- State Texas
- 87 Strongly Landlord-Friendly · R+5
- County
- — inherits STATE
- City
- — inherits STATE
ZIP-level market 76542
- Home prices YoY
- -21.7%
- Rents YoY
- -1.9%
- Active inventory
- 653
- Price-to-rent
- 8.4×
Monthly cashflow live
- Estimated rent
- $1,870 high interval (Pro) →
- Mortgage (P&I)
- −$991
- Tax from tax record
- −$365 /mo · $4,382/yr
- Insurance
- −$79
- HOA
- −$0
- Vacancy / Maint / Mgmt
- −$393
- Net cashflow
- $43
Break-even live
Sensitivity live
| Price | -10% $150 | -5% $96 | +0% $43 | +5% $-11 | +10% $-64 |
|---|---|---|---|---|---|
| Rent | -10% $-105 | -5% $-31 | +0% $43 | +5% $116 | +10% $190 |
| Rate | -1.0pp $138 | -0.5pp $91 | base $43 | +0.5pp $-6 | +1.0pp $-56 |
UW: 25.0% down · 7.5% · 30yr · 1.5% tax · 5.0% vac · 8.0% maint · 8.0% mgmt
Financing live
Cash to close
- Down payment
- $47,250
- Closing costs
- $5,670
- Reserves months
- —
- Total cash needed
- —
Loan-product check · same deal, 3 products live
Conventional
25% down · 7.5% · 30yr
- Down + closing
- —
- Monthly P&I
- —
- Monthly cashflow
- —
- DSCR
- —
- Eligible?
- —
Personal DTI + credit; lowest rate.
DSCR
20% down · 8.5% · 30yr
- Down + closing
- —
- Monthly P&I
- —
- Monthly cashflow
- —
- DSCR
- —
- Eligible?
- —
No personal income docs; deal must DSCR.
Hard money
10% down · 12.0% · 12mo
- Down + closing
- —
- Monthly P&I
- —
- Monthly cashflow
- —
- DSCR
- —
- Eligible?
- —
Short-term bridge; refi at stabilization.
Rent comps 16 comps
| Address | Beds | Baths | Sqft | Rent | $/sqft | DOM | Units | Dist |
|---|---|---|---|---|---|---|---|---|
| 9911 Diana Dr Killeen, TX | 4.0 | 2.0 | 1667 | $1,795 | $1.08 | 15d | 1 | 0.85mi |
| 244 Ariana Ct Killeen, TX | 3.0 | 2.0 | 1920 | $1,850 | $0.96 | 15d | 1 | 0.99mi |
| 401 Dixon Dr Killeen, TX | 4.0 | 2.0 | 2157 | $1,745 | $0.81 | 15d | 1 | 1.02mi |
| 400 Paddock Ln Killeen, TX | 3.0 | 2.0 | 1618 | $1,800 | $1.11 | 45d | 1 | 1.07mi |
| 300 Curtis Dr Killeen, TX | 4.0 | 2.0 | 2132 | $1,945 | $0.91 | 15d | 1 | 1.09mi |
| 3307 Addison St Killeen, TX | 3.0 | 2.5 | 1987 | $1,995 | $1.00 | 23d | 1 | 1.13mi |
| 302 Saddleback Trl Killeen, TX | 3.0 | 2.0 | 1508 | $1,850 | $1.23 | 45d | 1 | 1.15mi |
| 9407 Zayden Dr Killeen, TX | 4.0 | 2.0 | 2154 | $1,900 | $0.88 | 45d | 1 | 1.20mi |
| 3303 Castleton Dr Killeen, TX | 3.0 | 2.0 | 1345 | $1,595 | $1.19 | 23d | 1 | 1.29mi |
| 9405 Glynhill Ct Killeen, TX | 3.0 | 2.0 | 1637 | $1,795 | $1.10 | 15d | 1 | 1.31mi |
| 3423 Addison St Killeen, TX | 3.0 | 2.0 | 1804 | $1,850 | $1.03 | 45d | 1 | 1.33mi |
| 3311 Rusack Dr Killeen, TX | 3.0 | 2.5 | 2130 | $1,750 | $0.82 | 45d | 1 | 1.33mi |
| 209 Brandy Loop Killeen, TX | 3.0 | 2.0 | 1321 | $1,445 | $1.09 | 25d | 1 | 1.34mi |
| 209 Brandy Loop Killeen, TX | 3.0 | 2.0 | 1321 | $1,445 | $1.09 | 23d | 1 | 1.34mi |
| 3520 Addison St Killeen, TX | 3.0 | 2.0 | 1335 | $1,795 | $1.34 | 45d | 1 | 1.44mi |
| 104 Christopher Dr Killeen, TX | 3.0 | 2.0 | 1862 | $1,862 | $1.00 | 25d | 1 | 1.45mi |
Listing history 35 events
-
2026-06-22days on market $189,000 Active 115 DOM
-
2026-06-18days on market $189,000 Active 112 DOM
-
2026-06-17days on market $189,000 Active 111 DOM
-
2026-06-16days on market $189,000 Active 110 DOM
-
2026-06-15days on market $189,000 Active 109 DOM
-
2026-06-14days on market $189,000 Active 107 DOM
-
2026-06-13days on market $189,000 Active 106 DOM
-
2026-06-10days on market $189,000 Active 104 DOM
-
2026-06-09days on market $189,000 Active 103 DOM
-
2026-06-09price $189,000 Active 102 DOM
-
2026-06-08days on market $199,000 Active 102 DOM
-
2026-06-07days on market $199,000 Active 101 DOM
-
2026-06-03days on market $199,000 Active 97 DOM
-
2026-06-02days on market $199,000 Active 96 DOM
-
2026-06-01days on market $199,000 Active 95 DOM
-
2026-05-31days on market $199,000 Active 94 DOM
-
2026-05-30days on market $199,000 Active 93 DOM
-
2026-04-20price $199,000 390-char remark
Show marketing remark (390 chars)
Selling as a package of 3 duplexes only, cannot sell individually. no showings until after an accepted offer due to tenant coordination. MLS 605639, 605636, 605633. It is too difficult co corrdinate 6 tenants for showings at 1 time. These 3 duplexes sit next to each other and share the same road. All units are occupied with leases expiring in 2026. Total price is 690k for all 3 duplexes.
-
2026-03-13price $210,000 390-char remark
Show marketing remark (390 chars)
Selling as a package of 3 duplexes only, cannot sell individually. no showings until after an accepted offer due to tenant coordination. MLS 605639, 605636, 605633. It is too difficult co corrdinate 6 tenants for showings at 1 time. These 3 duplexes sit next to each other and share the same road. All units are occupied with leases expiring in 2026. Total price is 690k for all 3 duplexes.
-
2026-02-26$230,000 Active 390-char remark
Show marketing remark (390 chars)
Selling as a package of 3 duplexes only, cannot sell individually. no showings until after an accepted offer due to tenant coordination. MLS 605639, 605636, 605633. It is too difficult co corrdinate 6 tenants for showings at 1 time. These 3 duplexes sit next to each other and share the same road. All units are occupied with leases expiring in 2026. Total price is 690k for all 3 duplexes.
-
2024-12-27historical $750
-
2024-10-29$750
-
2024-10-24historical $750
-
2024-10-11$750
-
2024-10-10historical
-
2024-07-30price $260,000
-
2024-06-26$275,000 Active
-
2024-04-10historical $850
-
2024-04-02price $850
-
2024-03-26price $895
-
2024-01-12$925
-
2013-04-29soldstatus $72,675
-
2012-12-21$72,675
-
2012-12-21$72,675
-
2008-01-10soldstatus
ⓘ Source: listings_history table (triggers on properties + properties_extension) + one-shot
backfill from property_details.listing_events for pre-trigger history.
Tax reassessment forecast TX · Resets to sale price
- Current annual tax
- $4,382 · $365/mo
- Projected year-2 tax
- $4,382 · $365/mo
- Expected delta
- $0/yr ($0/mo · 0.0%)
ⓘ Screening estimate from a state-policy table — verify with the county assessor before closing.
Climate risk First Street
- Flood 1/10 Low FEMA zone X (unshaded) · 0% chance over 30 yrs
- Wildfire 6/10 Major
- Heat 8/10 Severe 7 d/yr ≥107°F today · 24 d/yr by 30 yrs out
- Wind 6/10 Major 70% chance of damaging wind over 30 yrs
- Air quality 2/10 Low 0 unhealthy d/yr today · 1 by 30 yrs out
Nearby sold comps map
Loading sold comps map…
Walkable amenities ~0.75 mi
Loading nearby amenities…
Taxation est. · year 1
- Rental income
- $22,444
- − Mortgage interest
- −$10,587
- − Property taxes
- −$4,382
- − Insurance
- −$945
- − Repairs & maintenance
- −$1,796
- − Management
- −$1,796
- − Depreciation
- −$5,498
- Taxable loss
- −$2,559
- Est. tax savings @ 24.0%
- +$614
- After-tax cash flow
- $1,125/yr
For passive investors: Depreciation is non-cash, so a rental often shows a tax loss while cash-flowing — sheltering income. Rental losses are passive: they offset passive income freely, and up to $25,000/yr can offset ordinary (W-2) income if you actively participate and your MAGI is under $100k (phasing out to $0 by $150k); unused losses carry forward. On sale, claimed depreciation is recaptured at up to 25%, and gains may owe capital-gains tax (a 1031 exchange can defer both). Figures are a year-1 estimate at your 24.0% rate — not tax advice; consult a CPA.
Schools (NCES district)
- District
- Killeen ISD
- NCES district ID
- 4825660
- Math proficiency
- 31% ▼ -16.00%
- Reading proficiency
- 38% ▼ -3.00%
- Median HH income
- $47,665
- Composite
- 29.69/100
- National rank
- #6458
- State rank
- #524 of 826 in TX
Livability — Killeen
- Score
- 63/100
- State rank
- #853
- US rank
- #15359
Category grades
Schools grade is shown separately in the Schools card above.
Census & demographics
- Census place
- Killeen, TX
- County
- Bell County · 345,090 people
- City population
- 163,398
- Metro
- Killeen-Temple, TX
- Population (ZIP)
- 53,892
- Household income
- $74,055
- Rent vs Own
- Severe rent burden
- 1167.0
Population outlook (Bell County) Hauer SSP2
- Today (2025)
- 371,114 people
- By 2030
- 389,104 · +4.8%
- By 2040
- 420,592 · +13.3%
- By 2050
- 447,779 · +20.7%
- By 2075
- 499,130 · +34.5%
- By 2100
- 505,680 · +36.3%
Race, ethnicity, and origin ACS 2023
- Neighborhood character
- Highly diverse neighborhood (Simpson 0.74)
- Race & ethnicity
- Black 34% White 27% Hispanic / Latino 26% Two or more races 17% Asian 5%
- Hispanic origin (detail)
- Mexican 13% Puerto Rican 9%
- Common ancestry
- Italian 1% Lithuanian 1% Slovak 1%
- Foreign-born
- 10% · Canada, South Korea, Vietnam
- Languages at home
- 79% English-only · Spanish 15% Korean 1% German/W. Germanic 1%
Political lean MEDSL · Bell
- 2024 margin
- R (+16.2) · D 41.3% · R 57.6% · Other 1.1%
- 2008→2024 swing
- -6.5pp toward R · 2008: -9.8pp · 2024: -16.2pp
- All cycles
- 2024: R+16.2 2020: R+8.5 2016: R+15.1 2012: R+16.4 2008: R+9.8
Not yet ingested
- Civics
- —
Market trends
- HPI YoY
- ▼ -43.94%
- Current HPI
- 158.4385
- Rent YoY
- ▼ -1.85%
- Metro
- Killeen-Temple, TX
- State GDP YoY
- ▲ 3.95%
- F500 in state
- 110
Industry mix (Fortune 500 HQ in TX)
| Industry | F500 HQs | Revenue |
|---|---|---|
| Energy | 16 | $1,198B |
|
||
| Technology | 5 | $198B |
|
||
| Engineering / Construction | 4 | $72B |
|
||
| Energy Services | 3 | $60B |
|
||
| Utilities | 3 | $41B |
|
||
| Healthcare | 2 | $330B |
|
||
Price history
+173.8% since first listed18 events — show timeline
- 2026-04-20 Price Changed $199,000 CTXMLS
- 2026-03-13 Price Changed $210,000 CTXMLS
- 2026-02-26 Listed $230,000 CTXMLS
- 2024-12-27 Rental Removed $750 CTXMLS
- 2024-10-29 Listed for Rent $750 CTXMLS
- 2024-10-24 Rental Removed $750 CTXMLS
- 2024-10-11 Listed for Rent $750 CTXMLS
- 2024-10-10 Listing Removed — CTXMLS
- 2024-07-30 Price Changed $260,000 CTXMLS
- 2024-06-26 Listed $275,000 CTXMLS
- 2024-04-10 Rental Removed $850 APPFOLIO
- 2024-04-02 Price Changed $850 APPFOLIO
- 2024-03-26 Price Changed $895 APPFOLIO
- 2024-01-12 Listed for Rent $925 APPFOLIO
- 2013-04-29 Sold (MLS) $72,675 CTXMLS
- 2012-12-21 Listed $72,675 CTXMLS
- 2012-12-21 Listed $72,675 CTXMLS
- 2008-01-10 Sold (Public Records) — Public Records
Property tax history
+8.2%/yrLatest (2025): $4,382 · +20.7% YoY. Source: county tax records.
Cash-flow waterfall
monthlySold comps — $/sqft
last 12 mo · ≤1 miLoading sold comps…