 🏷️ Likely Rental
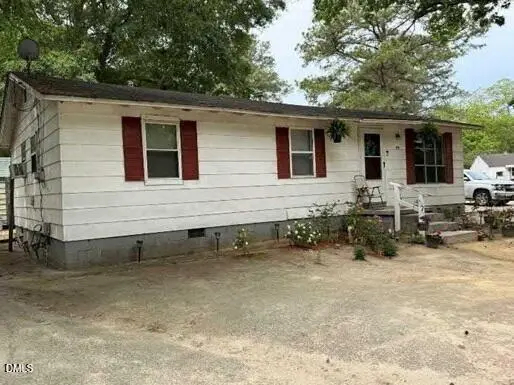
313 Tucker St · Enfield, NC
Flood risk 1/10 · Minimal
- FEMA flood zone
- X (unshaded)
- Chance of flooding over 30 yrs
- 0.0%
- Est. flood insurance / yr
- $473 – $860
Fire risk 2/10 · Minimal
- Est. fire insurance / yr
- $906 – $1,684
Heat risk 7/10 · Major
- Hot days now (above 107°F)
- 7 days/yr
- Hot days in 30 yrs
- 16 days/yr
Wind risk 6/10 · Moderate
- Chance of severe wind over 30 yrs
- 73.0%
Air-quality risk 1/10 · Minimal
- Unhealthy air days now
- 0 days/yr
- Unhealthy air days in 30 yrs
- 0 days/yr
Risk factors via First Street. Map © Google.
Why this score? — see what drove the C+ grade
The composite is a weighted blend of 9 inputs, each scored 0–100. Each bar is that input's sub-score; the figure is the points it added to the 100-point composite (weight × sub-score).
- Cash flow +17.8/30.0
- ARV discount +15.0/15.0
- Appreciation +7.9/10.0
- DSCR +5.6/10.0
- 1% rule +5.2/10.0
- Livability +3.0/5.0
- Rent growth +2.5/5.0
- Condition / age +2.5/5.0
- Schools +1.2/10.0
$89,000
🖨 Deal sheet (PDF) 📄 Offer letter ✓ Due diligence
Listing remarks MLS
AUCTION~ cash, ''as is''. Price shown is tax value. One of 46 properties in an investment portfolio. This property consists of 3 houses, Tenant occupied, $1,600/mo. Access our website for all the addresses in this offering.
Key facts
- 0.62 acre lot
- 3 parking spots
- Built 1969
Property features AI
Finance
- Other: Annual tax noted
- Financial info: 4 total units; Owner pays property taxes
- HOA & community: No association
Exterior
- Parking: Driveway; 3 open parking spaces
- Utilities: Public water; Public sewer; Power available
- Home design: Multi-family property; Single-story
- Construction: Wood siding construction; Block foundation; Asphalt roof; Built with 2,520 total building area
- Exterior features: Public-maintained road access; Lot of about 0.62 acres
Interior
- Bedrooms: 3 bedrooms
- Flooring: Carpet; Vinyl
- Bathrooms: 6 full bathrooms
- Heating & cooling: Electric heating; Central air; Window unit(s)
- Interior features: Carpet and vinyl flooring
Neighborhood map
What this means for you Summary
Snapshot
- This is a 3-bed/1.0-bath single-family listed at $89k.
Deal economics
- At list price, monthly cash flow is $73 ($877/yr) — positive.
- The deal already cash-flows at list — no discount required.
- Meets the 1% rule at list price ($909 rent vs $89k).
- Recommended offer: $86k (3.0% below list) — sets the bar for market timing.
Location & tenants
- Location reads 59/100 on livability (#556 in NC) — a working-class tenant base; expect higher turnover. Strengths: cost of living A+, health & safety A, crime B; Watch: schools F, amenities F, commute F.
- Halifax County Schools (rural): math 6% / reading 24% proficiency, ranked #177 of 178 in NC (top 99%) — low school quality limits family demand, transient renter base, plan for 1-2y turnover; 82% free/reduced lunch — lower-income household profile, screen leases tightly.
- Market conditions: 28 active listings in the ZIP; 55 units permitted in Halifax County in 2024 (0 in 5+ unit buildings).
Forward outlook
- In year one you build about $6k of equity ($615 loan paydown + $5k appreciation (5.8% local appreciation)).
- Halifax County population projected at -27% by 2050 — secular population decline; favor cash flow + early exit over multi-decade hold.
- At projected returns (5.8% appreciation + 3.0% rent growth), your $25k cash investment doubles in ~4 years — after that, you're playing with house money.
- By year 6, paydown + projected appreciation supports a ~$31k cash-out refi (75% LTV) — recoverable capital for the next deal without selling this one.
Negotiation context
- It's been on market 31 days — a 3% lower offer ($86k) is reasonable based on typical stale-listing flexibility.
- 2 sale attempts with the ask held roughly flat each time — persistent listings suggest the price (not the market) is what's stuck; bring a comps-based counter.
- Current owner paid $13k; list at $89k implies a 585% gain — meaningful room to come down on a strong offer.
Risks & watch-outs
- Climate carrying-cost: major wind risk, 73% chance of damaging wind over 30y; extreme-heat days projected 7→16/yr by 2055 (HVAC capex compounding) — expect insurance premiums to compound above CPI over the hold.
Questions for the listing agent
- It's been on market 31 days. Have you received any prior offers? Is the seller open to a 3% concession, seller financing, or rate buy-down credit?
- Built in 1969 — when were the roof, HVAC, electrical panel, plumbing, and water heater last replaced?
- Is there a deadline driving the sale (1031 exchange, divorce, estate, relocation)? That informs how much negotiation room exists.
- Schools are F-rated, which usually means shorter tenancies and higher turnover. Who's the typical renter profile here, and what's been the actual vacancy rate?
- What's the average days-on-market for RENTAL listings here right now (not sales)? A rising rental-DOM trend means longer vacancies and softer asking-rent achievability than the comps imply.
- What's the recent tenant-quality profile in this submarket — average credit score on applications, eviction rate, late-payment / NSF rate, and stable-employment percentage? A property-management company in the area should have these aggregated.
- How much new for-sale + rental construction is in the pipeline within 1–3 miles? Heavy new supply typically softens prices + rents 12–24 months out; constrained supply supports both.
Investment metrics
- 1% rule
- 1.02% ✓
- Cap rate
- 7.28%
- Cash-on-cash
- 3.52%
- DSCR
- 1.16
- GRM
- 8.2
CMA / ARV
- ARV (on-the-fly)
- $116,160
- Comps found
- 4
Show comp detail 4 sales within ~0.75 mi
| Address | Dist | Beds/Ba | Sqft | Sold | Price | $/sf | Match |
|---|---|---|---|---|---|---|---|
| 400 Mcgwigan St | 0.06mi | 2/1.0 (-1) | 1,000 (+4%) | 21mo | $60,000 | $60 | 68 |
| 506 Mcgwigan St | 0.14mi | 2/1.0 (-1) | 826 (-14%) | 1mo | $100,000 | $121 | 65 |
| 115 Dr M L King Jr Ave | 0.57mi | 3/1.0 | 884 (-8%) | 9mo | $45,000 | $51 | 52 |
| 104 Busbee Ct | 0.64mi | 3/2.0 | 1,025 (+7%) | 19mo | $130,000 | $127 | 39 |
Match score weights: distance 35% · size 25% · config 20% · recency 20%. Top-matched comps best support the ARV.
Projected returns pro-forma
5.76% appreciation · 3.0% rent growth · sell at horizon
- IRR
- 17.7%
- Equity multiple
- 2.17×
- Total profit
- $29,108
- Equity at exit
- $54,590
- IRR
- 17.5%
- Equity multiple
- 4.31×
- Total profit
- $82,393
- Equity at exit
- $97,844
Cash invested: $24,920 (down + closing). Projections, not guarantees.
Landlord ↔ Tenant lean methodology
- Overall (STATE)
- 85 Strongly Landlord-Friendly
- State North Carolina
- 85 Strongly Landlord-Friendly · R+3
- County
- — inherits STATE
- City
- — inherits STATE
ZIP-level market 27823
- Home prices YoY
- 3.1%
- Active inventory
- 28
- Price-to-rent
- 8.2×
Monthly cashflow live
- Estimated rent
- $909 medium interval (Pro) →
- Mortgage (P&I)
- −$467
- Tax from tax record
- −$141 /mo · $1,697/yr
- Insurance
- −$37
- HOA
- −$0
- Vacancy / Maint / Mgmt
- −$191
- Net cashflow
- $73
Break-even live
Sensitivity live
| Price | -10% $124 | -5% $98 | +0% $73 | +5% $48 | +10% $23 |
|---|---|---|---|---|---|
| Rent | -10% $1 | -5% $37 | +0% $73 | +5% $109 | +10% $145 |
| Rate | -1.0pp $118 | -0.5pp $96 | base $73 | +0.5pp $50 | +1.0pp $27 |
UW: 25.0% down · 7.5% · 30yr · 1.5% tax · 5.0% vac · 8.0% maint · 8.0% mgmt
Financing live
Cash to close
- Down payment
- $22,250
- Closing costs
- $2,670
- Reserves months
- —
- Total cash needed
- —
Loan-product check · same deal, 3 products live
Conventional
25% down · 7.5% · 30yr
- Down + closing
- —
- Monthly P&I
- —
- Monthly cashflow
- —
- DSCR
- —
- Eligible?
- —
Personal DTI + credit; lowest rate.
DSCR
20% down · 8.5% · 30yr
- Down + closing
- —
- Monthly P&I
- —
- Monthly cashflow
- —
- DSCR
- —
- Eligible?
- —
No personal income docs; deal must DSCR.
Hard money
10% down · 12.0% · 12mo
- Down + closing
- —
- Monthly P&I
- —
- Monthly cashflow
- —
- DSCR
- —
- Eligible?
- —
Short-term bridge; refi at stabilization.
Listing history 20 events
-
2026-06-19days on market $89,000 Active 31 DOM
-
2026-06-18days on market $89,000 Active 30 DOM
-
2026-06-17days on market $89,000 Active 29 DOM
-
2026-06-16days on market $89,000 Active 28 DOM
-
2026-06-15days on market $89,000 Active 27 DOM
-
2026-06-14days on market $89,000 Active 25 DOM
-
2026-06-12days on market $89,000 Active 24 DOM
-
2026-06-09days on market $89,000 Active 21 DOM
-
2026-06-08days on market $89,000 Active 20 DOM
-
2026-06-07days on market $89,000 Active 19 DOM
-
2026-06-07days on market $89,000 Active 18 DOM
-
2026-06-02days on market $89,000 Active 14 DOM
-
2026-06-01days on market $89,000 Active 13 DOM
-
2026-05-31days on market $89,000 Active 12 DOM
-
2026-05-30days on market $89,000 Active 11 DOM
-
2026-05-19$89,000 Active
-
2026-05-18$89,000 Active 223-char remark
Show marketing remark (223 chars)
AUCTION~ cash, ''as is''. Price shown is tax value. One of 46 properties in an investment portfolio. This property consists of 3 houses, Tenant occupied, $1,600/mo. Access our website for all the addresses in this offering.
-
2011-04-01soldstatus $13,000
-
2010-11-16soldstatus $68,000
-
2003-08-05soldstatus $100,000
ⓘ Source: listings_history table (triggers on properties + properties_extension) + one-shot
backfill from property_details.listing_events for pre-trigger history.
Tax reassessment forecast NC · Resets to sale price
- Current annual tax
- $1,697 · $141/mo
- Projected year-2 tax
- $1,697 · $141/mo
- Expected delta
- $0/yr ($0/mo · 0.0%)
ⓘ Screening estimate from a state-policy table — verify with the county assessor before closing.
Climate risk First Street
- Flood 1/10 Low FEMA zone X (unshaded) · 0% chance over 30 yrs
- Wildfire 2/10 Low
- Heat 7/10 Severe 7 d/yr ≥107°F today · 16 d/yr by 30 yrs out
- Wind 6/10 Major 73% chance of damaging wind over 30 yrs
- Air quality 1/10 Low 0 unhealthy d/yr today · 0 by 30 yrs out
Nearby sold comps map
Loading sold comps map…
Walkable amenities ~0.75 mi
Loading nearby amenities…
Taxation est. · year 1
- Rental income
- $10,912
- − Mortgage interest
- −$4,985
- − Property taxes
- −$1,697
- − Insurance
- −$445
- − Repairs & maintenance
- −$873
- − Management
- −$873
- − Depreciation
- −$2,589
- Taxable loss
- −$551
- Est. tax savings @ 24.0%
- +$132
- After-tax cash flow
- $1,010/yr
For passive investors: Depreciation is non-cash, so a rental often shows a tax loss while cash-flowing — sheltering income. Rental losses are passive: they offset passive income freely, and up to $25,000/yr can offset ordinary (W-2) income if you actively participate and your MAGI is under $100k (phasing out to $0 by $150k); unused losses carry forward. On sale, claimed depreciation is recaptured at up to 25%, and gains may owe capital-gains tax (a 1031 exchange can defer both). Figures are a year-1 estimate at your 24.0% rate — not tax advice; consult a CPA.
Schools (NCES district)
- District
- Halifax County Schools
- NCES district ID
- 3701950
- Math proficiency
- 6% ▼ -11.00%
- Reading proficiency
- 24% ▼ -1.00%
- Median HH income
- $29,104
- Composite
- 11.7/100
- National rank
- #9690
- State rank
- #177 of 178 in NC
Livability — Enfield
- Score
- 59/100
- State rank
- #556
- US rank
- #20483
Category grades
Schools grade is shown separately in the Schools card above.
Census & demographics
- Census place
- Enfield, NC
- Population (ZIP)
- 6,498
Population outlook (Halifax County) Hauer SSP2
- Today (2025)
- 47,976 people
- By 2030
- 45,450 · -5.3%
- By 2040
- 39,980 · -16.7%
- By 2050
- 34,863 · -27.3%
- By 2075
- 25,577 · -46.7%
- By 2100
- 18,365 · -61.7%
Race, ethnicity, and origin ACS 2023
- Neighborhood character
- Predominantly Black (82%)
- Race & ethnicity
- Black 82% White 12% Two or more races 3% Native American 2% Hispanic / Latino 2%
- Foreign-born
- 1% · Canada
- Languages at home
- 98% English-only · Spanish 1% French/Haitian/Cajun 0%
Political lean MEDSL · Halifax
- 2024 margin
- D (+17.7) · D 58.5% · R 40.9%
- 2008→2024 swing
- -10.6pp toward R · 2008: 28.2pp · 2024: 17.7pp
- All cycles
- 2024: D+17.7 2020: D+21.2 2016: D+26.9 2012: D+32.0 2008: D+28.2
Not yet ingested
- Civics
- —
Market trends
- HPI YoY
- ▲ 5.76%
- Current HPI
- 188.4289
- Rent YoY
- —
- Metro
- —
- State GDP YoY
- ▲ 3.28%
- F500 in state
- 26
Industry mix (Fortune 500 HQ in NC)
| Industry | F500 HQs | Revenue |
|---|---|---|
| Financial Services | 2 | $213B |
|
||
| Retail | 2 | $95B |
|
||
| Industrial Conglomerate | 1 | $38B |
|
||
| Metals / Steel | 1 | $35B |
|
||
| Utilities | 1 | $30B |
|
||
| Industrial Machinery | 1 | $19B |
|
||
Price history
-11.0% since first listed5 events — show timeline
- 2026-05-19 Listed $89,000 TMLS
- 2026-05-18 Listed $89,000 Hive MLS
- 2011-04-01 Sold (Public Records) $13,000 Public Records
- 2010-11-16 Sold (Public Records) $68,000 Public Records
- 2003-08-05 Sold (Public Records) $100,000 Public Records
Property tax history
+2.6%/yrLatest (2025): $1,697 · +0.5% YoY. Source: county tax records.
Cash-flow waterfall
monthlySold comps — $/sqft
last 12 mo · ≤1 miLoading sold comps…