 Multi-family
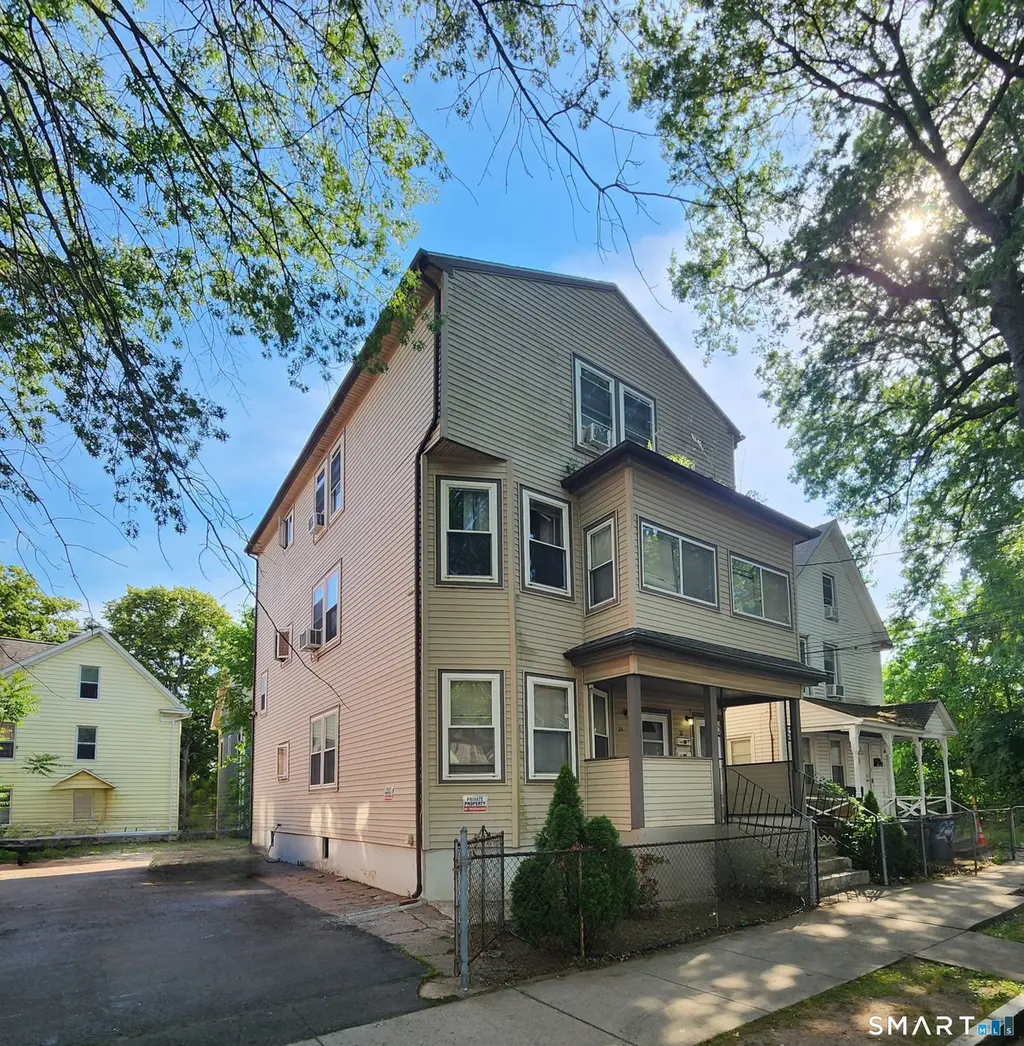
24 Hazel St · New Haven, CT
Flood risk 1/10 · Minimal
- FEMA flood zone
- X (unshaded)
- Chance of flooding over 30 yrs
- 0.0%
- Est. flood insurance / yr
- $473 – $860
Fire risk 1/10 · Minimal
- Est. fire insurance / yr
- $829 – $1,539
Heat risk 6/10 · Moderate
- Hot days now (above 99°F)
- 7 days/yr
- Hot days in 30 yrs
- 16 days/yr
Wind risk 6/10 · Moderate
- Chance of severe wind over 30 yrs
- 51.0%
Air-quality risk 5/10 · Moderate
- Unhealthy air days now
- 6 days/yr
- Unhealthy air days in 30 yrs
- 8 days/yr
Risk factors via First Street. Map © Google.
Why this score? — see what drove the D+ grade
The composite is a weighted blend of 9 inputs, each scored 0–100. Each bar is that input's sub-score; the figure is the points it added to the 100-point composite (weight × sub-score).
- Cash flow +23.6/30.0
- DSCR +7.6/10.0
- 1% rule +5.9/10.0
- Livability +4.0/5.0
- Rent growth +3.2/5.0
- Condition / age +2.5/5.0
- Schools +1.5/10.0
- ARV discount +0.0/15.0
- Appreciation +0.0/10.0
$550,000
🖨 Deal sheet 📄 Offer letter ✓ Due diligence
Multi-family units
County records classify this as Multi-Family (2-4 Unit). Listing-text estimate: 1 unit. estimate disagrees with records
Listing remarks MLS
Very well kept 3 family New Haven home! All 3 units with separate entrance & utilities! All 3 units include Open floor plan, spacious 2 bedroom and full bath! 2 year old ROOF, 2 BRAND NEW furnaces and also 2 BRAND NEW Water Heaters! Great square footage and plenty of parking for tenants! Add this investment to your portfolio today! Showings on this property will start Monday 7/29
Key facts
- 3,920 sq ft lot
- 4 parking spots
- Built 1900
Property features AI
Finance
- Other: Basement fully finished with full height; finished walk-up attic with storage space
- Financial info: Multi-family for sale (3 units) — income/expense details not provided
- HOA & community: No HOA details provided
Exterior
- Parking: Off-street parking; Driveway (paved); 4 parking spaces
- Security: No security details provided
- Utilities: Public water; Public sewer; Natural gas hot water; Natural gas for heating; Thermopane windows
- Home design: Multi-family property (3-family); Private paved asphalt driveway
- Construction: Built with frame and brick construction; Block and concrete foundation; Asphalt shingle roof; Vinyl siding
- Exterior features: Balcony; Covered deck; Level lot
Interior
- Kitchen: No kitchen appliance details provided
- Bedrooms: 6 bedrooms
- Flooring: No flooring details provided
- Bathrooms: 3 full bathrooms
- Heating & cooling: Hot air heating using natural gas; Window unit cooling
- Interior features: 15 total rooms; Electric outlets and thermostats; Window cooling unit(s)
- Laundry & utility: Basement laundry hook-ups
Neighborhood map
What this means for you Summary
Snapshot
- This is a 6-bed/3.0-bath multifamily listed at $550k.
Deal economics
- At list price, monthly cash flow is $1k ($12k/yr) — positive.
- The deal already cash-flows at list — no discount required.
- Meets the 1% rule at list price ($6k rent vs $550k).
- Cap rate 8.5% vs local median 4.8% in New Haven — top-decile yield for the area; either an underpriced asset or a hidden risk that comps aren't pricing in. Stress-test before assuming the spread holds.
Location & tenants
- Location reads 79/100 on livability (#31 in CT, #2,190 nationally) — a middle-class / working-renter tenant base. Strengths: amenities A+, commute A+, health & safety A+; Watch: schools D+, employment D, crime F.
- New Haven School District (urban): math 12% / reading 25% proficiency, ranked #147 of 153 in CT (top 96%) — low school quality limits family demand, transient renter base, plan for 1-2y turnover; 66% free/reduced lunch — lower-income household profile, screen leases tightly.
- Market conditions: Rents rising (+2.6%/yr); 137 active listings in the ZIP; 15 comparable units currently listed for rent nearby; rentals at typical pace (median 23d on market — plan ~3-4 weeks tenant-placement turnaround); 1,059 units permitted in South Central Connecticut Planning Region in 2024 (779 in 5+ unit buildings).
- At $5,987/mo this rent would consume 120% of the median local household income ($60k/yr) (locally 4999% of renters already pay >50% of income on rent) — very limited rent-growth headroom before tenants either downsize or default.
Forward outlook
- Local home prices are declining (-3.0%/yr); year-one equity from $4k of loan paydown is wiped out by about $16k of value loss. Plan a longer hold.
Negotiation context
- Only 6 days on market — expect competitive offers; lowballing is unlikely to land.
- Current owner paid $221k; list at $550k implies a 149% gain — meaningful room to come down on a strong offer.
Risks & watch-outs
- Watch-outs: built in 1900 — expect roof / HVAC / electrical / plumbing capex.
- Climate carrying-cost: major wind risk, 51% chance of damaging wind over 30y; extreme-heat days projected 7→16/yr by 2055 (HVAC capex compounding) — expect insurance premiums to compound above CPI over the hold.
Questions for the listing agent
- Built in 1900 — when were the roof, HVAC, electrical panel, plumbing, and water heater last replaced?
- Is there a deadline driving the sale (1031 exchange, divorce, estate, relocation)? That informs how much negotiation room exists.
- Schools are D-rated, which usually means shorter tenancies and higher turnover. Who's the typical renter profile here, and what's been the actual vacancy rate?
- Crime grade is F in this area — have there been break-ins, vandalism, or insurance claims at this property in the last 3 years? What carrier currently insures it and at what premium?
- The area grade is low — what's the realistic commute time and amenity access for the typical tenant pool here? Any planned neighborhood developments (good or bad) we should know about?
- What's the average days-on-market for RENTAL listings here right now (not sales)? A rising rental-DOM trend means longer vacancies and softer asking-rent achievability than the comps imply.
- What's the recent tenant-quality profile in this submarket — average credit score on applications, eviction rate, late-payment / NSF rate, and stable-employment percentage? A property-management company in the area should have these aggregated.
- How much new apartment / multifamily construction is in the pipeline within 1–3 miles? Heavy new supply (>2% of stock underway) typically softens rents 12–24 months out; light construction supports rent growth.
Investment metrics
- 1% rule
- 1.09% ✓
- Cap rate
- 8.55%
- Cash-on-cash
- 8.06%
- DSCR
- 1.36
- GRM
- 7.7
CMA / ARV
- ARV (on-the-fly)
- $413,472
- Comps found
- 12
Show comp detail 12 sales within ~0.75 mi
| Address | Dist | Beds/Ba | Sqft | Sold | Price | $/sf | Match |
|---|---|---|---|---|---|---|---|
| 19 Bassett St | 0.23mi | 5/3.0 (-1) | 2,820 (-0%) | 8mo | $415,000 | $147 | 77 |
| 64 Lilac St | 0.16mi | 6/3.0 | 3,075 (+9%) | 4mo | $363,000 | $118 | 74 |
| 77 Gibbs St | 0.36mi | 5/3.0 (-1) | 2,916 (+3%) | 0mo | $370,000 | $127 | 73 |
| 39 Lander St | 0.45mi | 6/3.0 | 2,862 (+1%) | 6mo | $490,000 | $171 | 72 |
| 98 Thompson St | 0.19mi | 5/3.0 (-1) | 3,042 (+7%) | 4mo | $465,000 | $153 | 70 |
| 152 Sheffield Ave | 0.12mi | 6/2.0 | 3,184 (+12%) | 10mo | $410,000 | $129 | 61 |
| 292 W Ivy St | 0.55mi | 5/3.0 (-1) | 2,883 (+2%) | 6mo | $490,000 | $170 | 61 |
| 151 Read St | 0.45mi | 6/2.0 | 2,735 (-3%) | 10mo | $310,000 | $113 | 60 |
| 67 Read St | 0.36mi | 7/2.5 (+1) | 2,672 (-6%) | 8mo | $390,000 | $146 | 60 |
| 92 Shepard St | 0.43mi | 5/3.0 (-1) | 3,017 (+6%) | 9mo | $415,000 | $138 | 56 |
| 229 Goodrich St | 0.52mi | 7/3.0 (+1) | 3,010 (+6%) | 10mo | $445,000 | $148 | 52 |
| 445 Dixwell Ave | 0.41mi | 6/2.0 | 3,212 (+13%) | 7mo | $340,000 | $106 | 49 |
Match score weights: distance 35% · size 25% · config 20% · recency 20%. Top-matched comps best support the ARV.
Projected returns pro-forma
-3.0% appreciation · 2.6% rent growth · sell at horizon
- IRR
- -4.5%
- Equity multiple
- 0.83×
- Total profit
- $-25,623
- Equity at exit
- $82,007
- IRR
- 4.8%
- Equity multiple
- 1.34×
- Total profit
- $52,847
- Equity at exit
- $47,554
Cash invested: $154,000 (down + closing). Projections, not guarantees.
Landlord ↔ Tenant lean methodology
- Overall (STATE)
- 27 Tenant-Leaning
- State Connecticut
- 27 Tenant-Leaning · D+7
- County
- — inherits STATE
- City
- — inherits STATE
ZIP-level market 06511
- Home prices YoY
- -20.8%
- Rents YoY
- 2.6%
- Active inventory
- 137
- Price-to-rent
- 23.0×
Monthly cashflow live
- Estimated rent
- $5,987 high interval (Pro) →
- Mortgage (P&I)
- −$2,884
- Tax from tax record
- −$582 /mo · $6,984/yr
- Insurance
- −$229
- HOA
- −$0
- Vacancy / Maint / Mgmt
- −$1,257
- Net cashflow
- $1,034
Break-even live
3-unit breakdown (identical units grouped — click to expand)
| Units | Beds | Baths | Est. rent |
|---|---|---|---|
| 3× units | 2 | 1.5 | $5,988 |
| #1 | 2 | 1.5 | $1,996 |
| #2 | 2 | 1.5 | $1,996 |
| #3 | 2 | 1.5 | $1,996 |
| Total (3 units) | $5,987 | ||
UW: 25.0% down · 7.5% · 30yr · 1.5% tax · 5.0% vac · 8.0% maint · 8.0% mgmt
Financing live
Cash to close
- Down payment
- $137,500
- Closing costs
- $16,500
- Reserves months
- —
- Total cash needed
- —
Loan-product check · same deal, 3 products live
Conventional
25% down · 7.5% · 30yr
- Down + closing
- —
- Monthly P&I
- —
- Monthly cashflow
- —
- DSCR
- —
- Eligible?
- —
Personal DTI + credit; lowest rate.
DSCR
20% down · 8.5% · 30yr
- Down + closing
- —
- Monthly P&I
- —
- Monthly cashflow
- —
- DSCR
- —
- Eligible?
- —
No personal income docs; deal must DSCR.
Hard money
10% down · 12.0% · 12mo
- Down + closing
- —
- Monthly P&I
- —
- Monthly cashflow
- —
- DSCR
- —
- Eligible?
- —
Short-term bridge; refi at stabilization.
Rent comps 15 comps
| Address | Beds | Baths | Sqft | Rent | $/sqft | DOM | Units | Dist |
|---|---|---|---|---|---|---|---|---|
| 589 Winchester Ave Unit 3 New Haven, CT | 5.0 | 1.0 | 3936 | $2,650 | $0.67 | 43d | 1 | 0.07mi |
| 55 Admiral St Unit 2 New Haven, CT | 5.0 | 3.0 | 2000 | $3,295 | $1.65 | 23d | 1 | 0.58mi |
| 50 Admiral St New Haven, CT | 5.0 | 2.0 | 2157 | $2,700 | $1.25 | 18d | 1 | 0.60mi |
| 134 Mansfield St New Haven, CT | 5.0 | 2.0 | 1960 | $5,500 | $2.81 | 23d | 1 | 0.64mi |
| 432 Norton Pkwy New Haven, CT | 5.0 | 3.0 | 2493 | $4,195 | $1.68 | 43d | 1 | 0.87mi |
| 347 Sherman Ave New Haven, CT | 5.0 | 3.0 | 3153 | $2,300 | $0.73 | 43d | 1 | 0.97mi |
| 355 Norton St Unit 1 New Haven, CT | 5.0 | 2.5 | 2500 | $3,300 | $1.32 | 21d | 1 | 0.97mi |
| 54 Trumbull St Unit 54-1 New Haven, CT | 5.0 | 2.5 | 2250 | $6,695 | $2.98 | 14d | 1 | 1.14mi |
| 229 Dwight St New Haven, CT | 6.0 | 2.0 | 2400 | $4,995 | $2.08 | 2d | 1 | 1.19mi |
| 1519 Ella T Grasso Blvd Unit N/A New Haven, CT | 5.0 | 2.0 | 2750 | $4,450 | $1.62 | 23d | 1 | 1.21mi |
| 67 Edgewood Ave New Haven, CT | 7.0 | 2.5 | 2000 | $6,100 | $3.05 | 43d | 1 | 1.23mi |
| 30 Trumbull St New Haven, CT | 5.0 | 4.0 | 2668 | $5,000 | $1.87 | 3d | 1 | 1.23mi |
| 131 Dwight St Unit 1 New Haven, CT | 6.0 | 3.0 | 3000 | $6,250 | $2.08 | 14d | 1 | 1.38mi |
| 131 Dwight St Unit 1 New Haven, CT | 6.0 | 3.0 | 3097 | $6,250 | $2.02 | 23d | 1 | 1.38mi |
| 395 Crown St New Haven, CT | 6.0 | 3.5 | 2889 | $7,195 | $2.49 | 43d | 1 | 1.40mi |
Listing history 8 events
-
2026-06-16statusdays on market $550,000 Under Contract 6 DOM
-
2026-06-15days on market $550,000 Active 5 DOM
-
2026-06-14days on market $550,000 Active 3 DOM
-
2026-06-13statusdays on market $550,000 Active 2 DOM
-
2026-06-10days on market $550,000 Coming Soon 3 DOM
-
2026-06-09days on market $550,000 Coming Soon 2 DOM
-
2026-06-08remarks 458-char remark
-
2026-06-08$550,000 Coming Soon 1 DOM
ⓘ Source: listings_history table (triggers on properties + properties_extension) + one-shot
backfill from property_details.listing_events for pre-trigger history.
Tax reassessment forecast CT · Partial reset (capped growth)
- Current annual tax
- $6,984 · $582/mo
- Projected year-2 tax
- $9,377 · $781/mo
- Expected delta
- +$2,393/yr (+$199/mo · 34.3%)
ⓘ Screening estimate from a state-policy table — verify with the county assessor before closing.
Climate risk First Street
- Flood 1/10 Low FEMA zone X (unshaded) · 0% chance over 30 yrs
- Wildfire 1/10 Low
- Heat 6/10 Major 7 d/yr ≥99°F today · 16 d/yr by 30 yrs out
- Wind 6/10 Major 51% chance of damaging wind over 30 yrs
- Air quality 5/10 Major 6 unhealthy d/yr today · 8 by 30 yrs out
Nearby sold comps map
Loading sold comps map…
Walkable amenities ~0.75 mi
Loading nearby amenities…
Taxation est. · year 1
- Rental income
- $71,844
- − Mortgage interest
- −$30,809
- − Property taxes
- −$6,984
- − Insurance
- −$2,750
- − Repairs & maintenance
- −$5,748
- − Management
- −$5,748
- − Depreciation
- −$16,000
- Taxable income
- $3,806
- Est. tax owed @ 24.0%
- −$914
- After-tax cash flow
- $11,498/yr
For passive investors: Depreciation is non-cash, so a rental often shows a tax loss while cash-flowing — sheltering income. Rental losses are passive: they offset passive income freely, and up to $25,000/yr can offset ordinary (W-2) income if you actively participate and your MAGI is under $100k (phasing out to $0 by $150k); unused losses carry forward. On sale, claimed depreciation is recaptured at up to 25%, and gains may owe capital-gains tax (a 1031 exchange can defer both). Figures are a year-1 estimate at your 24.0% rate — not tax advice; consult a CPA.
Schools (NCES district)
- District
- New Haven School District
- NCES district ID
- 0902790
- Math proficiency
- 12% ▼ -10.00%
- Reading proficiency
- 25% ▼ -10.00%
- Median HH income
- $38,058
- Composite
- 15.48/100
- National rank
- #9308
- State rank
- #147 of 153 in CT
Livability — New Haven
- Score
- 79/100
- State rank
- #31
- US rank
- #2190
Category grades
Schools grade is shown separately in the Schools card above.
Census & demographics
- Census place
- New Haven, CT
- County
- New Haven County · 688,236 people
- City population
- 132,813
- Metro
- New Haven-Milford, CT
- Population (ZIP)
- 54,730
- Household income
- $59,969
- Rent vs Own
- Severe rent burden
- 4999.0
Population outlook (South Central Connecticut County) Hauer SSP2
- By 2040
- 608,362
Race, ethnicity, and origin ACS 2023
- Neighborhood character
- Highly diverse neighborhood (Simpson 0.73)
- Race & ethnicity
- Black 34% White 32% Hispanic / Latino 21% Two or more races 8% Asian 7%
- Hispanic origin (detail)
- Mexican 4% Puerto Rican 10% Dominican 2%
- Common ancestry
- Romanian 2% Lithuanian 1% Russian 1%
- Foreign-born
- 17% · Canada, China, South Korea
- Languages at home
- 74% English-only · Spanish 15% Chinese 3% Other Indo-European 2%
Political lean MEDSL · South Central Connecticut
- 2024 margin
- Strong D (+20.1) · D 59.0% · R 38.9% · Other 2.1%
- All cycles
- 2024: D+20.1
Not yet ingested
- Civics
- —
Market trends
- HPI YoY
- ▼ -86.05%
- Current HPI
- 328.1353
- Rent YoY
- ▲ 2.60%
- Metro
- New Haven-Milford, CT
- State GDP YoY
- ▲ 1.06%
- F500 in state
- 38
Industry mix (Fortune 500 HQ in CT)
| Industry | F500 HQs | Revenue |
|---|---|---|
| Industrial Machinery | 4 | $38B |
|
||
| Insurance | 3 | $71B |
|
||
| Financial Services | 2 | $25B |
|
||
| Transportation / Logistics | 2 | $18B |
|
||
| Healthcare | 1 | $247B |
|
||
| Telecommunications | 1 | $55B |
|
||
Price history
+120.9% since first listed6 events — show timeline
- 2026-06-08 Coming Soon $550,000 Smart MLS
- 2019-11-20 Sold (Public Records) $221,000 Public Records
- 2019-11-18 Sold (MLS) $221,000 Smart MLS
- 2019-10-25 Pending — Smart MLS
- 2019-08-29 Contingent — Smart MLS
- 2019-07-25 Listed $249,000 Smart MLS
Property tax history
+6.6%/yrLatest (2023): $6,984 · -6.4% YoY. Source: county tax records.
Cash-flow waterfall
monthlySold comps — $/sqft
last 12 mo · ≤1 miLoading sold comps…