214 San Antonio South Loop · Weslaco, TX
Flood risk No data
- FEMA flood zone
- —
- Chance of flooding over 30 yrs
- —
- Est. flood insurance / yr
- —
Fire risk No data
- Est. fire insurance / yr
- —
Heat risk No data
- Hot days now (above threshold)
- —
- Hot days in 30 yrs
- —
Wind risk No data
- Chance of severe wind over 30 yrs
- —
Air-quality risk No data
- Unhealthy air days now
- —
- Unhealthy air days in 30 yrs
- —
Risk factors via First Street. Map © Google.
Why this score? — see what drove the D+ grade
The composite is a weighted blend of 9 inputs, each scored 0–100. Each bar is that input's sub-score; the figure is the points it added to the 100-point composite (weight × sub-score).
- Cash flow +22.5/30.0
- DSCR +7.2/10.0
- 1% rule +6.0/10.0
- Livability +3.6/5.0
- Rent growth +2.5/5.0
- Condition / age +2.5/5.0
- Schools +2.2/10.0
- ARV discount +0.8/15.0
- Appreciation +0.3/10.0
$318,990
🖨 Deal sheet 📄 Offer letter ✓ Due diligence
Listing remarks MLS
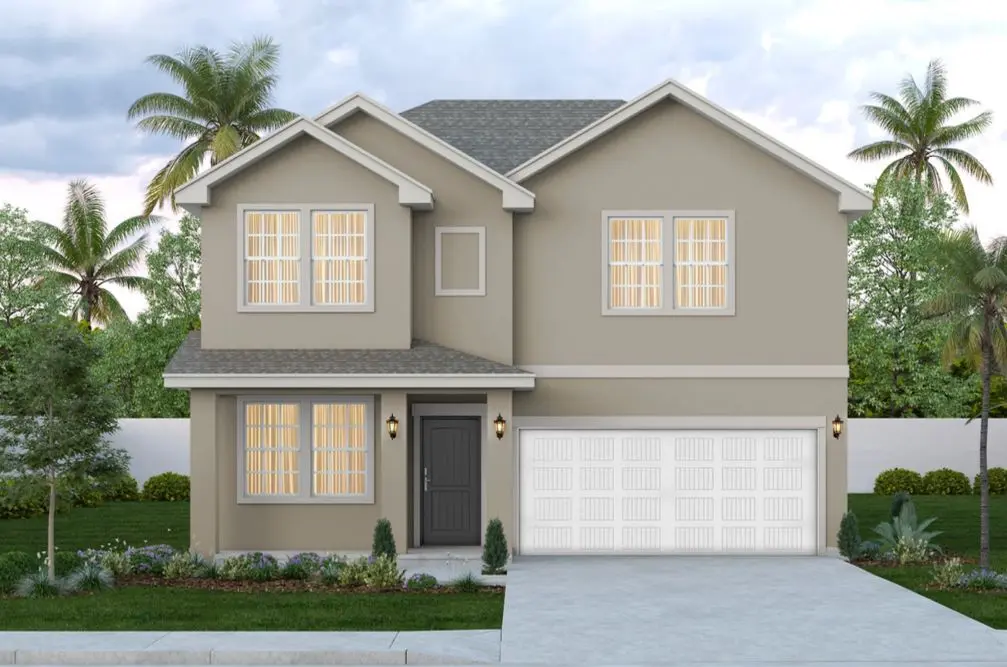
This spacious two-story Juniper home offers 3 bedrooms and 2.5 bathrooms, designed to give your family room to grow and entertain. The main level features an open-concept layout with the kitchen center island, Maple Wood painted cabinets, upgraded Quartz countertops, and a luxurious GE 5-Piece Gas Appliance Package. Elegant tile flooring flows throughout the home, adding both style and durability. Upstairs, you'll find an veristle gameroom, two generous bedrooms, and a full bathroom. Additional features of the home include a utility room, a walk-in pantry, and an attached two-car garage. In the backyard, enjoy extra space with a bonus 10x10 flatwork. 10x10 Rear Flatwork Maple Wood Cabinets Quartz Countertops GE 5-Piece Stainless-Steel Appliances - Gas * Photos do not represent the final production of the home
Key facts
- Quartz countertops
- Utility room
- Tile flooring
Tags
Neighborhood map
What this means for you Summary
Snapshot
- This is a 3-bed/2.5-bath single-family listed at $319k.
Deal economics
- At list price, monthly cash flow is $536 ($6k/yr) — positive.
- The deal already cash-flows at list — no discount required.
- Meets the 1% rule at list price ($4k rent vs $319k).
- Recommended offer: $300k (6.0% below list) — sets the bar for market timing.
- Cap rate 8.3% vs local median 4.1% in Weslaco — top-decile yield for the area; either an underpriced asset or a hidden risk that comps aren't pricing in. Stress-test before assuming the spread holds.
Location & tenants
- Location reads 72/100 on livability (#277 in TX) — a middle-class / working-renter tenant base. Strengths: cost of living A+, housing A+, health & safety A+; Watch: employment D+, crime F, amenities F.
- Weslaco ISD (suburban): math 23% / reading 31% proficiency, ranked #705 of 826 in TX (top 85%) — low school quality limits family demand, transient renter base, plan for 1-2y turnover.
- Market conditions: 231 active listings in the ZIP; 1 comparable units currently listed for rent nearby; 7,378 units permitted in Hidalgo County in 2024 (641 in 5+ unit buildings).
Forward outlook
- Local home prices are declining (-3.0%/yr); year-one equity from $2k of loan paydown is wiped out by about $10k of value loss. Plan a longer hold.
- Hidalgo County population projected at +28% by 2050 — long-run rental-demand tailwind backs the buy-and-hold thesis.
Negotiation context
- It's been on market 72 days — a 6% lower offer ($300k) is reasonable based on typical stale-listing flexibility.
Questions for the listing agent
- It's been on market 72 days. Have you received any prior offers? Is the seller open to a 6% concession, seller financing, or rate buy-down credit?
- What does the HOA fee cover, when was the last increase, and are there any pending special assessments or reserve-fund shortfalls?
- Why hasn't it sold? Are there any deal-killer items the seller is aware of (foundation, flood, title, zoning, code violations)?
- Is there a deadline driving the sale (1031 exchange, divorce, estate, relocation)? That informs how much negotiation room exists.
- Crime grade is F in this area — have there been break-ins, vandalism, or insurance claims at this property in the last 3 years? What carrier currently insures it and at what premium?
- The area grade is low — what's the realistic commute time and amenity access for the typical tenant pool here? Any planned neighborhood developments (good or bad) we should know about?
- What's the average days-on-market for RENTAL listings here right now (not sales)? A rising rental-DOM trend means longer vacancies and softer asking-rent achievability than the comps imply.
- What's the recent tenant-quality profile in this submarket — average credit score on applications, eviction rate, late-payment / NSF rate, and stable-employment percentage? A property-management company in the area should have these aggregated.
- How much new for-sale + rental construction is in the pipeline within 1–3 miles? Heavy new supply typically softens prices + rents 12–24 months out; constrained supply supports both.
Investment metrics
- 1% rule
- 1.10% ✓
- Cap rate
- 8.31%
- Cash-on-cash
- 7.20%
- DSCR
- 1.32
- GRM
- 7.6
CMA / ARV
- ARV (median comp)
- $277,426
- List price
- $318,990
- Delta
- 14.98%
- Verdict
- OVERPRICED
- Comps
- 20 within 1.0 mi
Show comp detail 10 sales within ~0.75 mi
| Address | Dist | Beds/Ba | Sqft | Sold | Price | $/sf | Match |
|---|---|---|---|---|---|---|---|
| 200 Houston Dr | 0.08mi | 3/2.5 | 2,054 (-12%) | 16mo | $278,990 | $136 | 64 |
| 5413 Jay Ln | 0.46mi | 4/3.5 (+1) | 2,355 (+1%) | 8mo | $465,000 | $197 | 61 |
| 5377 Aaron Ln | 0.46mi | 4/3.5 (+1) | 2,257 (-3%) | 9mo | $425,000 | $188 | 57 |
| 717 N Park Place Dr | 0.66mi | 4/3.5 (+1) | 2,414 (+4%) | 2mo | $389,900 | $162 | 52 |
| 2719 N Ohio Ave | 0.59mi | 3/3.5 | 2,552 (+10%) | 1mo | $249,999 | $98 | 52 |
| 609 N Park Place Dr | 0.59mi | 4/2.5 (+1) | 2,250 (-3%) | 20mo | $375,000 | $167 | 45 |
| 2503 E Sugar Cane Dr | 0.52mi | 4/3.0 (+1) | 2,128 (-9%) | 12mo | $219,000 | $103 | 44 |
| 2405 Highland Dr | 0.64mi | 4/3.0 (+1) | 2,517 (+8%) | 13mo | $329,000 | $131 | 38 |
| 855 Azure Ave | 0.49mi | 4/2.5 (+1) | 2,064 (-11%) | 23mo | $265,000 | $128 | 34 |
| 5483 Jay Ln | 0.46mi | 4/2.5 (+1) | 1,984 (-15%) | 20mo | $385,900 | $195 | 32 |
Match score weights: distance 35% · size 25% · config 20% · recency 20%. Top-matched comps best support the ARV.
Projected returns pro-forma
-3.0% appreciation · 3.0% rent growth · sell at horizon
- IRR
- -5.3%
- Equity multiple
- 0.80×
- Total profit
- $-17,514
- Equity at exit
- $47,562
- IRR
- 4.4%
- Equity multiple
- 1.32×
- Total profit
- $28,946
- Equity at exit
- $27,580
Cash invested: $89,317 (down + closing). Projections, not guarantees.
Landlord ↔ Tenant lean methodology
- Overall (STATE)
- 87 Strongly Landlord-Friendly
- State Texas
- 87 Strongly Landlord-Friendly · R+5
- County
- — inherits STATE
- City
- — inherits STATE
ZIP-level market 78599
- Home prices YoY
- -3.7%
- Active inventory
- 231
- Price-to-rent
- 7.6×
Monthly cashflow live
- Estimated rent
- $3,500 medium interval (Pro) →
- Mortgage (P&I)
- −$1,673
- Tax est. 1.5%
- −$399 /mo · $4,785/yr
- Insurance
- −$133
- HOA
- −$25
- Vacancy / Maint / Mgmt
- −$735
- Net cashflow
- $536
Break-even live
UW: 25.0% down · 7.5% · 30yr · 1.5% tax · 5.0% vac · 8.0% maint · 8.0% mgmt
Financing live
Cash to close
- Down payment
- $79,748
- Closing costs
- $9,570
- Reserves months
- —
- Total cash needed
- —
Loan-product check · same deal, 3 products live
Conventional
25% down · 7.5% · 30yr
- Down + closing
- —
- Monthly P&I
- —
- Monthly cashflow
- —
- DSCR
- —
- Eligible?
- —
Personal DTI + credit; lowest rate.
DSCR
20% down · 8.5% · 30yr
- Down + closing
- —
- Monthly P&I
- —
- Monthly cashflow
- —
- DSCR
- —
- Eligible?
- —
No personal income docs; deal must DSCR.
Hard money
10% down · 12.0% · 12mo
- Down + closing
- —
- Monthly P&I
- —
- Monthly cashflow
- —
- DSCR
- —
- Eligible?
- —
Short-term bridge; refi at stabilization.
Rent comps 1 comps
| Address | Beds | Baths | Sqft | Rent | $/sqft | DOM | Units | Dist |
|---|---|---|---|---|---|---|---|---|
| 3208 N Westgate Dr Weslaco, TX | 4.0 | 3.0 | 3347 | $3,500 | $1.05 | 14d | 1 | 1.13mi |
HOA detail
- Monthly dues
- $25 · $300/yr
- Likely covers
- gas
Listing history 4 events
-
2026-06-02days on market $318,990 Active 72 DOM
-
2026-06-01days on market $318,990 Active 71 DOM
-
2026-05-31days on market $318,990 Active 70 DOM
-
2026-03-22$318,990 Active 821-char remark
Show marketing remark (821 chars)
This spacious two-story Juniper home offers 3 bedrooms and 2.5 bathrooms, designed to give your family room to grow and entertain. The main level features an open-concept layout with the kitchen center island, Maple Wood painted cabinets, upgraded Quartz countertops, and a luxurious GE 5-Piece Gas Appliance Package. Elegant tile flooring flows throughout the home, adding both style and durability. Upstairs, you'll find an veristle gameroom, two generous bedrooms, and a full bathroom. Additional features of the home include a utility room, a walk-in pantry, and an attached two-car garage. In the backyard, enjoy extra space with a bonus 10x10 flatwork. 10x10 Rear Flatwork Maple Wood Cabinets Quartz Countertops GE 5-Piece Stainless-Steel Appliances - Gas * Photos do not represent the final production of the home
ⓘ Source: listings_history table (triggers on properties + properties_extension) + one-shot
backfill from property_details.listing_events for pre-trigger history.
Nearby sold comps map
Loading sold comps map…
Walkable amenities ~0.75 mi
Loading nearby amenities…
Taxation est. · year 1
- Rental income
- $42,000
- − Mortgage interest
- −$17,868
- − Property taxes
- −$4,785
- − Insurance
- −$1,595
- − Repairs & maintenance
- −$3,360
- − Management
- −$3,360
- − HOA
- −$300
- − Depreciation
- −$9,280
- Taxable income
- $1,452
- Est. tax owed @ 24.0%
- −$349
- After-tax cash flow
- $6,078/yr
For passive investors: Depreciation is non-cash, so a rental often shows a tax loss while cash-flowing — sheltering income. Rental losses are passive: they offset passive income freely, and up to $25,000/yr can offset ordinary (W-2) income if you actively participate and your MAGI is under $100k (phasing out to $0 by $150k); unused losses carry forward. On sale, claimed depreciation is recaptured at up to 25%, and gains may owe capital-gains tax (a 1031 exchange can defer both). Figures are a year-1 estimate at your 24.0% rate — not tax advice; consult a CPA.
Schools (NCES district)
- District
- Weslaco ISD
- NCES district ID
- 4844960
- Math proficiency
- 23% ▼ -29.00%
- Reading proficiency
- 31% ▼ -9.00%
- Median HH income
- $32,867
- Composite
- 22.05/100
- National rank
- #8196
- State rank
- #705 of 826 in TX
Livability — Weslaco
- Score
- 72/100
- State rank
- #277
- US rank
- #6469
Category grades
Schools grade is shown separately in the Schools card above.
Census & demographics
- Census place
- Weslaco, TX
- Population (ZIP)
- 35,400
Population outlook (Hidalgo County) Hauer SSP2
- Today (2025)
- 955,232 people
- By 2030
- 1,009,774 · +5.7%
- By 2040
- 1,120,332 · +17.3%
- By 2050
- 1,225,036 · +28.2%
- By 2075
- 1,439,189 · +50.7%
- By 2100
- 1,533,429 · +60.5%
Race, ethnicity, and origin ACS 2023
- Neighborhood character
- Predominantly Hispanic (96%)
- Race & ethnicity
- Hispanic / Latino 96% Two or more races 42% White 2%
- Hispanic origin (detail)
- Mexican 90%
- Foreign-born
- 20% · Canada
- Languages at home
- 19% English-only · Spanish 80%
Political lean MEDSL · Hidalgo
- 2024 margin
- Toss-up / Even · D 48.1% · R 51.0%
- 2008→2024 swing
- -41.6pp toward R · 2008: 38.7pp · 2024: -2.9pp
- All cycles
- 2024: R+2.9 2020: D+17.1 2016: D+40.5 2012: D+41.8 2008: D+38.7
Not yet ingested
- Civics
- —
Market trends
- HPI YoY
- ▼ -9.47%
- Current HPI
- 243.5537
- Rent YoY
- —
- Metro
- —
- State GDP YoY
- ▲ 3.95%
- F500 in state
- 110
Industry mix (Fortune 500 HQ in TX)
| Industry | F500 HQs | Revenue |
|---|---|---|
| Energy | 16 | $1,198B |
|
||
| Technology | 5 | $198B |
|
||
| Engineering / Construction | 4 | $72B |
|
||
| Energy Services | 3 | $60B |
|
||
| Utilities | 3 | $41B |
|
||
| Healthcare | 2 | $330B |
|
||
Price history
1 event — show timeline
- 2026-03-22 Listed $318,990 Zillow
Cash-flow waterfall
monthlySold comps — $/sqft
last 12 mo · ≤1 miLoading sold comps…