 Fourplex
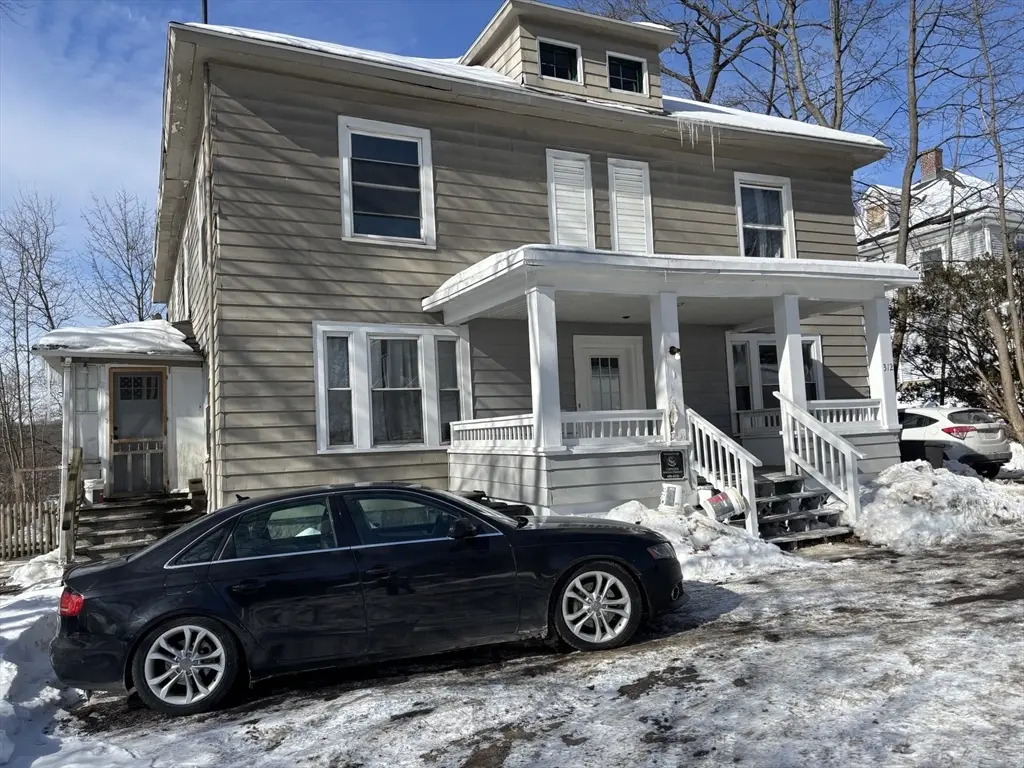
312 South St · Pittsfield, MA
Flood risk 1/10 · Minimal
- FEMA flood zone
- X
- Chance of flooding over 30 yrs
- 0.0%
- Est. flood insurance / yr
- $473 – $860
Fire risk 3/10 · Minor
- Est. fire insurance / yr
- $915 – $1,699
Heat risk 2/10 · Minimal
- Hot days now (above 90°F)
- 7 days/yr
- Hot days in 30 yrs
- 16 days/yr
Wind risk 4/10 · Minor
- Chance of severe wind over 30 yrs
- 10.0%
Air-quality risk 2/10 · Minimal
- Unhealthy air days now
- 1 days/yr
- Unhealthy air days in 30 yrs
- 1 days/yr
Risk factors via First Street. Map © Google.
Why this score? — see what drove the C+ grade
The composite is a weighted blend of 9 inputs, each scored 0–100. Each bar is that input's sub-score; the figure is the points it added to the 100-point composite (weight × sub-score).
- Cash flow +30.0/30.0
- DSCR +10.0/10.0
- 1% rule +8.9/10.0
- Rent growth +4.4/5.0
- Livability +3.8/5.0
- Condition / age +2.5/5.0
- Schools +2.3/10.0
- ARV discount +0.0/15.0
- Appreciation +0.0/10.0
$419,000
🖨 Deal sheet (PDF) 📄 Offer letter ✓ Due diligence
Multi-family units
County records classify this as Multi-Family (5+ Unit). Listing-text estimate: 4 units. estimate disagrees with records
5+ unit building — per-unit beds/baths from public records are typically unavailable; the breakdown below (if shown) is an estimate from the listing text.
Listing remarks MLS
Four-family investment opportunity that checks all the boxes! Great location. Fully rented. Turnkey. Robust net operating income. This well-maintained home, comprising three 2-bedroom units and one 1-bedroom unit all with separate utilities, is an instant profit generator and offers real value in today's market.
Key facts
- Separate utilities
- Fully rented
- Well maintained
Tags
Neighborhood map
What this means for you Summary
Snapshot
- This is a 3×2bd/1ba + 1×1bd/1ba units multifamily listed at $419k.
Deal economics
- At list price, monthly cash flow is $2k ($23k/yr) — positive. Per door: $479/mo.
- The deal already cash-flows at list — no discount required.
- Meets the 1% rule at list price ($6k rent vs $419k).
- Recommended offer: $369k (12.0% below list) — sets the bar for market timing.
- Cap rate 11.8% vs local median 3.7% in Pittsfield — top-decile yield for the area; either an underpriced asset or a hidden risk that comps aren't pricing in. Stress-test before assuming the spread holds.
Location & tenants
- Location reads 75/100 on livability (#70 in MA, #3,820 nationally) — a middle-class / working-renter tenant base. Strengths: commute A+, housing A+, health & safety A+; Watch: employment C-, amenities D+, crime D.
- Pittsfield (urban): math 19% / reading 34% proficiency, ranked #272 of 302 in MA (top 90%) — low school quality limits family demand, transient renter base, plan for 1-2y turnover.
- Zoned schools: Crosby (math 2% / reading 17%, grade F, #914 of 938 statewide, top 98%, 270 students, 0% FRL); John T Reid Middle (math 7% / reading 17%, grade F, #283 of 305 statewide, top 93%, 450 students, 0% FRL); Taconic High (math 27% / reading 37%, grade F, #255 of 343 statewide, top 77%, 860 students, 0% FRL) — zoned schools average 0% FRL vs 50% district-wide (50 pts lower); this property's tenant base skews higher-income than the district average.
- Market conditions: Rents rising fast (+7.7%/yr); 278 active listings in the ZIP; 130 units permitted in Berkshire County in 2024 (10 in 5+ unit buildings).
- At $5,804/mo this rent would consume 98% of the median local household income ($71k/yr) (locally 1580% of renters already pay >50% of income on rent) — very limited rent-growth headroom before tenants either downsize or default.
Forward outlook
- Local home prices are declining (-3.0%/yr); year-one equity from $3k of loan paydown is wiped out by about $13k of value loss. Plan a longer hold.
- Berkshire County population projected at -24% by 2050 — secular population decline; favor cash flow + early exit over multi-decade hold.
- At projected returns (-3.0% appreciation + 7.7% rent growth), your $117k cash investment doubles in ~6 years — after that, you're playing with house money.
Negotiation context
- It's been on market 131 days — a 12% lower offer ($369k) is reasonable based on typical stale-listing flexibility.
- 3 sale attempts since 22y ago with the ask held roughly flat each time — persistent listings suggest the price (not the market) is what's stuck; bring a comps-based counter.
- Current owner paid $200k; list at $419k implies a 110% gain — meaningful room to come down on a strong offer.
Risks & watch-outs
- Watch-outs: built in 1900 — expect roof / HVAC / electrical / plumbing capex.
Questions for the listing agent
- It's been on market 131 days. Have you received any prior offers? Is the seller open to a 12% concession, seller financing, or rate buy-down credit?
- Can we see the unit-by-unit rent roll, current vacancy, and any below-market leases? What's the average tenancy length?
- What capital expenditures (roof, boiler, parking lot, exteriors) have been made in the last 5 years, and what's planned in the next 2?
- Built in 1900 — when were the roof, HVAC, electrical panel, plumbing, and water heater last replaced?
- Why hasn't it sold? Are there any deal-killer items the seller is aware of (foundation, flood, title, zoning, code violations)?
- Is there a deadline driving the sale (1031 exchange, divorce, estate, relocation)? That informs how much negotiation room exists.
- Schools are D-rated, which usually means shorter tenancies and higher turnover. Who's the typical renter profile here, and what's been the actual vacancy rate?
- Crime grade is D in this area — have there been break-ins, vandalism, or insurance claims at this property in the last 3 years? What carrier currently insures it and at what premium?
- What's the average days-on-market for RENTAL listings here right now (not sales)? A rising rental-DOM trend means longer vacancies and softer asking-rent achievability than the comps imply.
- What's the recent tenant-quality profile in this submarket — average credit score on applications, eviction rate, late-payment / NSF rate, and stable-employment percentage? A property-management company in the area should have these aggregated.
- How much new apartment / multifamily construction is in the pipeline within 1–3 miles? Heavy new supply (>2% of stock underway) typically softens rents 12–24 months out; light construction supports rent growth.
Investment metrics
- 1% rule
- 1.39% ✓
- Cap rate
- 11.78%
- Cash-on-cash
- 19.58%
- DSCR
- 1.87
- GRM
- 6.0
CMA / ARV
- ARV (median comp)
- $327,874
- List price
- $419,000
- Delta
- 27.79%
- Verdict
- OVERPRICED
- Comps
- 20 within 1.0 mi
Show comp detail 5 sales within ~0.75 mi
| Address | Dist | Beds/Ba | Sqft | Sold | Price | $/sf | Match |
|---|---|---|---|---|---|---|---|
| 124-126 Appleton Ave | 0.50mi | 8/4.0 | 4,706 (+0%) | 17mo | $364,000 | $77 | 59 |
| 112 Elizabeth St | 0.12mi | 9/3.0 (+1) | 4,222 (-10%) | 24mo | $325,000 | $77 | 47 |
| 119 Appleton Ave | 0.54mi | 8/2.5 | 4,263 (-9%) | 9mo | $350,000 | $82 | 45 |
| 18-20 Elizabeth St | 0.11mi | 7/5.0 (-1) | 3,979 (-15%) | 23mo | $191,000 | $48 | 44 |
| 18-20 Elizabeth St | 0.34mi | 7/6.0 (-1) | 3,979 (-15%) | 23mo | $191,000 | $48 | 29 |
Match score weights: distance 35% · size 25% · config 20% · recency 20%. Top-matched comps best support the ARV.
Projected returns pro-forma
-3.0% appreciation · 7.72% rent growth · sell at horizon
- IRR
- 16.6%
- Equity multiple
- 1.71×
- Total profit
- $82,867
- Equity at exit
- $62,474
- IRR
- 28.3%
- Equity multiple
- 4.07×
- Total profit
- $359,617
- Equity at exit
- $36,227
Cash invested: $117,320 (down + closing). Projections, not guarantees.
Landlord ↔ Tenant lean methodology
- Overall (STATE)
- 20 Strongly Tenant-Friendly
- State Massachusetts
- 20 Strongly Tenant-Friendly · D+15
- County
- — inherits STATE
- City
- — inherits STATE
ZIP-level market 01201
- Rents YoY
- 7.7%
- Active inventory
- 278
- Price-to-rent
- 23.4×
Monthly cashflow live
- Estimated rent
- $5,804 high interval (Pro) →
- Mortgage (P&I)
- −$2,197
- Tax from tax record
- −$299 /mo · $3,585/yr
- Insurance
- −$175
- HOA
- −$0
- Vacancy / Maint / Mgmt
- −$1,219
- Net cashflow
- $1,915
Break-even live
Sensitivity live
| Price | -10% $2,152 | -5% $2,033 | +0% $1,915 | +5% $1,796 | +10% $1,677 |
|---|---|---|---|---|---|
| Rent | -10% $1,456 | -5% $1,685 | +0% $1,915 | +5% $2,144 | +10% $2,373 |
| Rate | -1.0pp $2,126 | -0.5pp $2,021 | base $1,915 | +0.5pp $1,806 | +1.0pp $1,696 |
4-unit breakdown (identical units grouped — click to expand)
| Units | Beds | Baths | Est. rent |
|---|---|---|---|
| 3× units | 2 | 1 | $4,467 |
| #1 | 2 | 1 | $1,489 |
| #2 | 2 | 1 | $1,489 |
| #3 | 2 | 1 | $1,489 |
| 1× unit | 1 | 1 | $1,337 |
| Total (4 units) | $5,804 | ||
UW: 25.0% down · 7.5% · 30yr · 1.5% tax · 5.0% vac · 8.0% maint · 8.0% mgmt
Financing live
Cash to close
- Down payment
- $104,750
- Closing costs
- $12,570
- Reserves months
- —
- Total cash needed
- —
Loan-product check · same deal, 3 products live
Conventional
25% down · 7.5% · 30yr
- Down + closing
- —
- Monthly P&I
- —
- Monthly cashflow
- —
- DSCR
- —
- Eligible?
- —
Personal DTI + credit; lowest rate.
DSCR
20% down · 8.5% · 30yr
- Down + closing
- —
- Monthly P&I
- —
- Monthly cashflow
- —
- DSCR
- —
- Eligible?
- —
No personal income docs; deal must DSCR.
Hard money
10% down · 12.0% · 12mo
- Down + closing
- —
- Monthly P&I
- —
- Monthly cashflow
- —
- DSCR
- —
- Eligible?
- —
Short-term bridge; refi at stabilization.
Listing history 27 events
-
2026-06-21days on market $419,000 Active 131 DOM
-
2026-06-19days on market $419,000 Active 129 DOM
-
2026-06-18days on market $419,000 Active 128 DOM
-
2026-06-17days on market $419,000 Active 127 DOM
-
2026-06-16days on market $419,000 Active 126 DOM
-
2026-06-15days on market $419,000 Active 125 DOM
-
2026-06-14days on market $419,000 Active 123 DOM
-
2026-06-12days on market $419,000 Active 122 DOM
-
2026-06-09days on market $419,000 Active 119 DOM
-
2026-06-08days on market $419,000 Active 118 DOM
-
2026-06-07days on market $419,000 Active 117 DOM
-
2026-06-05days on market $419,000 Active 114 DOM
-
2026-06-02days on market $419,000 Active 112 DOM
-
2026-06-01days on market $419,000 Active 111 DOM
-
2026-05-31days on market $419,000 Active 110 DOM
-
2026-05-30days on market $419,000 Active 109 DOM
-
2026-02-11$419,000 Active 313-char remark
Show marketing remark (313 chars)
Four-family investment opportunity that checks all the boxes! Great location. Fully rented. Turnkey. Robust net operating income. This well-maintained home, comprising three 2-bedroom units and one 1-bedroom unit all with separate utilities, is an instant profit generator and offers real value in today's market.
-
2026-02-10$419,000 New 313-char remark
Show marketing remark (313 chars)
Four-family investment opportunity that checks all the boxes! Great location. Fully rented. Turnkey. Robust net operating income. This well-maintained home, comprising three 2-bedroom units and one 1-bedroom unit all with separate utilities, is an instant profit generator and offers real value in today's market.
-
2004-10-27soldstatus $200,000
-
2004-10-18$200,000
-
2004-09-23soldstatus $200,000
-
1999-07-23soldstatus $65,000
-
1999-07-23soldstatus $65,000
-
1999-07-23soldstatus $65,000
-
1999-07-23soldstatus $65,000
-
1998-08-31soldstatus $126,950
-
1992-09-21soldstatus $119,500
ⓘ Source: listings_history table (triggers on properties + properties_extension) + one-shot
backfill from property_details.listing_events for pre-trigger history.
Tax reassessment forecast MA · Partial reset (capped growth)
- Current annual tax
- $3,585 · $299/mo
- Projected year-2 tax
- $4,369 · $364/mo
- Expected delta
- +$784/yr (+$65/mo · 21.9%)
ⓘ Screening estimate from a state-policy table — verify with the county assessor before closing.
Climate risk First Street
- Flood 1/10 Low FEMA zone X · 0% chance over 30 yrs
- Wildfire 3/10 Moderate
- Heat 2/10 Low 7 d/yr ≥90°F today · 16 d/yr by 30 yrs out
- Wind 4/10 Moderate 10% chance of damaging wind over 30 yrs
- Air quality 2/10 Low 1 unhealthy d/yr today · 1 by 30 yrs out
Nearby sold comps map
Loading sold comps map…
Walkable amenities ~0.75 mi
Loading nearby amenities…
Taxation est. · year 1
- Rental income
- $69,648
- − Mortgage interest
- −$23,471
- − Property taxes
- −$3,585
- − Insurance
- −$2,095
- − Repairs & maintenance
- −$5,572
- − Management
- −$5,572
- − Depreciation
- −$12,189
- Taxable income
- $17,165
- Est. tax owed @ 24.0%
- −$4,120
- After-tax cash flow
- $18,855/yr
For passive investors: Depreciation is non-cash, so a rental often shows a tax loss while cash-flowing — sheltering income. Rental losses are passive: they offset passive income freely, and up to $25,000/yr can offset ordinary (W-2) income if you actively participate and your MAGI is under $100k (phasing out to $0 by $150k); unused losses carry forward. On sale, claimed depreciation is recaptured at up to 25%, and gains may owe capital-gains tax (a 1031 exchange can defer both). Figures are a year-1 estimate at your 24.0% rate — not tax advice; consult a CPA.
Schools (NCES district)
- District
- Pittsfield
- NCES district ID
- 2509630
- Math proficiency
- 19% ▼ -10.00%
- Reading proficiency
- 34% ▼ -2.00%
- Median HH income
- $44,032
- Composite
- 22.67/100
- National rank
- #8046
- State rank
- #272 of 302 in MA
Livability — Pittsfield
- Score
- 75/100
- State rank
- #70
- US rank
- #3820
Category grades
Schools grade is shown separately in the Schools card above.
Census & demographics
- Census place
- Pittsfield, MA
- County
- Berkshire County · 44,848 people
- City population
- 44,848
- Metro
- Pittsfield, MA
- Population (ZIP)
- 44,848
- Household income
- $71,093
- Rent vs Own
- Severe rent burden
- 1580.0
Population outlook (Berkshire County) Hauer SSP2
- Today (2025)
- 119,723 people
- By 2030
- 114,608 · -4.3%
- By 2040
- 102,806 · -14.1%
- By 2050
- 91,305 · -23.7%
- By 2075
- 71,517 · -40.3%
- By 2100
- 57,988 · -51.6%
Race, ethnicity, and origin ACS 2023
- Neighborhood character
- Predominantly White (78%)
- Race & ethnicity
- White 78% Two or more races 10% Hispanic / Latino 9% Black 5% Asian 1%
- Hispanic origin (detail)
- Puerto Rican 3%
- Common ancestry
- Lithuanian 8% Romanian 6% Slovak 2%
- Foreign-born
- 7% · Canada, Jamaica
- Languages at home
- 90% English-only · Spanish 6% Other Indo-European 1% Russian/Polish/Slavic 1%
Political lean MEDSL · Berkshire
- 2024 margin
- Solid D (+39.9) · D 68.9% · R 29.0% · Other 2.1%
- 2008→2024 swing
- -12.5pp toward R · 2008: 52.4pp · 2024: 39.9pp
- All cycles
- 2024: D+39.9 2020: D+47.1 2016: D+41.5 2012: D+53.7 2008: D+52.4
Not yet ingested
- Civics
- —
Market trends
- HPI YoY
- ▼ -199.88%
- Current HPI
- 283.3421
- Rent YoY
- ▲ 7.72%
- Metro
- Pittsfield, MA
- State GDP YoY
- ▲ 2.28%
- F500 in state
- 38
Industry mix (Fortune 500 HQ in MA)
| Industry | F500 HQs | Revenue |
|---|---|---|
| Technology | 3 | $17B |
|
||
| Insurance | 2 | $84B |
|
||
| Retail | 2 | $76B |
|
||
| Life Sciences | 1 | $43B |
|
||
| Energy Technology | 1 | $31B |
|
||
| Aerospace / Defense | 1 | $18B |
|
||
Price history
+250.6% since first listed11 events — show timeline
- 2026-02-11 Listed $419,000 BCMLS
- 2026-02-10 Listed $419,000 MLS PIN
- 2004-10-27 Sold (MLS) $200,000 BCMLS
- 2004-10-18 Listed $200,000 BCMLS
- 2004-09-23 Sold (Public Records) $200,000 Public Records
- 1999-07-23 Sold (Public Records) $65,000 Public Records
- 1999-07-23 Sold (Public Records) $65,000 Public Records
- 1999-07-23 Sold (Public Records) $65,000 Public Records
- 1999-07-23 Sold (Public Records) $65,000 Public Records
- 1998-08-31 Sold (Public Records) $126,950 Public Records
- 1992-09-21 Sold (Public Records) $119,500 Public Records
Property tax history
-1.0%/yrLatest (2023): $3,585 · +3.7% YoY. Source: county tax records.
Cash-flow waterfall
monthlySold comps — $/sqft
last 12 mo · ≤1 miLoading sold comps…