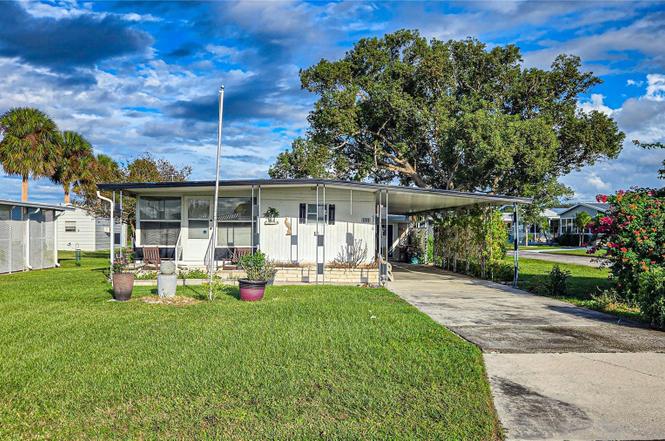
5316 Comanche St · Zephyrhills West, FL
Flood risk 4/10 · Minor
- FEMA flood zone
- X (unshaded)
- Chance of flooding over 30 yrs
- 0.22%
- Est. flood insurance / yr
- $507 – $1,088
Fire risk 4/10 · Minor
- Est. fire insurance / yr
- $947 – $1,759
Heat risk 9/10 · Severe
- Hot days now (above 108°F)
- 6 days/yr
- Hot days in 30 yrs
- 21 days/yr
Wind risk 9/10 · Severe
- Chance of severe wind over 30 yrs
- 99.0%
Air-quality risk 2/10 · Minimal
- Unhealthy air days now
- 1 days/yr
- Unhealthy air days in 30 yrs
- 2 days/yr
Risk factors via First Street. Map © Google.
Why this score? — see what drove the B+ grade
The composite is a weighted blend of 9 inputs, each scored 0–100. Each bar is that input's sub-score; the figure is the points it added to the 100-point composite (weight × sub-score).
- Cash flow +30.0/30.0
- ARV discount +15.0/15.0
- 1% rule +10.0/10.0
- DSCR +10.0/10.0
- Schools +4.3/10.0
- Livability +3.1/5.0
- Condition / age +2.5/5.0
- Rent growth +1.6/5.0
- Appreciation +0.0/10.0
$85,000
🖨 Deal sheet 📄 Offer letter ✓ Due diligence
Listing remarks
Charming Corner-Lot Home in Betmar 55+ Community – You OWN the Land! Come see this lovely home situated on a desirable corner lot in Betmar Acres, a vibrant 55+ community where you own your land! Enjoy the low annual community fee of just $435 and take advantage of the many amenities in Betmar. This partially furnished single-wide home feels spacious thanks to thoughtful additions — a large living room and primary bedroom with a full bath have been added to the side, giving it the feel of a double-wide. The kitchen, located at the back of the home, features ample counter space and a convenient breakfast bar. Inside, you’ll find updated flooring and brand-new carpet thro
Key facts
- Ample counter space
- Large living room
- Full bath
Tags
Neighborhood map
What this means for you Summary
Snapshot
- This is a 2-bed/2.0-bath manufactured listed at $85k.
Deal economics
- At list price, monthly cash flow is $413 ($5k/yr) — positive.
- The deal already cash-flows at list — no discount required.
- Meets the 1% rule at list price ($1k rent vs $85k).
- Recommended offer: $75k (12.0% below list) — sets the bar for market timing.
- Cap rate 12.1% vs local median 7.8% in Zephyrhills West — top-decile yield for the area; either an underpriced asset or a hidden risk that comps aren't pricing in. Stress-test before assuming the spread holds.
Location & tenants
- Location reads 61/100 on livability (#772 in FL) — a middle-class / working-renter tenant base. Strengths: cost of living A+, housing A+; Watch: schools D-, amenities F, commute F.
- Pasco (suburban): math 50% / reading 52% proficiency, ranked #32 of 73 in FL (top 44%) — acceptable for families but not a draw, mixed tenant base, ~2y average lease.
- Market conditions: Rents falling (-3.6%/yr); 294 active listings in the ZIP; 6 comparable units currently listed for rent nearby; rentals at typical pace (median 25d on market — plan ~3-4 weeks tenant-placement turnaround); 6,765 units permitted in Pasco County in 2024 (1,250 in 5+ unit buildings).
- This rent runs 35% of the median local income ($49k/yr) — at the standard rent-burdened threshold; future hikes will face affordability resistance.
Forward outlook
- Local home prices are declining (-3.0%/yr); year-one equity from $588 of loan paydown is wiped out by about $3k of value loss. Plan a longer hold.
- Pasco County population projected at +29% by 2050 — long-run rental-demand tailwind backs the buy-and-hold thesis.
- At projected returns (-3.0% appreciation + 0.0% rent growth), your $24k cash investment doubles in ~8 years — after that, you're playing with house money.
Negotiation context
- It's been on market 182 days — a 12% lower offer ($75k) is reasonable based on typical stale-listing flexibility.
- 2 sale attempts since 2y ago; this cycle's ask has dropped $30k (26%) from the opening price — seller is motivated, your offer sets the floor, not the list.
Risks & watch-outs
- Watch-outs: property tax is 2.9% of price.
- Climate carrying-cost: severe wind risk, 99% chance of damaging wind over 30y; extreme-heat days projected 6→21/yr by 2055 (HVAC capex compounding) — expect insurance premiums to compound above CPI over the hold.
Questions for the listing agent
- It's been on market 182 days. Have you received any prior offers? Is the seller open to a 12% concession, seller financing, or rate buy-down credit?
- Built in 1969 — when were the roof, HVAC, electrical panel, plumbing, and water heater last replaced?
- Property tax is high relative to price — has the assessment been appealed recently, and will the sale trigger a re-assessment?
- What does the HOA fee cover, when was the last increase, and are there any pending special assessments or reserve-fund shortfalls?
- Why hasn't it sold? Are there any deal-killer items the seller is aware of (foundation, flood, title, zoning, code violations)?
- Is there a deadline driving the sale (1031 exchange, divorce, estate, relocation)? That informs how much negotiation room exists.
- Schools are D-rated, which usually means shorter tenancies and higher turnover. Who's the typical renter profile here, and what's been the actual vacancy rate?
- What's the average days-on-market for RENTAL listings here right now (not sales)? A rising rental-DOM trend means longer vacancies and softer asking-rent achievability than the comps imply.
- What's the recent tenant-quality profile in this submarket — average credit score on applications, eviction rate, late-payment / NSF rate, and stable-employment percentage? A property-management company in the area should have these aggregated.
- How much new for-sale + rental construction is in the pipeline within 1–3 miles? Heavy new supply typically softens prices + rents 12–24 months out; constrained supply supports both.
Investment metrics
- 1% rule
- 1.69% ✓
- Cap rate
- 12.12%
- Cash-on-cash
- 20.81%
- DSCR
- 1.93
- GRM
- 4.9
CMA / ARV
- ARV (on-the-fly)
- $114,816
- Comps found
- 2
Show comp detail 2 sales within ~0.75 mi
| Address | Dist | Beds/Ba | Sqft | Sold | Price | $/sf | Match |
|---|---|---|---|---|---|---|---|
| 37020 Lois Ave | 0.42mi | 2/1.0 | 624 (+13%) | 2mo | $73,000 | $117 | 53 |
| 5251 Flint St | 0.57mi | 2/1.0 | 600 (+9%) | 8mo | $125,000 | $208 | 48 |
Match score weights: distance 35% · size 25% · config 20% · recency 20%. Top-matched comps best support the ARV.
Projected returns pro-forma
-3.0% appreciation · 0.0% rent growth · sell at horizon
- IRR
- 9.4%
- Equity multiple
- 1.35×
- Total profit
- $8,413
- Equity at exit
- $12,674
- IRR
- 15.5%
- Equity multiple
- 2.06×
- Total profit
- $25,340
- Equity at exit
- $7,349
Cash invested: $23,800 (down + closing). Projections, not guarantees.
Landlord ↔ Tenant lean methodology
- Overall (STATE)
- 87 Strongly Landlord-Friendly
- State Florida
- 87 Strongly Landlord-Friendly · R+3
- County
- — inherits STATE
- City
- — inherits STATE
ZIP-level market 33542
- Home prices YoY
- -20.6%
- Rents YoY
- -3.6%
- Active inventory
- 294
- Price-to-rent
- 4.9×
Monthly cashflow live
- Estimated rent
- $1,436 high interval (Pro) →
- Mortgage (P&I)
- −$446
- Tax from tax record
- −$203 /mo · $2,440/yr
- Insurance
- −$35
- HOA
- −$37
- Vacancy / Maint / Mgmt
- −$302
- Net cashflow
- $413
Break-even live
UW: 25.0% down · 7.5% · 30yr · 1.5% tax · 5.0% vac · 8.0% maint · 8.0% mgmt
Financing live
Cash to close
- Down payment
- $21,250
- Closing costs
- $2,550
- Reserves months
- —
- Total cash needed
- —
Loan-product check · same deal, 3 products live
Conventional
25% down · 7.5% · 30yr
- Down + closing
- —
- Monthly P&I
- —
- Monthly cashflow
- —
- DSCR
- —
- Eligible?
- —
Personal DTI + credit; lowest rate.
DSCR
20% down · 8.5% · 30yr
- Down + closing
- —
- Monthly P&I
- —
- Monthly cashflow
- —
- DSCR
- —
- Eligible?
- —
No personal income docs; deal must DSCR.
Hard money
10% down · 12.0% · 12mo
- Down + closing
- —
- Monthly P&I
- —
- Monthly cashflow
- —
- DSCR
- —
- Eligible?
- —
Short-term bridge; refi at stabilization.
Rent comps 6 comps
| Address | Beds | Baths | Sqft | Rent | $/sqft | DOM | Units | Dist |
|---|---|---|---|---|---|---|---|---|
| 5168 Crooked Ln Zephyrhills, FL | 2.0 | 1.0 | 600 | $1,645 | $2.74 | 22d | 1 | 0.38mi |
| 6302 Abbott Station Dr Zephyrhills, FL | 3.0 | 1.0–2.5 | 855 | $1,732 | $2.02 | 2d | 142 | 1.18mi |
| 5611 1st St Zephyrhills, FL | 1.0 | 1.0 | 600 | $1,095 | $1.82 | 17d | 1 | 1.36mi |
| 4833 Royal Palm Dr Zephyrhills, FL | 2.0 | 1.0 | 672 | $1,090 | $1.62 | 24d | 1 | 1.41mi |
| 38010 14th Ave Apt 3 Zephyrhills, FL | 1.0 | 1.0 | 537 | $1,195 | $2.23 | 24d | 1 | 1.48mi |
| 38044 6th Ave Unit 38044 Zephyrhills, FL | 1.0 | 1.0 | 494 | $950 | $1.92 | 24d | 1 | 1.48mi |
HOA detail
- Monthly dues
- $37 · $444/yr
Listing history 15 events
-
2026-04-14status Pending
-
2026-03-25price $85,000
-
2026-03-12price $89,500
-
2026-03-04price $99,500
-
2026-02-02price $106,000
-
2026-01-13price $112,500
-
2025-10-14$114,500 Active
-
2025-04-21status Pending
-
2025-04-01price $105,000
-
2025-02-05price $115,000
-
2025-01-29price $124,000
-
2024-11-21price $129,000
-
2024-11-19price $131,000
-
2024-08-09price $133,000
-
2024-05-29$135,000 Active
ⓘ Source: listings_history table (triggers on properties + properties_extension) + one-shot
backfill from property_details.listing_events for pre-trigger history.
Tax reassessment forecast FL · Resets to sale price
- Current annual tax
- $2,440 · $203/mo
- Projected year-2 tax
- $2,440 · $203/mo
- Expected delta
- $0/yr ($0/mo · 0.0%)
ⓘ Screening estimate from a state-policy table — verify with the county assessor before closing.
Climate risk First Street
- Flood 4/10 Moderate FEMA zone X (unshaded) · 22% chance over 30 yrs
- Wildfire 4/10 Moderate
- Heat 9/10 Extreme 6 d/yr ≥108°F today · 21 d/yr by 30 yrs out
- Wind 9/10 Extreme 99% chance of damaging wind over 30 yrs
- Air quality 2/10 Low 1 unhealthy d/yr today · 2 by 30 yrs out
Nearby sold comps map
Loading sold comps map…
Walkable amenities ~0.75 mi
Loading nearby amenities…
Taxation est. · year 1
- Rental income
- $17,230
- − Mortgage interest
- −$4,761
- − Property taxes
- −$2,440
- − Insurance
- −$425
- − Repairs & maintenance
- −$1,378
- − Management
- −$1,378
- − HOA
- −$444
- − Depreciation
- −$2,473
- Taxable income
- $3,930
- Est. tax owed @ 24.0%
- −$943
- After-tax cash flow
- $4,010/yr
For passive investors: Depreciation is non-cash, so a rental often shows a tax loss while cash-flowing — sheltering income. Rental losses are passive: they offset passive income freely, and up to $25,000/yr can offset ordinary (W-2) income if you actively participate and your MAGI is under $100k (phasing out to $0 by $150k); unused losses carry forward. On sale, claimed depreciation is recaptured at up to 25%, and gains may owe capital-gains tax (a 1031 exchange can defer both). Figures are a year-1 estimate at your 24.0% rate — not tax advice; consult a CPA.
Schools (NCES district)
- District
- Pasco
- NCES district ID
- 1201530
- Math proficiency
- 50% ▼ -10.00%
- Reading proficiency
- 52% ▼ -5.00%
- Median HH income
- $45,039
- Composite
- 43.14/100
- National rank
- #3074
- State rank
- #32 of 73 in FL
Livability — Zephyrhills West
- Score
- 61/100
- State rank
- #772
- US rank
- #17403
Category grades
Schools grade is shown separately in the Schools card above.
Census & demographics
- Census place
- Zephyrhills West, FL
- County
- Pasco County · 524,098 people
- Metro
- Tampa-St. Petersburg-Clearwater, FL
- Population (ZIP)
- 23,612
- Household income
- $49,316
- Rent vs Own
- Severe rent burden
- 831.0
Population outlook (Pasco County) Hauer SSP2
- Today (2025)
- 570,045 people
- By 2030
- 605,844 · +6.3%
- By 2040
- 674,806 · +18.4%
- By 2050
- 736,022 · +29.1%
- By 2075
- 862,900 · +51.4%
- By 2100
- 906,364 · +59.0%
Race, ethnicity, and origin ACS 2023
- Neighborhood character
- Predominantly White (76%)
- Race & ethnicity
- White 76% Hispanic / Latino 17% Two or more races 8% Black 4% Asian 1%
- Hispanic origin (detail)
- Mexican 2% Puerto Rican 10%
- Common ancestry
- Lithuanian 3% Romanian 2% Iranian 2%
- Foreign-born
- 5% · Canada, Jamaica
- Languages at home
- 86% English-only · Spanish 12% Other Indo-European 1% Russian/Polish/Slavic 1%
Political lean MEDSL · Pasco
- 2024 margin
- Strong R (+25.2) · D 36.9% · R 62.1% · Other 1.0%
- 2008→2024 swing
- -21.6pp toward R · 2008: -3.6pp · 2024: -25.2pp
- All cycles
- 2024: R+25.2 2020: R+20.1 2016: R+21.6 2012: R+6.7 2008: R+3.6
Not yet ingested
- Civics
- —
Market trends
- HPI YoY
- ▼ -81.25%
- Current HPI
- 313.3993
- Rent YoY
- ▼ -3.56%
- Metro
- Tampa-St. Petersburg-Clearwater, FL
- State GDP YoY
- ▲ 3.28%
- F500 in state
- 36
Industry mix (Fortune 500 HQ in FL)
| Industry | F500 HQs | Revenue |
|---|---|---|
| Industrial Technology | 2 | $29B |
|
||
| Insurance | 2 | $17B |
|
||
| Retail | 1 | $60B |
|
||
| Technology Distribution | 1 | $58B |
|
||
| Homebuilding | 1 | $35B |
|
||
| Technology Manufacturing | 1 | $35B |
|
||
Price history
-37.0% since first listed15 events — show timeline
- 2026-04-14 Pending — Stellar MLS as Distributed by MLS Grid
- 2026-03-25 Price Changed $85,000 Stellar MLS as Distributed by MLS Grid
- 2026-03-12 Price Changed $89,500 Stellar MLS as Distributed by MLS Grid
- 2026-03-04 Price Changed $99,500 Stellar MLS as Distributed by MLS Grid
- 2026-02-02 Price Changed $106,000 Stellar MLS as Distributed by MLS Grid
- 2026-01-13 Price Changed $112,500 Stellar MLS as Distributed by MLS Grid
- 2025-10-14 Listed $114,500 Stellar MLS as Distributed by MLS Grid
- 2025-04-21 Pending — Stellar MLS as Distributed by MLS Grid
- 2025-04-01 Price Changed $105,000 Stellar MLS as Distributed by MLS Grid
- 2025-02-05 Price Changed $115,000 Stellar MLS as Distributed by MLS Grid
- 2025-01-29 Price Changed $124,000 Stellar MLS as Distributed by MLS Grid
- 2024-11-21 Price Changed $129,000 Stellar MLS as Distributed by MLS Grid
- 2024-11-19 Price Changed $131,000 Stellar MLS as Distributed by MLS Grid
- 2024-08-09 Price Changed $133,000 Stellar MLS as Distributed by MLS Grid
- 2024-05-29 Listed $135,000 Stellar MLS as Distributed by MLS Grid
Property tax history
+18.1%/yrLatest (2025): $2,440 · +1.4% YoY. Source: county tax records.
Cash-flow waterfall
monthlySold comps — $/sqft
last 12 mo · ≤1 miLoading sold comps…