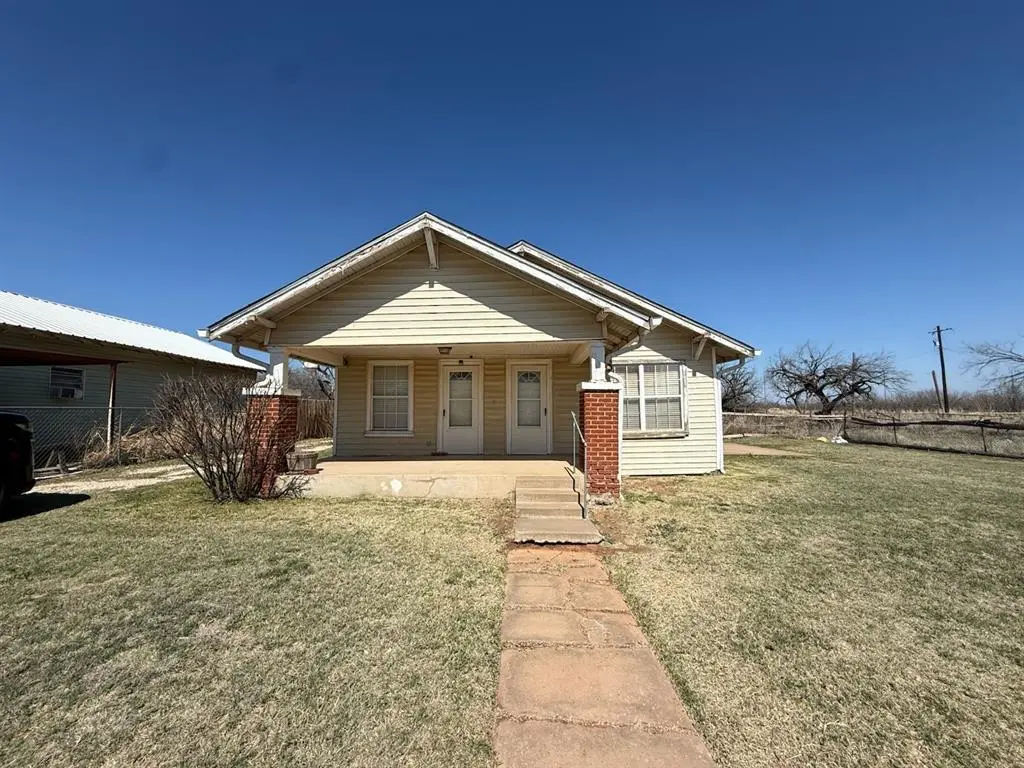
618 12th · Anson, TX
Flood risk No data
- FEMA flood zone
- —
- Chance of flooding over 30 yrs
- —
- Est. flood insurance / yr
- —
Fire risk No data
- Est. fire insurance / yr
- —
Heat risk No data
- Hot days now (above threshold)
- —
- Hot days in 30 yrs
- —
Wind risk No data
- Chance of severe wind over 30 yrs
- —
Air-quality risk No data
- Unhealthy air days now
- —
- Unhealthy air days in 30 yrs
- —
Risk factors via First Street. Map © Google.
Why this score? — see what drove the B- grade
The composite is a weighted blend of 9 inputs, each scored 0–100. Each bar is that input's sub-score; the figure is the points it added to the 100-point composite (weight × sub-score).
- Cash flow +30.0/30.0
- 1% rule +10.0/10.0
- DSCR +10.0/10.0
- Appreciation +7.1/10.0
- Livability +3.5/5.0
- Schools +2.8/10.0
- Rent growth +2.5/5.0
- Condition / age +2.5/5.0
- ARV discount +0.0/15.0
$85,000
🖨 Deal sheet 📄 Offer letter ✓ Due diligence
Listing remarks MLS
Investor special!!! Bring your ideas to make this place your own. Home to be sold AS IS but it will come with a brand new roof.
Key facts
- Brand new roof
- 8,407 sq ft lot
- 2 garage spots
Tags
Neighborhood map
What this means for you Summary
Snapshot
- This is a 3-bed/1.0-bath single-family listed at $85k.
Deal economics
- At list price, monthly cash flow is $2k ($22k/yr) — positive.
- The deal already cash-flows at list — no discount required.
- Meets the 1% rule at list price ($3k rent vs $85k).
- Recommended offer: $80k (6.0% below list) — sets the bar for market timing.
Location & tenants
- Location reads 70/100 on livability (#377 in TX) — a middle-class / working-renter tenant base. Strengths: crime A+, cost of living A+, housing A-; Watch: health & safety C-, schools D, employment D.
- Anson ISD (rural): math 29% / reading 37% proficiency, ranked #565 of 826 in TX (top 68%) — families likely to look elsewhere, expect single-tenant / working-renter base with shorter leases.
- Market conditions: 71 active listings in the ZIP; 1 units permitted in Jones County in 2024 (0 in 5+ unit buildings).
Forward outlook
- In year one you build about $4k of equity ($588 loan paydown + $4k appreciation (4.1% local appreciation)).
- Jones County population projected at +13% by 2050 — modest demand growth; plan on rents tracking national, not racing it.
- At projected returns (4.1% appreciation + 3.0% rent growth), your $24k cash investment doubles in ~1 year — after that, you're playing with house money.
- By year 8, paydown + projected appreciation supports a ~$31k cash-out refi (75% LTV) — recoverable capital for the next deal without selling this one.
Negotiation context
- It's been on market 69 days — a 6% lower offer ($80k) is reasonable based on typical stale-listing flexibility.
Risks & watch-outs
- Watch-outs: built in 1928 — expect roof / HVAC / electrical / plumbing capex.
Questions for the listing agent
- It's been on market 69 days. Have you received any prior offers? Is the seller open to a 6% concession, seller financing, or rate buy-down credit?
- Built in 1928 — when were the roof, HVAC, electrical panel, plumbing, and water heater last replaced?
- Why hasn't it sold? Are there any deal-killer items the seller is aware of (foundation, flood, title, zoning, code violations)?
- Is there a deadline driving the sale (1031 exchange, divorce, estate, relocation)? That informs how much negotiation room exists.
- Schools are D-rated, which usually means shorter tenancies and higher turnover. Who's the typical renter profile here, and what's been the actual vacancy rate?
- What's the average days-on-market for RENTAL listings here right now (not sales)? A rising rental-DOM trend means longer vacancies and softer asking-rent achievability than the comps imply.
- What's the recent tenant-quality profile in this submarket — average credit score on applications, eviction rate, late-payment / NSF rate, and stable-employment percentage? A property-management company in the area should have these aggregated.
- How much new for-sale + rental construction is in the pipeline within 1–3 miles? Heavy new supply typically softens prices + rents 12–24 months out; constrained supply supports both.
Investment metrics
- 1% rule
- 3.73% ✓
- Cap rate
- 32.64%
- Cash-on-cash
- 94.11%
- DSCR
- 5.19
- GRM
- 2.2
CMA / ARV
- ARV (median comp)
- $68,082
- List price
- $85,000
- Delta
- 24.85%
- Verdict
- OVERPRICED
- Comps
- 20 within 1.0 mi
Show comp detail 12 sales within ~0.75 mi
| Address | Dist | Beds/Ba | Sqft | Sold | Price | $/sf | Match |
|---|---|---|---|---|---|---|---|
| 1726 Avenue J | 0.45mi | 2/1.0 (-1) | 1,142 (+2%) | 3mo | $94,500 | $83 | 68 |
| 1302 6th St | 0.64mi | 3/1.0 | 1,122 (+0%) | 10mo | $77,000 | $69 | 61 |
| 1507 Avenue M | 0.56mi | 2/1.0 (-1) | 1,162 (+4%) | 5mo | $105,000 | $90 | 58 |
| 620 Avenue Ave N | 0.70mi | 3/2.0 | 1,148 (+2%) | 2mo | $165,000 | $144 | 57 |
| 1304 Westover Dr | 0.71mi | 3/1.0 | 1,213 (+8%) | 1mo | $114,900 | $95 | 52 |
| 731 Avenue J | 0.36mi | 2/1.0 (-1) | 1,180 (+5%) | 23mo | $72,500 | $61 | 50 |
| 407 Commercial Ave | 0.59mi | 2/1.0 (-1) | 1,225 (+9%) | 2mo | $47,500 | $39 | 50 |
| 400 Avenue K | 0.68mi | 3/1.0 | 991 (-12%) | 0mo | $179,000 | $181 | 49 |
| 507 Ave K | 0.59mi | 2/2.0 (-1) | 1,097 (-2%) | 15mo | $80,000 | $73 | 48 |
| 400 Commercial Ave | 0.63mi | 3/1.0 | 1,277 (+14%) | 4mo | $157,500 | $123 | 44 |
| 415 Avenue K | 0.63mi | 3/2.0 | 1,205 (+8%) | 16mo | $159,900 | $133 | 40 |
| 231 Avenue L | 0.74mi | 2/1.0 (-1) | 981 (-12%) | 7mo | $84,990 | $87 | 34 |
Match score weights: distance 35% · size 25% · config 20% · recency 20%. Top-matched comps best support the ARV.
Projected returns pro-forma
4.13% appreciation · 3.0% rent growth · sell at horizon
- IRR
- 99.0%
- Equity multiple
- 6.65×
- Total profit
- $134,394
- Equity at exit
- $43,750
- IRR
- 98.0%
- Equity multiple
- 13.85×
- Total profit
- $305,833
- Equity at exit
- $72,084
Cash invested: $23,800 (down + closing). Projections, not guarantees.
Landlord ↔ Tenant lean methodology
- Overall (STATE)
- 87 Strongly Landlord-Friendly
- State Texas
- 87 Strongly Landlord-Friendly · R+5
- County
- — inherits STATE
- City
- — inherits STATE
ZIP-level market 79501
- Home prices YoY
- 2.9%
- Active inventory
- 71
- Price-to-rent
- 2.2×
Monthly cashflow live
- Estimated rent
- $3,169 medium interval (Pro) →
- Mortgage (P&I)
- −$446
- Tax from tax record
- −$156 /mo · $1,872/yr
- Insurance
- −$35
- HOA
- −$0
- Vacancy / Maint / Mgmt
- −$666
- Net cashflow
- $1,866
Break-even live
UW: 25.0% down · 7.5% · 30yr · 1.5% tax · 5.0% vac · 8.0% maint · 8.0% mgmt
Financing live
Cash to close
- Down payment
- $21,250
- Closing costs
- $2,550
- Reserves months
- —
- Total cash needed
- —
Loan-product check · same deal, 3 products live
Conventional
25% down · 7.5% · 30yr
- Down + closing
- —
- Monthly P&I
- —
- Monthly cashflow
- —
- DSCR
- —
- Eligible?
- —
Personal DTI + credit; lowest rate.
DSCR
20% down · 8.5% · 30yr
- Down + closing
- —
- Monthly P&I
- —
- Monthly cashflow
- —
- DSCR
- —
- Eligible?
- —
No personal income docs; deal must DSCR.
Hard money
10% down · 12.0% · 12mo
- Down + closing
- —
- Monthly P&I
- —
- Monthly cashflow
- —
- DSCR
- —
- Eligible?
- —
Short-term bridge; refi at stabilization.
Listing history 21 events
-
2026-06-19days on market $85,000 Active 69 DOM
-
2026-06-18days on market $85,000 Active 68 DOM
-
2026-06-17days on market $85,000 Active 67 DOM
-
2026-06-16days on market $85,000 Active 66 DOM
-
2026-06-15days on market $85,000 Active 65 DOM
-
2026-06-14days on market $85,000 Active 63 DOM
-
2026-06-13days on market $85,000 Active 62 DOM
-
2026-06-10days on market $85,000 Active 60 DOM
-
2026-06-09days on market $85,000 Active 59 DOM
-
2026-06-08days on market $85,000 Active 58 DOM
-
2026-06-07days on market $85,000 Active 57 DOM
-
2026-06-03days on market $85,000 Active 53 DOM
-
2026-06-02pricestatusdays on market $85,000 Active 52 DOM
-
2026-06-01days on market $95,000 Active Option Contract 51 DOM
-
2026-05-31days on market $95,000 Active Option Contract 50 DOM
-
2026-05-30days on market $95,000 Active Option Contract 49 DOM
-
2026-04-30price $95,000 127-char remark
Show marketing remark (127 chars)
Investor special!!! Bring your ideas to make this place your own. Home to be sold AS IS but it will come with a brand new roof.
-
2026-04-11$105,000 Active 127-char remark
Show marketing remark (127 chars)
Investor special!!! Bring your ideas to make this place your own. Home to be sold AS IS but it will come with a brand new roof.
-
2025-09-29soldstatus
-
2001-03-30soldstatus
-
1990-03-11soldstatus
ⓘ Source: listings_history table (triggers on properties + properties_extension) + one-shot
backfill from property_details.listing_events for pre-trigger history.
Tax reassessment forecast TX · Resets to sale price
- Current annual tax
- $1,872 · $156/mo
- Projected year-2 tax
- $1,872 · $156/mo
- Expected delta
- $0/yr ($0/mo · 0.0%)
ⓘ Screening estimate from a state-policy table — verify with the county assessor before closing.
Nearby sold comps map
Loading sold comps map…
Walkable amenities ~0.75 mi
Loading nearby amenities…
Taxation est. · year 1
- Rental income
- $38,030
- − Mortgage interest
- −$4,761
- − Property taxes
- −$1,872
- − Insurance
- −$425
- − Repairs & maintenance
- −$3,042
- − Management
- −$3,042
- − Depreciation
- −$2,473
- Taxable income
- $22,414
- Est. tax owed @ 24.0%
- −$5,379
- After-tax cash flow
- $17,018/yr
For passive investors: Depreciation is non-cash, so a rental often shows a tax loss while cash-flowing — sheltering income. Rental losses are passive: they offset passive income freely, and up to $25,000/yr can offset ordinary (W-2) income if you actively participate and your MAGI is under $100k (phasing out to $0 by $150k); unused losses carry forward. On sale, claimed depreciation is recaptured at up to 25%, and gains may owe capital-gains tax (a 1031 exchange can defer both). Figures are a year-1 estimate at your 24.0% rate — not tax advice; consult a CPA.
Schools (NCES district)
- District
- Anson ISD
- NCES district ID
- 4808400
- Math proficiency
- 29% ▼ -9.00%
- Reading proficiency
- 37% ▼ -3.00%
- Median HH income
- $45,223
- Composite
- 28.21/100
- National rank
- #6805
- State rank
- #565 of 826 in TX
Livability — Anson
- Score
- 70/100
- State rank
- #377
- US rank
- #7976
Category grades
Schools grade is shown separately in the Schools card above.
Census & demographics
- Census place
- Anson, TX
- City population
- 2,635
- Population (ZIP)
- 2,635
Population outlook (Jones County) Hauer SSP2
- Today (2025)
- 19,845 people
- By 2030
- 20,213 · +1.9%
- By 2040
- 21,446 · +8.1%
- By 2050
- 22,499 · +13.4%
- By 2075
- 23,272 · +17.3%
- By 2100
- 20,420 · +2.9%
Race, ethnicity, and origin ACS 2023
- Neighborhood character
- Predominantly White (65%)
- Race & ethnicity
- White 65% Hispanic / Latino 31% Two or more races 12% Black 2%
- Hispanic origin (detail)
- Mexican 24%
- Common ancestry
- Slovak 4% Serbian 2% Scotch-Irish 1%
- Foreign-born
- 5% · Canada, Vietnam
- Languages at home
- 81% English-only · Spanish 19%
Political lean MEDSL · Jones
- 2024 margin
- Solid R (+73.2) · D 13.1% · R 86.2%
- 2008→2024 swing
- -27.1pp toward R · 2008: -46.1pp · 2024: -73.2pp
- All cycles
- 2024: R+73.2 2020: R+69.1 2016: R+65.4 2012: R+54.5 2008: R+46.1
Not yet ingested
- Civics
- —
Market trends
- HPI YoY
- ▲ 4.13%
- Current HPI
- 148.5884
- Rent YoY
- —
- Metro
- —
- State GDP YoY
- ▲ 3.95%
- F500 in state
- 110
Industry mix (Fortune 500 HQ in TX)
| Industry | F500 HQs | Revenue |
|---|---|---|
| Energy | 16 | $1,198B |
|
||
| Technology | 5 | $198B |
|
||
| Engineering / Construction | 4 | $72B |
|
||
| Energy Services | 3 | $60B |
|
||
| Utilities | 3 | $41B |
|
||
| Healthcare | 2 | $330B |
|
||
Price history
-9.5% since first listed5 events — show timeline
- 2026-04-30 Price Changed $95,000 NTREIS
- 2026-04-11 Listed $105,000 NTREIS
- 2025-09-29 Sold (Public Records) — Public Records
- 2001-03-30 Sold (Public Records) — Public Records
- 1990-03-11 Sold (Public Records) — Public Records
Property tax history
+5.3%/yrLatest (2025): $1,872 · +20.7% YoY. Source: county tax records.
Cash-flow waterfall
monthlySold comps — $/sqft
last 12 mo · ≤1 miLoading sold comps…