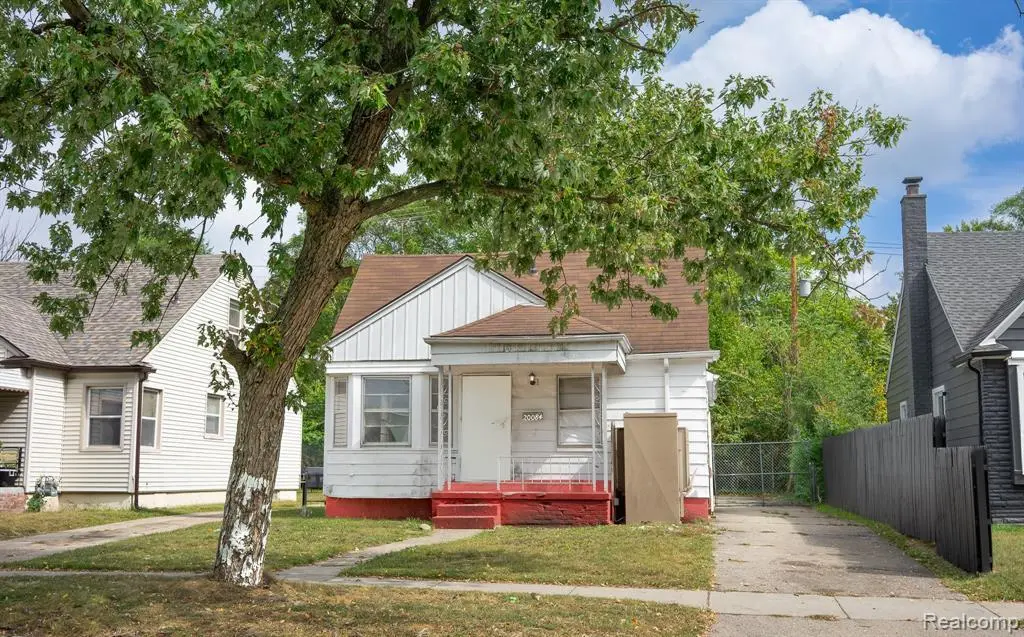
20084 Stahelin Ave · Detroit, MI
Flood risk 1/10 · Minimal
- FEMA flood zone
- X (unshaded)
- Chance of flooding over 30 yrs
- 0.0%
- Est. flood insurance / yr
- $473 – $860
Fire risk 1/10 · Minimal
- Est. fire insurance / yr
- $784 – $1,456
Heat risk 2/10 · Minimal
- Hot days now (above 98°F)
- 7 days/yr
- Hot days in 30 yrs
- 14 days/yr
Wind risk 2/10 · Minimal
- Chance of severe wind over 30 yrs
- —
Air-quality risk 3/10 · Minor
- Unhealthy air days now
- 2 days/yr
- Unhealthy air days in 30 yrs
- 5 days/yr
Risk factors via First Street. Map © Google.
Why this score? — see what drove the B grade
The composite is a weighted blend of 9 inputs, each scored 0–100. Each bar is that input's sub-score; the figure is the points it added to the 100-point composite (weight × sub-score).
- Cash flow +30.0/30.0
- ARV discount +12.9/15.0
- 1% rule +10.0/10.0
- DSCR +10.0/10.0
- Rent growth +4.5/5.0
- Livability +3.7/5.0
- Condition / age +2.5/5.0
- Schools +1.3/10.0
- Appreciation +0.0/10.0
$65,000
🖨 Deal sheet 📄 Offer letter ✓ Due diligence
Listing remarks MLS
SELLER FINANCING / LAND CONTRACT TERMS AVAILABLE AT 70,000 PURCHASE PRICE, 20,000 DOWN PAYMENT, 8% INTEREST, 72 MONTH TERM. 877 / MONTH. seller financing/land contract terms are negotiable. A fantastic opportunity ready for your personal touch! This generously sized home is perfect for investors or a hands-on homeowner eager to bring their vision to reality. Ideally situated near main roads, schools, parks, and shopping, it provides quick access to everything the city has to offer and more. Don't miss out - book your private tour today! Purchaser to pay 395 processing fee. As-is sale.
Key facts
- 5,227 sq ft lot
- Built 1947
- Listed 38 days
Property features AI
Exterior
- Parking: No garage
- Utilities: Public water; Public sewer
- Home design: Single-family residence; One story; Residential property
- Construction: Vinyl siding; Built with traditional foundation
- Exterior features: Paved road access; Asphalt roof; Ground-level entry with steps; Lot roughly 40 x 130 (about 0.12 acres)
Interior
- Bathrooms: 1 full bathroom; 1 half bathroom
- Heating & cooling: Forced air heating (natural gas); No cooling
- Interior features: Unfinished basement; Total of 3 rooms
Neighborhood map
What this means for you Summary
Snapshot
- This is a 3-bed/1.0-bath single-family listed at $65k.
Deal economics
- At list price, monthly cash flow is $608 ($7k/yr) — positive.
- The deal already cash-flows at list — no discount required.
- Meets the 1% rule at list price ($1k rent vs $65k).
- Recommended offer: $63k (3.0% below list) — sets the bar for market timing.
- Cap rate 17.5% vs local median 10.2% in Detroit — top-decile yield for the area; either an underpriced asset or a hidden risk that comps aren't pricing in. Stress-test before assuming the spread holds.
Location & tenants
- Location reads 73/100 on livability (#218 in MI) — a middle-class / working-renter tenant base. Strengths: amenities A+, commute A+, cost of living A+; Watch: schools F, crime F, employment F.
- Detroit Public Schools Community District (urban): math 10% / reading 24% proficiency, ranked #499 of 540 in MI (top 92%) — low school quality limits family demand, transient renter base, plan for 1-2y turnover; 90% free/reduced lunch — lower-income household profile, screen leases tightly.
- Market conditions: Rents rising fast (+8.0%/yr); 305 active listings in the ZIP; 37 comparable units currently listed for rent nearby; rentals at typical pace (median 17d on market — plan ~3-4 weeks tenant-placement turnaround); lower-income renter base — watch delinquency; 2,639 units permitted in Wayne County in 2024 (1,216 in 5+ unit buildings).
- This rent runs 37% of the median local income ($44k/yr) — at the standard rent-burdened threshold; future hikes will face affordability resistance.
Forward outlook
- Local home prices are declining (-3.0%/yr); year-one equity from $449 of loan paydown is wiped out by about $2k of value loss. Plan a longer hold.
- Wayne County population projected at -17% by 2050 — secular population decline; favor cash flow + early exit over multi-decade hold.
- At projected returns (-3.0% appreciation + 8.0% rent growth), your $18k cash investment doubles in ~3 years — after that, you're playing with house money.
Negotiation context
- It's been on market 39 days — a 3% lower offer ($63k) is reasonable based on typical stale-listing flexibility.
- 4 sale attempts with the ask held roughly flat each time — persistent listings suggest the price (not the market) is what's stuck; bring a comps-based counter.
Risks & watch-outs
- Watch-outs: built in 1947 — expect roof / HVAC / electrical / plumbing capex.
Questions for the listing agent
- It's been on market 39 days. Have you received any prior offers? Is the seller open to a 3% concession, seller financing, or rate buy-down credit?
- Built in 1947 — when were the roof, HVAC, electrical panel, plumbing, and water heater last replaced?
- Is there a deadline driving the sale (1031 exchange, divorce, estate, relocation)? That informs how much negotiation room exists.
- Schools are F-rated, which usually means shorter tenancies and higher turnover. Who's the typical renter profile here, and what's been the actual vacancy rate?
- Crime grade is F in this area — have there been break-ins, vandalism, or insurance claims at this property in the last 3 years? What carrier currently insures it and at what premium?
- What's the average days-on-market for RENTAL listings here right now (not sales)? A rising rental-DOM trend means longer vacancies and softer asking-rent achievability than the comps imply.
- What's the recent tenant-quality profile in this submarket — average credit score on applications, eviction rate, late-payment / NSF rate, and stable-employment percentage? A property-management company in the area should have these aggregated.
- How much new for-sale + rental construction is in the pipeline within 1–3 miles? Heavy new supply typically softens prices + rents 12–24 months out; constrained supply supports both.
Investment metrics
- 1% rule
- 2.08% ✓
- Cap rate
- 17.51%
- Cash-on-cash
- 40.06%
- DSCR
- 2.78
- GRM
- 4.0
CMA / ARV
- ARV (median comp)
- $73,815
- List price
- $65,000
- Delta
- -11.94%
- Verdict
- UNDERPRICED
- Comps
- 20 within 1.0 mi
Show comp detail 12 sales within ~0.75 mi
| Address | Dist | Beds/Ba | Sqft | Sold | Price | $/sf | Match |
|---|---|---|---|---|---|---|---|
| 20084 Greenview Ave | 0.12mi | 3/1.0 | 912 (+4%) | 5mo | $90,000 | $99 | 84 |
| 19900 Southfield Rd | 0.49mi | 3/1.0 | 898 (+2%) | 4mo | $110,000 | $122 | 70 |
| 20245 Archdale St | 0.55mi | 3/1.0 | 890 (+1%) | 4mo | $53,000 | $60 | 69 |
| 20004 Southfield Fwy | 0.46mi | 2/1.0 (-1) | 929 (+6%) | 1mo | $20,000 | $22 | 63 |
| 19365 Fenmore St | 0.67mi | 3/1.0 | 912 (+4%) | 1mo | $94,900 | $104 | 62 |
| 19333 Grandville Ave | 0.58mi | 2/1.0 (-1) | 851 (-3%) | 3mo | $45,000 | $53 | 60 |
| 19177 Stahelin Ave | 0.62mi | 3/1.0 | 816 (-7%) | 5mo | $60,000 | $74 | 55 |
| 19158 Stahelin Ave | 0.63mi | 2/1.0 (-1) | 850 (-3%) | 6mo | $100,000 | $118 | 55 |
| 19425 Faust Ave | 0.45mi | 3/1.0 | 1,000 (+14%) | 5mo | $65,000 | $65 | 52 |
| 19363 Plainview Ave | 0.72mi | 3/1.0 | 823 (-6%) | 5mo | $55,000 | $67 | 51 |
| 19950 Oakfield St | 0.64mi | 3/1.0 | 1,001 (+14%) | 5mo | $40,000 | $40 | 43 |
| 19352 Evergreen Rd | 0.75mi | 2/1.0 (-1) | 752 (-14%) | 2mo | $75,000 | $100 | 34 |
Match score weights: distance 35% · size 25% · config 20% · recency 20%. Top-matched comps best support the ARV.
Projected returns pro-forma
-3.0% appreciation · 8.0% rent growth · sell at horizon
- IRR
- 42.1%
- Equity multiple
- 2.94×
- Total profit
- $35,348
- Equity at exit
- $9,692
- IRR
- 50.6%
- Equity multiple
- 7.23×
- Total profit
- $113,305
- Equity at exit
- $5,620
Cash invested: $18,200 (down + closing). Projections, not guarantees.
Landlord ↔ Tenant lean methodology
- Overall (STATE)
- 62 Landlord-Friendly
- State Michigan
- 62 Landlord-Friendly · EVEN
- County
- — inherits STATE
- City
- — inherits STATE
ZIP-level market 48219
- Home prices YoY
- -10.3%
- Rents YoY
- 8.0%
- Active inventory
- 305
- Price-to-rent
- 4.0×
Monthly cashflow live
- Estimated rent
- $1,355 high interval (Pro) →
- Mortgage (P&I)
- −$341
- Tax from tax record
- −$95 /mo · $1,138/yr
- Insurance
- −$27
- HOA
- −$0
- Vacancy / Maint / Mgmt
- −$284
- Net cashflow
- $608
Break-even live
UW: 25.0% down · 7.5% · 30yr · 1.5% tax · 5.0% vac · 8.0% maint · 8.0% mgmt
Financing live
Cash to close
- Down payment
- $16,250
- Closing costs
- $1,950
- Reserves months
- —
- Total cash needed
- —
Loan-product check · same deal, 3 products live
Conventional
25% down · 7.5% · 30yr
- Down + closing
- —
- Monthly P&I
- —
- Monthly cashflow
- —
- DSCR
- —
- Eligible?
- —
Personal DTI + credit; lowest rate.
DSCR
20% down · 8.5% · 30yr
- Down + closing
- —
- Monthly P&I
- —
- Monthly cashflow
- —
- DSCR
- —
- Eligible?
- —
No personal income docs; deal must DSCR.
Hard money
10% down · 12.0% · 12mo
- Down + closing
- —
- Monthly P&I
- —
- Monthly cashflow
- —
- DSCR
- —
- Eligible?
- —
Short-term bridge; refi at stabilization.
Rent comps 37 comps
| Address | Beds | Baths | Sqft | Rent | $/sqft | DOM | Units | Dist |
|---|---|---|---|---|---|---|---|---|
| 20011 Avon Ave Detroit, MI | 3.0 | 1.0 | 1000 | $1,200 | $1.20 | 4d | 1 | 0.08mi |
| 20068 Faust Ave Detroit, MI | 2.0 | 1.0 | 750 | $1,100 | $1.47 | 24d | 1 | 0.18mi |
| 20271 Grandville Ave Detroit, MI | 3.0 | 1.0 | 1010 | $1,550 | $1.53 | 23d | 1 | 0.30mi |
| 20527 Rosemont Ave Detroit, MI | 2.0 | 2.0 | 975 | $1,528 | $1.57 | 43d | 1 | 0.34mi |
| 19970 Ashton Ave Detroit, MI | 3.0 | 1.0 | 1000 | $1,000 | $1.00 | 43d | 1 | 0.38mi |
| 19445 Avon Ave Detroit, MI | 3.0 | 1.0 | 1023 | $1,550 | $1.52 | 43d | 1 | 0.40mi |
| 19918 Southfield Fwy Detroit, MI | 3.0 | 1.0 | 915 | $1,375 | $1.50 | 14d | 1 | 0.48mi |
| 20043 Fenmore St Detroit, MI | 3.0 | 1.0 | 1030 | $1,453 | $1.41 | 43d | 1 | 0.48mi |
| 19372 Grandville Ave Detroit, MI | 2.0 | 1.5 | 733 | $1,050 | $1.43 | 14d | 1 | 0.52mi |
| 19329 Stahelin Ave Unit 1 Detroit, MI | 3.0 | 1.5 | 833 | $1,250 | $1.50 | 43d | 1 | 0.53mi |
| 19818 Fenmore St Detroit, MI | 3.0 | 1.0 | 902 | $1,275 | $1.41 | 43d | 1 | 0.53mi |
| 20259 Oakfield St Detroit, MI | 3.0 | 1.0 | 1056 | $1,250 | $1.18 | 16d | 1 | 0.61mi |
| 19176 Grandville Ave Detroit, MI | 3.0 | 1.0 | 941 | $1,300 | $1.38 | 4d | 1 | 0.66mi |
| 19457 Evergreen Rd Detroit, MI | 2.0 | 1.0 | 1100 | $1,200 | $1.09 | 43d | 1 | 0.71mi |
| 20203 Gilchrist St Detroit, MI | 3.0 | 1.0 | 1031 | $1,250 | $1.21 | 4d | 1 | 0.72mi |
| 20314 Gilchrist St Detroit, MI | 3.0 | 1.0 | 1042 | $1,500 | $1.44 | 4d | 1 | 0.77mi |
| 20210 Biltmore St Detroit, MI | 3.0 | 1.0 | 1033 | $1,350 | $1.31 | 24d | 1 | 0.81mi |
| 19736 Gilchrist St Detroit, MI | 2.0 | 1.0 | 696 | $995 | $1.43 | 12d | 1 | 0.82mi |
| 18699 Shaftsbury Ave Detroit, MI | 2.0 | 1.0 | 800 | $1,000 | $1.25 | 43d | 1 | 0.83mi |
| 18659 Shaftsbury Ave Detroit, MI | 3.0 | 1.0 | 763 | $1,373 | $1.80 | 12d | 1 | 0.87mi |
| 19781 Fielding St Detroit, MI | 3.0 | 1.0 | 1000 | $1,294 | $1.29 | 4d | 1 | 0.89mi |
| 18452 Shaftsbury Ave Detroit, MI | 3.0 | 1.0 | 927 | $1,500 | $1.62 | 16d | 1 | 1.01mi |
| 18494 Ashton Ave Detroit, MI | 3.0 | 1.0 | 1000 | $1,600 | $1.60 | 16d | 1 | 1.03mi |
| 18450 Edinborough Rd Detroit, MI | 3.0 | 1.0 | 1000 | $1,500 | $1.50 | 43d | 1 | 1.06mi |
| 18556 Kentfield St Detroit, MI | 3.0 | 1.0 | 952 | $1,250 | $1.31 | 2d | 1 | 1.15mi |
| 19467 Rutherford St Detroit, MI | 3.0 | 1.0 | 1002 | $1,200 | $1.20 | 16d | 1 | 1.19mi |
| 18461 Heyden St Detroit, MI | 2.0 | 1.0 | 1000 | $1,050 | $1.05 | 4d | 1 | 1.21mi |
| 19440 Rutherford St Detroit, MI | 3.0 | 1.0 | 1000 | $1,400 | $1.40 | 24d | 1 | 1.23mi |
| 16500 N Park Dr Southfield, MI | 1.0–3.0 | 1.0–2.5 | 1500 | $2,289 | $1.53 | 1d | 1 | 1.27mi |
| 20555 Motor Dr Detroit, MI | 1.0–2.0 | 1.0 | 750 | $1,222 | $1.63 | 14d | 5 | 1.29mi |
| 17654 Sunderland Rd Detroit, MI | 3.0 | 1.0 | 1100 | $1,500 | $1.36 | 43d | 1 | 1.29mi |
| 18276 Oakfield St Detroit, MI | 2.0 | 1.0 | 726 | $1,175 | $1.62 | 43d | 1 | 1.30mi |
| 18191 Heyden St Detroit, MI | 2.0 | 1.0 | 917 | $1,100 | $1.20 | 24d | 1 | 1.34mi |
| 18134 Vaughan St Detroit, MI | 3.0 | 1.0 | 1060 | $1,150 | $1.08 | 16d | 1 | 1.36mi |
| 21422 Pembroke Ave Detroit, MI | 3.0 | 1.5 | 1000 | $1,695 | $1.70 | 16d | 1 | 1.36mi |
| 18274 Fielding St Detroit, MI | 2.0 | 1.0 | 700 | $1,200 | $1.71 | 16d | 1 | 1.37mi |
| 18205 Stout St Detroit, MI | 3.0 | 1.0 | 901 | $1,078 | $1.20 | 24d | 1 | 1.40mi |
Listing history 19 events
-
2026-06-18days on market $65,000 Active 39 DOM
-
2026-06-17days on market $65,000 Active 38 DOM
-
2026-06-15days on market $65,000 Active 36 DOM
-
2026-06-13days on market $65,000 Active 34 DOM
-
2026-06-13days on market $65,000 Active 33 DOM
-
2026-06-09days on market $65,000 Active 30 DOM
-
2026-06-08days on market $65,000 Active 29 DOM
-
2026-06-07days on market $65,000 Active 28 DOM
-
2026-06-04days on market $65,000 Active 25 DOM
-
2026-06-03days on market $65,000 Active 24 DOM
-
2026-06-02days on market $65,000 Active 23 DOM
-
2026-06-01days on market $65,000 Active 22 DOM
-
2026-05-31days on market $65,000 Active 21 DOM
-
2026-05-11$65,000 Active 602-char remark
-
2026-05-10$65,000 Active 591-char remark
Show marketing remark (591 chars)
SELLER FINANCING / LAND CONTRACT TERMS AVAILABLE AT 70,000 PURCHASE PRICE, 20,000 DOWN PAYMENT, 8% INTEREST, 72 MONTH TERM. 877 / MONTH. seller financing/land contract terms are negotiable. A fantastic opportunity ready for your personal touch! This generously sized home is perfect for investors or a hands-on homeowner eager to bring their vision to reality. Ideally situated near main roads, schools, parks, and shopping, it provides quick access to everything the city has to offer and more. Don't miss out - book your private tour today! Purchaser to pay 395 processing fee. As-is sale.
-
2025-06-01historical
-
2025-06-01historical
-
2025-03-05$64,900 Active
-
2025-03-05$64,900 Active
ⓘ Source: listings_history table (triggers on properties + properties_extension) + one-shot
backfill from property_details.listing_events for pre-trigger history.
Tax reassessment forecast MI · Partial reset (capped growth)
- Current annual tax
- $1,138 · $95/mo
- Projected year-2 tax
- $1,138 · $95/mo
- Expected delta
- $0/yr ($0/mo · 0.0%)
ⓘ Screening estimate from a state-policy table — verify with the county assessor before closing.
Climate risk First Street
- Flood 1/10 Low FEMA zone X (unshaded) · 0% chance over 30 yrs
- Wildfire 1/10 Low
- Heat 2/10 Low 7 d/yr ≥98°F today · 14 d/yr by 30 yrs out
- Wind 2/10 Low
- Air quality 3/10 Moderate 2 unhealthy d/yr today · 5 by 30 yrs out
Nearby sold comps map
Loading sold comps map…
Walkable amenities ~0.75 mi
Loading nearby amenities…
Taxation est. · year 1
- Rental income
- $16,257
- − Mortgage interest
- −$3,641
- − Property taxes
- −$1,138
- − Insurance
- −$325
- − Repairs & maintenance
- −$1,301
- − Management
- −$1,301
- − Depreciation
- −$1,891
- Taxable income
- $6,661
- Est. tax owed @ 24.0%
- −$1,599
- After-tax cash flow
- $5,691/yr
For passive investors: Depreciation is non-cash, so a rental often shows a tax loss while cash-flowing — sheltering income. Rental losses are passive: they offset passive income freely, and up to $25,000/yr can offset ordinary (W-2) income if you actively participate and your MAGI is under $100k (phasing out to $0 by $150k); unused losses carry forward. On sale, claimed depreciation is recaptured at up to 25%, and gains may owe capital-gains tax (a 1031 exchange can defer both). Figures are a year-1 estimate at your 24.0% rate — not tax advice; consult a CPA.
Schools (NCES district)
- District
- Detroit Public Schools Community District
- NCES district ID
- 2601103
- Math proficiency
- 10% ▼ -2.00%
- Reading proficiency
- 24% ▲ 6.00%
- Median HH income
- $25,815
- Composite
- 13.06/100
- National rank
- #9564
- State rank
- #499 of 540 in MI
Livability — Detroit
- Score
- 73/100
- State rank
- #218
- US rank
- #5427
Category grades
Schools grade is shown separately in the Schools card above.
Census & demographics
- Census place
- Detroit, MI
- County
- Wayne County · 1,562,939 people
- City population
- 572,865
- Metro
- Detroit-Warren-Dearborn, MI
- Population (ZIP)
- 47,208
- Household income
- $43,655
- Rent vs Own
- Severe rent burden
- 3584.0
Population outlook (Wayne County) Hauer SSP2
- Today (2025)
- 1,675,273 people
- By 2030
- 1,620,300 · -3.3%
- By 2040
- 1,502,341 · -10.3%
- By 2050
- 1,384,039 · -17.4%
- By 2075
- 1,124,592 · -32.9%
- By 2100
- 881,193 · -47.4%
Race, ethnicity, and origin ACS 2023
- Neighborhood character
- Predominantly Black (88%)
- Race & ethnicity
- Black 88% White 5% Two or more races 4% Hispanic / Latino 1%
- Common ancestry
- Romanian 1% Lithuanian 1%
- Foreign-born
- 2% · Canada
- Languages at home
- 96% English-only · Spanish 1% French/Haitian/Cajun 1%
Political lean MEDSL · Wayne
- 2024 margin
- Strong D (+29.0) · D 62.7% · R 33.7% · Other 3.6%
- 2008→2024 swing
- -20.5pp toward R · 2008: 49.5pp · 2024: 29.0pp
- All cycles
- 2024: D+29.0 2020: D+38.1 2016: D+37.3 2012: D+46.9 2008: D+49.5
Not yet ingested
- Civics
- —
Market trends
- HPI YoY
- ▼ -65.06%
- Current HPI
- 563.3263
- Rent YoY
- ▲ 8.04%
- Metro
- Detroit-Warren-Dearborn, MI
- State GDP YoY
- ▲ 1.37%
- F500 in state
- 28
Industry mix (Fortune 500 HQ in MI)
| Industry | F500 HQs | Revenue |
|---|---|---|
| Automotive Parts | 3 | $48B |
|
||
| Automotive | 2 | $372B |
|
||
| Chemicals | 1 | $45B |
|
||
| Automotive Retail | 1 | $29B |
|
||
| Healthcare / Medical Devices | 1 | $23B |
|
||
| Automotive Technology | 1 | $20B |
|
||
Price history
+0.2% since first listed6 events — show timeline
- 2026-05-11 Listed $65,000 REALCOMP
- 2026-05-10 Listed $65,000 MiRealSource-MiMLS
- 2025-06-01 Listing Removed — REALCOMP
- 2025-06-01 Listing Removed — MiRealSource-MiMLS
- 2025-03-05 Listed $64,900 REALCOMP
- 2025-03-05 Listed $64,900 MiRealSource-MiMLS
Property tax history
-1.1%/yrLatest (2025): $1,138 · -0.4% YoY. Source: county tax records.
Cash-flow waterfall
monthlySold comps — $/sqft
last 12 mo · ≤1 miLoading sold comps…