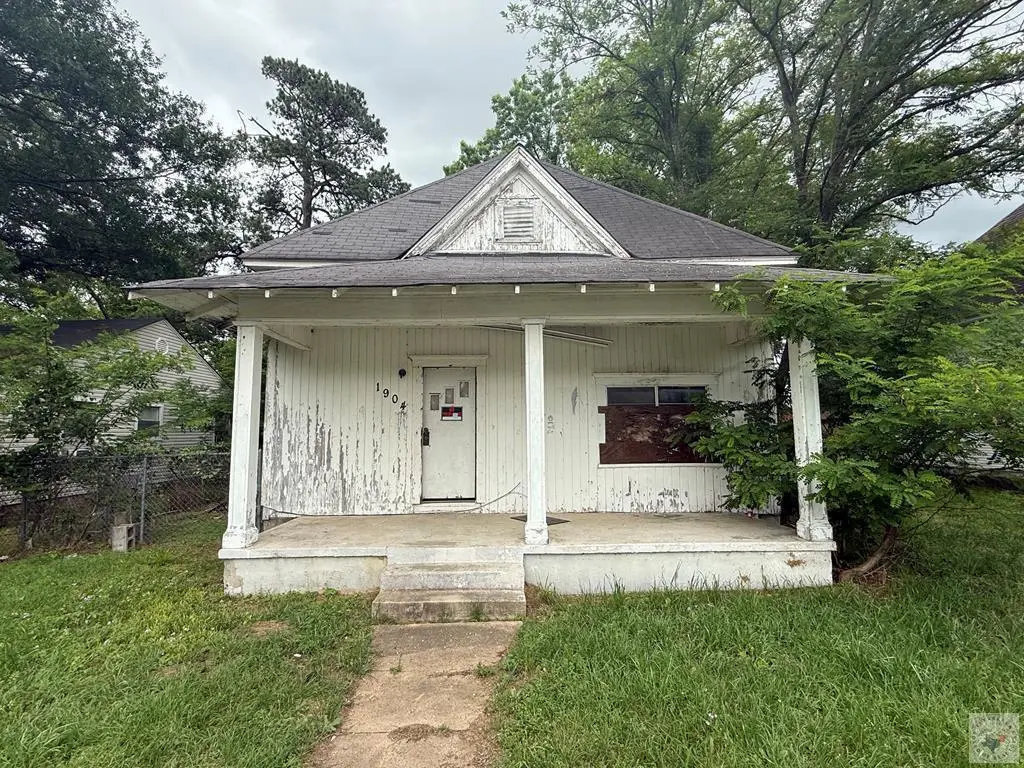
1904 Hazel St · Texarkana, TX
Flood risk 1/10 · Minimal
- FEMA flood zone
- X (unshaded)
- Chance of flooding over 30 yrs
- 0.0%
- Est. flood insurance / yr
- $507 – $1,088
Fire risk 1/10 · Minimal
- Est. fire insurance / yr
- $1,222 – $2,270
Heat risk 7/10 · Major
- Hot days now (above 112°F)
- 7 days/yr
- Hot days in 30 yrs
- 23 days/yr
Wind risk 4/10 · Minor
- Chance of severe wind over 30 yrs
- 22.0%
Air-quality risk 2/10 · Minimal
- Unhealthy air days now
- 0 days/yr
- Unhealthy air days in 30 yrs
- 1 days/yr
Risk factors via First Street. Map © Google.
Why this score? — see what drove the D grade
The composite is a weighted blend of 9 inputs, each scored 0–100. Each bar is that input's sub-score; the figure is the points it added to the 100-point composite (weight × sub-score).
- Cash flow +15.0/30.0
- ARV discount +7.5/15.0
- 1% rule +5.0/10.0
- DSCR +5.0/10.0
- Livability +3.9/5.0
- Schools +3.2/10.0
- Rent growth +2.9/5.0
- Condition / age +2.5/5.0
- Appreciation +0.0/10.0
$20,000
🖨 Deal sheet 📄 Offer letter ✓ Due diligence
Listing remarks MLS
Investor special! This property has been taken down to the studs and is ready for a full renovation. Offering a true blank slate, this home is perfect for investors or buyers looking to customize from the ground up. Great potential to add value with the right vision. Bring your ideas and make this your next project.
Key facts
- 6,969 sq ft lot
- Listed 53 days
Neighborhood map
What this means for you Summary
Snapshot
- This is a 2-bed/1.0-bath single-family listed at $20k.
Deal economics
- At list price, monthly cash flow is $555 ($7k/yr) — positive.
- The deal already cash-flows at list — no discount required.
- Meets the 1% rule at list price ($913 rent vs $20k).
- Recommended offer: $19k (3.0% below list) — sets the bar for market timing.
- Cap rate 39.6% vs local median 4.3% in Texarkana — top-decile yield for the area; either an underpriced asset or a hidden risk that comps aren't pricing in. Stress-test before assuming the spread holds.
Location & tenants
- Location reads 77/100 on livability (#93 in TX, #3,241 nationally) — a middle-class / working-renter tenant base. Strengths: cost of living A+, housing A+, health & safety A+; Watch: amenities D+, schools D, crime D.
- Texarkana ISD (urban): math 36% / reading 41% proficiency, ranked #472 of 826 in TX (top 57%) — families likely to look elsewhere, expect single-tenant / working-renter base with shorter leases; 64% free/reduced lunch — lower-income household profile, screen leases tightly.
- Market conditions: Rents rising (+1.6%/yr); 320 active listings in the ZIP; 1 comparable units currently listed for rent nearby; 137 units permitted in Bowie County in 2024 (5 in 5+ unit buildings).
Forward outlook
- Local home prices are declining (-3.0%/yr); year-one equity from $138 of loan paydown is wiped out by about $600 of value loss. Plan a longer hold.
- At projected returns (-3.0% appreciation + 1.6% rent growth), your $6k cash investment doubles in ~1 year — after that, you're playing with house money.
Negotiation context
- It's been on market 53 days — a 3% lower offer ($19k) is reasonable based on typical stale-listing flexibility.
Risks & watch-outs
- Watch-outs: property tax is 3.2% of price.
- Climate carrying-cost: extreme-heat days projected 7→23/yr by 2055 (HVAC capex compounding) — expect insurance premiums to compound above CPI over the hold.
Questions for the listing agent
- It's been on market 53 days. Have you received any prior offers? Is the seller open to a 3% concession, seller financing, or rate buy-down credit?
- Property tax is high relative to price — has the assessment been appealed recently, and will the sale trigger a re-assessment?
- Is there a deadline driving the sale (1031 exchange, divorce, estate, relocation)? That informs how much negotiation room exists.
- Schools are D-rated, which usually means shorter tenancies and higher turnover. Who's the typical renter profile here, and what's been the actual vacancy rate?
- Crime grade is D in this area — have there been break-ins, vandalism, or insurance claims at this property in the last 3 years? What carrier currently insures it and at what premium?
- The area grade is low — what's the realistic commute time and amenity access for the typical tenant pool here? Any planned neighborhood developments (good or bad) we should know about?
- What's the average days-on-market for RENTAL listings here right now (not sales)? A rising rental-DOM trend means longer vacancies and softer asking-rent achievability than the comps imply.
- What's the recent tenant-quality profile in this submarket — average credit score on applications, eviction rate, late-payment / NSF rate, and stable-employment percentage? A property-management company in the area should have these aggregated.
- How much new for-sale + rental construction is in the pipeline within 1–3 miles? Heavy new supply typically softens prices + rents 12–24 months out; constrained supply supports both.
Investment metrics
- 1% rule
- 4.57% ✓
- Cap rate
- 39.61%
- Cash-on-cash
- 118.98%
- DSCR
- 6.29
- GRM
- 1.8
CMA / ARV
- ARV (median comp)
- $91,660
- List price
- $20,000
- Delta
- -78.18%
- Verdict
- UNDERPRICED
- Comps
- 2 within 1.0 mi
Projected returns pro-forma
-3.0% appreciation · 1.63% rent growth · sell at horizon
- IRR
- —
- Equity multiple
- 6.52×
- Total profit
- $30,912
- Equity at exit
- $2,982
- IRR
- —
- Equity multiple
- 13.08×
- Total profit
- $67,622
- Equity at exit
- $1,729
Cash invested: $5,600 (down + closing). Projections, not guarantees.
Landlord ↔ Tenant lean methodology
- Overall (STATE)
- 87 Strongly Landlord-Friendly
- State Texas
- 87 Strongly Landlord-Friendly · R+5
- County
- — inherits STATE
- City
- — inherits STATE
ZIP-level market 75501
- Home prices YoY
- -34.9%
- Rents YoY
- 1.6%
- Active inventory
- 320
- Price-to-rent
- 1.8×
Monthly cashflow live
- Estimated rent
- $913 medium interval (Pro) →
- Mortgage (P&I)
- −$105
- Tax from tax record
- −$53 /mo · $636/yr
- Insurance
- −$8
- HOA
- −$0
- Vacancy / Maint / Mgmt
- −$192
- Net cashflow
- $555
Break-even live
UW: 25.0% down · 7.5% · 30yr · 1.5% tax · 5.0% vac · 8.0% maint · 8.0% mgmt
Financing live
Cash to close
- Down payment
- $5,000
- Closing costs
- $600
- Reserves months
- —
- Total cash needed
- —
Loan-product check · same deal, 3 products live
Conventional
25% down · 7.5% · 30yr
- Down + closing
- —
- Monthly P&I
- —
- Monthly cashflow
- —
- DSCR
- —
- Eligible?
- —
Personal DTI + credit; lowest rate.
DSCR
20% down · 8.5% · 30yr
- Down + closing
- —
- Monthly P&I
- —
- Monthly cashflow
- —
- DSCR
- —
- Eligible?
- —
No personal income docs; deal must DSCR.
Hard money
10% down · 12.0% · 12mo
- Down + closing
- —
- Monthly P&I
- —
- Monthly cashflow
- —
- DSCR
- —
- Eligible?
- —
Short-term bridge; refi at stabilization.
Rent comps 1 comps
| Address | Beds | Baths | Sqft | Rent | $/sqft | DOM | Units | Dist |
|---|---|---|---|---|---|---|---|---|
| 519 Oak St Texarkana, TX | 1.0–2.0 | 1.0 | 612 | $895 | $1.46 | 43d | 4 | 0.89mi |
Listing history 10 events
-
2026-06-07statusdays on market $20,000 Pending 53 DOM
-
2026-06-05days on market $20,000 Active 52 DOM
-
2026-06-02days on market $20,000 Active 50 DOM
-
2026-06-01days on market $20,000 Active 49 DOM
-
2026-05-31days on market $20,000 Active 48 DOM
-
2026-05-30days on market $20,000 Active 47 DOM
-
2026-05-15price $20,000 317-char remark
Show marketing remark (317 chars)
Investor special! This property has been taken down to the studs and is ready for a full renovation. Offering a true blank slate, this home is perfect for investors or buyers looking to customize from the ground up. Great potential to add value with the right vision. Bring your ideas and make this your next project.
-
2026-05-05price $22,000 317-char remark
Show marketing remark (317 chars)
Investor special! This property has been taken down to the studs and is ready for a full renovation. Offering a true blank slate, this home is perfect for investors or buyers looking to customize from the ground up. Great potential to add value with the right vision. Bring your ideas and make this your next project.
-
2026-04-13$24,000 Active 317-char remark
Show marketing remark (317 chars)
Investor special! This property has been taken down to the studs and is ready for a full renovation. Offering a true blank slate, this home is perfect for investors or buyers looking to customize from the ground up. Great potential to add value with the right vision. Bring your ideas and make this your next project.
-
2001-02-16soldstatus
ⓘ Source: listings_history table (triggers on properties + properties_extension) + one-shot
backfill from property_details.listing_events for pre-trigger history.
Tax reassessment forecast TX · Resets to sale price
- Current annual tax
- $636 · $53/mo
- Projected year-2 tax
- $636 · $53/mo
- Expected delta
- $0/yr ($0/mo · 0.0%)
ⓘ Screening estimate from a state-policy table — verify with the county assessor before closing.
Climate risk First Street
- Flood 1/10 Low FEMA zone X (unshaded) · 0% chance over 30 yrs
- Wildfire 1/10 Low
- Heat 7/10 Severe 7 d/yr ≥112°F today · 23 d/yr by 30 yrs out
- Wind 4/10 Moderate 22% chance of damaging wind over 30 yrs
- Air quality 2/10 Low 0 unhealthy d/yr today · 1 by 30 yrs out
Nearby sold comps map
Loading sold comps map…
Walkable amenities ~0.75 mi
Loading nearby amenities…
Taxation est. · year 1
- Rental income
- $10,959
- − Mortgage interest
- −$1,120
- − Property taxes
- −$636
- − Insurance
- −$100
- − Repairs & maintenance
- −$877
- − Management
- −$877
- − Depreciation
- −$582
- Taxable income
- $6,767
- Est. tax owed @ 24.0%
- −$1,624
- After-tax cash flow
- $5,039/yr
For passive investors: Depreciation is non-cash, so a rental often shows a tax loss while cash-flowing — sheltering income. Rental losses are passive: they offset passive income freely, and up to $25,000/yr can offset ordinary (W-2) income if you actively participate and your MAGI is under $100k (phasing out to $0 by $150k); unused losses carry forward. On sale, claimed depreciation is recaptured at up to 25%, and gains may owe capital-gains tax (a 1031 exchange can defer both). Figures are a year-1 estimate at your 24.0% rate — not tax advice; consult a CPA.
Schools (NCES district)
- District
- Texarkana ISD
- NCES district ID
- 4842480
- Math proficiency
- 36% ▼ -7.00%
- Reading proficiency
- 41% ▼ -1.00%
- Median HH income
- $35,692
- Composite
- 31.87/100
- National rank
- #5867
- State rank
- #472 of 826 in TX
Livability — Texarkana
- Score
- 77/100
- State rank
- #93
- US rank
- #3241
Category grades
Schools grade is shown separately in the Schools card above.
Census & demographics
- Census place
- Texarkana, TX
- County
- Bowie County · 61,238 people
- City population
- 61,238
- Metro
- Texarkana, TX-AR
- Population (ZIP)
- 34,866
- Household income
- $45,995
- Rent vs Own
- Severe rent burden
- 1289.0
Population outlook (Bowie County) Hauer SSP2
- Today (2025)
- 94,699 people
- By 2030
- 94,824 · +0.1%
- By 2040
- 94,870 · +0.2%
- By 2050
- 93,686 · -1.1%
- By 2075
- 90,082 · -4.9%
- By 2100
- 76,579 · -19.1%
Race, ethnicity, and origin ACS 2023
- Neighborhood character
- Diverse neighborhood (Simpson 0.59)
- Race & ethnicity
- White 54% Black 33% Hispanic / Latino 9% Two or more races 5%
- Hispanic origin (detail)
- Mexican 7%
- Common ancestry
- Italian 1% Lithuanian 1% Portuguese 1%
- Foreign-born
- 5% · Canada
- Languages at home
- 92% English-only · Spanish 6% Other Indo-European 1%
Political lean MEDSL · Bowie
- 2024 margin
- Solid R (+48.7) · D 25.3% · R 74.0%
- 2008→2024 swing
- -10.8pp toward R · 2008: -37.9pp · 2024: -48.7pp
- All cycles
- 2024: R+48.7 2020: R+42.8 2016: R+46.6 2012: R+41.5 2008: R+37.9
Not yet ingested
- Civics
- —
Market trends
- HPI YoY
- ▼ -79.14%
- Current HPI
- 147.9402
- Rent YoY
- ▲ 1.63%
- Metro
- Texarkana, TX-AR
- State GDP YoY
- ▲ 3.95%
- F500 in state
- 110
Industry mix (Fortune 500 HQ in TX)
| Industry | F500 HQs | Revenue |
|---|---|---|
| Energy | 16 | $1,198B |
|
||
| Technology | 5 | $198B |
|
||
| Engineering / Construction | 4 | $72B |
|
||
| Energy Services | 3 | $60B |
|
||
| Utilities | 3 | $41B |
|
||
| Healthcare | 2 | $330B |
|
||
Price history
-16.7% since first listed4 events — show timeline
- 2026-05-15 Price Changed $20,000 TBOR
- 2026-05-05 Price Changed $22,000 TBOR
- 2026-04-13 Listed $24,000 TBOR
- 2001-02-16 Sold (Public Records) — Public Records
Property tax history
+9.9%/yrLatest (2025): $636 · +4.3% YoY. Source: county tax records.
Cash-flow waterfall
monthlySold comps — $/sqft
last 12 mo · ≤1 miLoading sold comps…