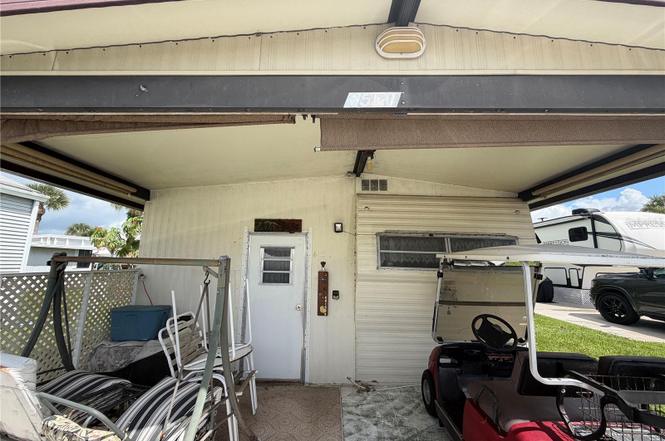
6521 SE 55th St · Taylor Creek, FL
Flood risk 4/10 · Minor
- FEMA flood zone
- AE
- Chance of flooding over 30 yrs
- 0.21%
- Est. flood insurance / yr
- $1,737 – $8,500
Fire risk 4/10 · Minor
- Est. fire insurance / yr
- $947 – $1,759
Heat risk 9/10 · Severe
- Hot days now (above 107°F)
- 7 days/yr
- Hot days in 30 yrs
- 25 days/yr
Wind risk 10/10 · Severe
- Chance of severe wind over 30 yrs
- 99.0%
Air-quality risk 2/10 · Minimal
- Unhealthy air days now
- 1 days/yr
- Unhealthy air days in 30 yrs
- 2 days/yr
Risk factors via First Street. Map © Google.
Why this score? — see what drove the B+ grade
The composite is a weighted blend of 9 inputs, each scored 0–100. Each bar is that input's sub-score; the figure is the points it added to the 100-point composite (weight × sub-score).
- Cash flow +30.0/30.0
- ARV discount +15.0/15.0
- 1% rule +10.0/10.0
- DSCR +10.0/10.0
- Schools +3.6/10.0
- Livability +2.8/5.0
- Rent growth +2.5/5.0
- Condition / age +2.5/5.0
- Appreciation +0.0/10.0
$39,900
🖨 Deal sheet 📄 Offer letter ✓ Due diligence
Listing remarks
ANCIENT OAKS RV RESORT 55+ GATED COMMUNITY - Own the lot and home in this well-maintained gated community. The HOA Monthly fee includes water, sewer, basic cable TV, lawn mowing, trash removal, and maintained amenities. The amenities include heated screened in pool and spa, Bath houses with community laundry, marina with dock and boat ramp, fish cleaning station, shuffleboard courts, Pickleball court, dog exercising area, and a recreation clubhouse with a library and exercise room. Lake access to Lake Okeechobee! - Call for your private showing!
Key facts
- Gated community
- Shuffleboard courts
- Marina with dock
Tags
Property features AI
Finance
- Other: Homestead exempt; No waterfront; Road surface: Paved
- Financial info: Total annual fees listed as $2,496
- HOA & community: Has HOA (Association: Jeff Devore); Monthly HOA approximately $208; quarterly fee $624; HOA covers cable TV, sewer, trash and water; Community amenities: Clubhouse, Fitness Center, Pool, Community Mailbox; Additional association amenities: Gated entry, Laundry, Maintenance, Pickleball court(s), Shuffleboard court, Spa/Hot Tub; Senior community; Pets allowed (cats and dogs; number limit)
Exterior
- Parking: Has carport (1 space)
- Utilities: Public water; Public sewer; Cable connected; Electricity connected
- Home design: Manufactured home (single wide); One level; Faces southeast; Residential property
- Construction: Metal siding; Other roof; Crawlspace foundation; Built on a 0.05-acre lot
- Exterior features: Other exterior features; Paved road access
Interior
- Kitchen: Built-in oven
- Bedrooms: 1 bedroom
- Flooring: Carpet
- Bathrooms: 1 full bath
- Heating & cooling: No central heating; Wall/window unit(s) for cooling
- Interior features: Ceiling fan(s); Built-in oven
- Laundry & utility: Laundry: Other
Neighborhood map
What this means for you Summary
Snapshot
- This is a 1-bed/1.0-bath manufactured listed at $40k.
Deal economics
- At list price, monthly cash flow is $-30 ($-357/yr) — negative.
- To cash-flow at today's rent, offer at most $35k (13.2% below list).
- Meets the 1% rule at list price ($1k rent vs $40k).
- Recommended offer: $35k (13.2% below list) — sets the bar for cash-flow.
- Cap rate 18.2% vs local median 4.1% in Taylor Creek — top-decile yield for the area; either an underpriced asset or a hidden risk that comps aren't pricing in. Stress-test before assuming the spread holds.
Location & tenants
- Location reads 56/100 on livability (#874 in FL) — a working-class tenant base; expect higher turnover. Strengths: cost of living A+, housing A+, crime B+; Watch: schools F, amenities F, commute F.
- Okeechobee (town): math 44% / reading 42% proficiency, ranked #58 of 73 in FL (top 80%) — families likely to look elsewhere, expect single-tenant / working-renter base with shorter leases; 72% free/reduced lunch — lower-income household profile, screen leases tightly.
- Market conditions: 402 active listings in the ZIP; 18 units permitted in Okeechobee County in 2024 (0 in 5+ unit buildings).
Forward outlook
- Local home prices are declining (-3.0%/yr); year-one equity from $276 of loan paydown is wiped out by about $1k of value loss. Plan a longer hold.
- Okeechobee County population projected at -21% by 2050 — secular population decline; favor cash flow + early exit over multi-decade hold.
Negotiation context
- It's been on market 256 days — a 12% lower offer ($35k) is reasonable based on typical stale-listing flexibility.
- Current owner paid $11k; list at $40k implies a 263% gain — meaningful room to come down on a strong offer.
Risks & watch-outs
- Watch-outs: flood insurance adds $427/mo.
- Climate carrying-cost: in FEMA flood zone AE (mandatory federal flood insurance); severe wind risk, 99% chance of damaging wind over 30y; extreme-heat days projected 7→25/yr by 2055 (HVAC capex compounding) — expect insurance premiums to compound above CPI over the hold.
Questions for the listing agent
- What do current leases actually rent for vs. the listed asking? Can we see a recent rent roll and the last 12 months of T-12 income?
- It's been on market 256 days. Have you received any prior offers? Is the seller open to a 13% concession, seller financing, or rate buy-down credit?
- What's the actual annual flood-insurance premium (NFIP or private), and is the property in a SFHA with mandatory coverage?
- What does the HOA fee cover, when was the last increase, and are there any pending special assessments or reserve-fund shortfalls?
- Why hasn't it sold? Are there any deal-killer items the seller is aware of (foundation, flood, title, zoning, code violations)?
- Is there a deadline driving the sale (1031 exchange, divorce, estate, relocation)? That informs how much negotiation room exists.
- Schools are F-rated, which usually means shorter tenancies and higher turnover. Who's the typical renter profile here, and what's been the actual vacancy rate?
- What's the average days-on-market for RENTAL listings here right now (not sales)? A rising rental-DOM trend means longer vacancies and softer asking-rent achievability than the comps imply.
- What's the recent tenant-quality profile in this submarket — average credit score on applications, eviction rate, late-payment / NSF rate, and stable-employment percentage? A property-management company in the area should have these aggregated.
- How much new for-sale + rental construction is in the pipeline within 1–3 miles? Heavy new supply typically softens prices + rents 12–24 months out; constrained supply supports both.
Investment metrics
- 1% rule
- 2.72% ✓
- Cap rate
- 18.23%
- Cash-on-cash
- 42.62%
- DSCR
- 2.90
- GRM
- 3.1
CMA / ARV
- ARV (on-the-fly)
- $70,560
- Comps found
- 5
Show comp detail 5 sales within ~0.75 mi
| Address | Dist | Beds/Ba | Sqft | Sold | Price | $/sf | Match |
|---|---|---|---|---|---|---|---|
| 5354 SE 65th Ter | 0.07mi | 1/1.0 | 504 (0%) | 17mo | $75,000 | $149 | 83 |
| 5312 SE 67th Ave | 0.20mi | 1/2.0 | 488 (-3%) | 5mo | $64,500 | $132 | 77 |
| 6649 SE 56th St | 0.10mi | 1/1.0 | 436 (-14%) | 1mo | $85,000 | $195 | 72 |
| 6458 SE 55th Ln | 0.06mi | 1/1.0 | 428 (-15%) | 8mo | $50,000 | $117 | 66 |
| 6531 SE 56th Ln | 0.08mi | 1/1.0 | 430 (-15%) | 11mo | $60,000 | $140 | 63 |
Match score weights: distance 35% · size 25% · config 20% · recency 20%. Top-matched comps best support the ARV.
Projected returns pro-forma
-3.0% appreciation · 3.0% rent growth · sell at horizon
- IRR
- -20.3%
- Equity multiple
- 0.29×
- Total profit
- $-7,967
- Equity at exit
- $5,949
- IRR
- -11.0%
- Equity multiple
- 0.30×
- Total profit
- $-7,782
- Equity at exit
- $3,450
Cash invested: $11,172 (down + closing). Projections, not guarantees.
Landlord ↔ Tenant lean methodology
- Overall (STATE)
- 87 Strongly Landlord-Friendly
- State Florida
- 87 Strongly Landlord-Friendly · R+3
- County
- — inherits STATE
- City
- — inherits STATE
ZIP-level market 34974
- Home prices YoY
- -15.6%
- Active inventory
- 402
- Price-to-rent
- 3.1×
Monthly cashflow live
- Estimated rent
- $1,086 medium interval (Pro) →
- Mortgage (P&I)
- −$209
- Tax from tax record
- −$27 /mo · $328/yr
- Insurance
- −$17
- Flood insurance flood zone
- −$427 /mo · $5,118/yr
- HOA
- −$208
- Vacancy / Maint / Mgmt
- −$228
- Net cashflow
- $-30
Break-even live
UW: 25.0% down · 7.5% · 30yr · 1.5% tax · 5.0% vac · 8.0% maint · 8.0% mgmt
Financing live
Cash to close
- Down payment
- $9,975
- Closing costs
- $1,197
- Reserves months
- —
- Total cash needed
- —
Loan-product check · same deal, 3 products live
Conventional
25% down · 7.5% · 30yr
- Down + closing
- —
- Monthly P&I
- —
- Monthly cashflow
- —
- DSCR
- —
- Eligible?
- —
Personal DTI + credit; lowest rate.
DSCR
20% down · 8.5% · 30yr
- Down + closing
- —
- Monthly P&I
- —
- Monthly cashflow
- —
- DSCR
- —
- Eligible?
- —
No personal income docs; deal must DSCR.
Hard money
10% down · 12.0% · 12mo
- Down + closing
- —
- Monthly P&I
- —
- Monthly cashflow
- —
- DSCR
- —
- Eligible?
- —
Short-term bridge; refi at stabilization.
HOA detail
- Monthly dues
- $208 · $2,496/yr
- Likely covers
- watersewertrashcablepoolsecurity
Listing history 18 events
-
2026-06-19days on market $39,900 Active 256 DOM
-
2026-06-18days on market $39,900 Active 255 DOM
-
2026-06-17days on market $39,900 Active 254 DOM
-
2026-06-16days on market $39,900 Active 253 DOM
-
2026-06-15days on market $39,900 Active 252 DOM
-
2026-06-14days on market $39,900 Active 250 DOM
-
2026-06-10days on market $39,900 Active 247 DOM
-
2026-06-09days on market $39,900 Active 246 DOM
-
2026-06-08days on market $39,900 Active 245 DOM
-
2026-06-07days on market $39,900 Active 244 DOM
-
2026-06-05days on market $39,900 Active 241 DOM
-
2026-06-03days on market $39,900 Active 240 DOM
-
2026-06-02days on market $39,900 Active 239 DOM
-
2026-06-01days on market $39,900 Active 238 DOM
-
2026-05-31days on market $39,900 Active 237 DOM
-
2026-05-30days on market $39,900 Active 236 DOM
-
2025-10-06$39,900 Active
-
1999-10-29soldstatus $11,000
ⓘ Source: listings_history table (triggers on properties + properties_extension) + one-shot
backfill from property_details.listing_events for pre-trigger history.
Tax reassessment forecast FL · Resets to sale price
- Current annual tax
- $328 · $27/mo
- Projected year-2 tax
- $331 · $28/mo
- Expected delta
- +$3/yr ($0/mo · 0.9%)
ⓘ Screening estimate from a state-policy table — verify with the county assessor before closing.
Climate risk First Street
- Flood 4/10 Moderate FEMA zone AE · 21% chance over 30 yrs
- Wildfire 4/10 Moderate
- Heat 9/10 Extreme 7 d/yr ≥107°F today · 25 d/yr by 30 yrs out
- Wind 10/10 Extreme 99% chance of damaging wind over 30 yrs
- Air quality 2/10 Low 1 unhealthy d/yr today · 2 by 30 yrs out
Nearby sold comps map
Loading sold comps map…
Walkable amenities ~0.75 mi
Loading nearby amenities…
Taxation est. · year 1
- Rental income
- $13,033
- − Mortgage interest
- −$2,235
- − Property taxes
- −$328
- − Insurance
- −$5,318
- − Repairs & maintenance
- −$1,043
- − Management
- −$1,043
- − HOA
- −$2,496
- − Depreciation
- −$1,161
- Taxable loss
- −$590
- Est. tax savings @ 24.0%
- +$142
- After-tax cash flow
- $-215/yr
For passive investors: Depreciation is non-cash, so a rental often shows a tax loss while cash-flowing — sheltering income. Rental losses are passive: they offset passive income freely, and up to $25,000/yr can offset ordinary (W-2) income if you actively participate and your MAGI is under $100k (phasing out to $0 by $150k); unused losses carry forward. On sale, claimed depreciation is recaptured at up to 25%, and gains may owe capital-gains tax (a 1031 exchange can defer both). Figures are a year-1 estimate at your 24.0% rate — not tax advice; consult a CPA.
Schools (NCES district)
- District
- Okeechobee
- NCES district ID
- 1201410
- Math proficiency
- 44% ▼ -12.00%
- Reading proficiency
- 42% ▼ -4.00%
- Median HH income
- $36,710
- Composite
- 35.73/100
- National rank
- #4855
- State rank
- #58 of 73 in FL
Livability — Taylor Creek
- Score
- 56/100
- State rank
- #874
- US rank
- #23017
Category grades
Schools grade is shown separately in the Schools card above.
Census & demographics
- County
- Okeechobee County · 23,975 people
- Metro
- Okeechobee, FL
- Population (ZIP)
- 23,975
- Household income
- $53,013
- Rent vs Own
- Severe rent burden
- 399.0
Population outlook (Okeechobee County) Hauer SSP2
- Today (2025)
- 37,273 people
- By 2030
- 35,885 · -3.7%
- By 2040
- 32,931 · -11.6%
- By 2050
- 29,433 · -21.0%
- By 2075
- 19,607 · -47.4%
- By 2100
- 11,814 · -68.3%
Race, ethnicity, and origin ACS 2023
- Neighborhood character
- Predominantly White (74%)
- Race & ethnicity
- White 74% Hispanic / Latino 19% Two or more races 8% Asian 2% Black 2% Native American 1%
- Hispanic origin (detail)
- Mexican 12% Puerto Rican 1% Cuban 2%
- Common ancestry
- Lithuanian 2% Iranian 2% Italian 2%
- Foreign-born
- 11% · Canada, Jamaica
- Languages at home
- 81% English-only · Spanish 16% French/Haitian/Cajun 1% Other Indo-European 1%
Political lean MEDSL · Okeechobee
- 2024 margin
- Solid R (+53.8) · D 22.9% · R 76.7%
- 2008→2024 swing
- -34.6pp toward R · 2008: -19.2pp · 2024: -53.8pp
- All cycles
- 2024: R+53.8 2020: R+44.4 2016: R+39.5 2012: R+20.0 2008: R+19.2
Not yet ingested
- Civics
- —
Market trends
- HPI YoY
- ▼ -64.47%
- Current HPI
- 348.6692
- Rent YoY
- —
- Metro
- Okeechobee, FL
- State GDP YoY
- ▲ 3.28%
- F500 in state
- 36
Industry mix (Fortune 500 HQ in FL)
| Industry | F500 HQs | Revenue |
|---|---|---|
| Industrial Technology | 2 | $29B |
|
||
| Insurance | 2 | $17B |
|
||
| Retail | 1 | $60B |
|
||
| Technology Distribution | 1 | $58B |
|
||
| Homebuilding | 1 | $35B |
|
||
| Technology Manufacturing | 1 | $35B |
|
||
Price history
+262.7% since first listed2 events — show timeline
- 2025-10-06 Listed $39,900 Stellar MLS as Distributed by MLS Grid
- 1999-10-29 Sold (Public Records) $11,000 Public Records
Property tax history
+6.8%/yrLatest (2025): $328 · +6.6% YoY. Source: county tax records.
Cash-flow waterfall
monthlySold comps — $/sqft
last 12 mo · ≤1 miLoading sold comps…