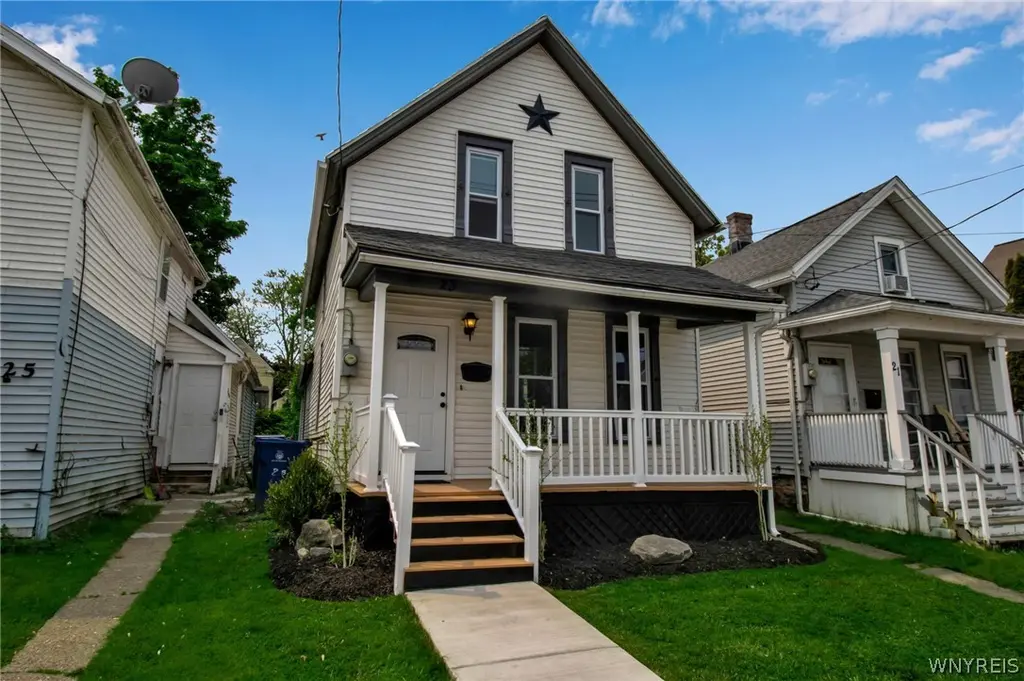
23 Pooley Pl · Buffalo, NY
Flood risk 1/10 · Minimal
- FEMA flood zone
- X (unshaded)
- Chance of flooding over 30 yrs
- 0.0%
- Est. flood insurance / yr
- $507 – $1,088
Fire risk 1/10 · Minimal
- Est. fire insurance / yr
- $691 – $1,283
Heat risk 3/10 · Minor
- Hot days now (above 92°F)
- 7 days/yr
- Hot days in 30 yrs
- 15 days/yr
Wind risk 1/10 · Minimal
- Chance of severe wind over 30 yrs
- —
Air-quality risk 4/10 · Minor
- Unhealthy air days now
- 4 days/yr
- Unhealthy air days in 30 yrs
- 9 days/yr
Risk factors via First Street. Map © Google.
Why this score? — see what drove the B- grade
The composite is a weighted blend of 9 inputs, each scored 0–100. Each bar is that input's sub-score; the figure is the points it added to the 100-point composite (weight × sub-score).
- Cash flow +22.8/30.0
- ARV discount +11.4/15.0
- Appreciation +8.8/10.0
- DSCR +7.3/10.0
- 1% rule +6.0/10.0
- Livability +3.9/5.0
- Schools +3.3/10.0
- Condition / age +2.5/5.0
- Rent growth +2.4/5.0
$144,900
🖨 Deal sheet (PDF) 📄 Offer letter ✓ Due diligence
Listing remarks
Welcome to 23 Pooley Place, a perfectly renovated 3-bedroom, 1-bathroom home offering 1,044 square feet of smartly designed living space in the vibrant West Side of Buffalo, NY. Nestled on a quiet residential street, this home is the perfect mix of comfort, character, and beauty. You are initially greeted with a charming front porch, complete with maintenance free vinyl railings. Upon entering through the new front door, you walk into a sunlit living area boasting all new flooring and a welcoming layout. The updated kitchen features ample cabinet space, new flooring, new granite countertops, just waiting for your personal touches. Whether you’re entertaining or enjoying a quiet night
Key facts
- 3,798 sq ft lot
- Built 1890
- Listed 6 days
Neighborhood map
What this means for you Summary
Snapshot
- This is a 3-bed/1.0-bath single-family listed at $145k.
Deal economics
- At list price, monthly cash flow is $253 ($3k/yr) — positive.
- The deal already cash-flows at list — no discount required.
- Meets the 1% rule at list price ($2k rent vs $145k).
Location & tenants
- Location reads 77/100 on livability (#195 in NY, #3,011 nationally) — a middle-class / working-renter tenant base. Strengths: commute A+, housing A+, health & safety A+; Watch: crime F, employment D-.
- Buffalo City School District (urban): math 41% / reading 40% proficiency, ranked #535 of 590 in NY (top 91%) — families likely to look elsewhere, expect single-tenant / working-renter base with shorter leases; 75% free/reduced lunch — lower-income household profile, screen leases tightly.
- Market conditions: Rents soft (-0.5%/yr); 137 active listings in the ZIP; 40 comparable units currently listed for rent nearby; rentals at typical pace (median 24d on market — plan ~3-4 weeks tenant-placement turnaround); 45% of comp listings sitting > 30 days — soft ceiling on asking rent; 1,244 units permitted in Erie County in 2024 (563 in 5+ unit buildings).
- This rent runs 35% of the median local income ($54k/yr) — at the standard rent-burdened threshold; future hikes will face affordability resistance.
Forward outlook
- In year one you build about $12k of equity ($1k loan paydown + $11k appreciation (7.5% local appreciation)).
- At projected returns (7.5% appreciation + 0.0% rent growth), your $41k cash investment doubles in ~3 years — after that, you're playing with house money.
- By year 4, paydown + projected appreciation supports a ~$41k cash-out refi (75% LTV) — recoverable capital for the next deal without selling this one.
Negotiation context
- Only 6 days on market — expect competitive offers; lowballing is unlikely to land.
- 3 sale attempts with the ask held roughly flat each time — persistent listings suggest the price (not the market) is what's stuck; bring a comps-based counter.
Risks & watch-outs
- Watch-outs: built in 1890 — expect roof / HVAC / electrical / plumbing capex.
Questions for the listing agent
- Built in 1890 — when were the roof, HVAC, electrical panel, plumbing, and water heater last replaced?
- Is there a deadline driving the sale (1031 exchange, divorce, estate, relocation)? That informs how much negotiation room exists.
- Crime grade is F in this area — have there been break-ins, vandalism, or insurance claims at this property in the last 3 years? What carrier currently insures it and at what premium?
- What's the average days-on-market for RENTAL listings here right now (not sales)? A rising rental-DOM trend means longer vacancies and softer asking-rent achievability than the comps imply.
- What's the recent tenant-quality profile in this submarket — average credit score on applications, eviction rate, late-payment / NSF rate, and stable-employment percentage? A property-management company in the area should have these aggregated.
- How much new for-sale + rental construction is in the pipeline within 1–3 miles? Heavy new supply typically softens prices + rents 12–24 months out; constrained supply supports both.
Investment metrics
- 1% rule
- 1.10% ✓
- Cap rate
- 8.39%
- Cash-on-cash
- 7.48%
- DSCR
- 1.33
- GRM
- 7.6
CMA / ARV
- ARV (on-the-fly)
- $158,688
- Comps found
- 11
Show comp detail 11 sales within ~0.75 mi
| Address | Dist | Beds/Ba | Sqft | Sold | Price | $/sf | Match |
|---|---|---|---|---|---|---|---|
| 23 Pooley Pl | 0.00mi | 3/1.0 | 1,044 (0%) | 0mo | $144,900 | $139 | 100 |
| 1069 West Ave | 0.53mi | 3/1.0 | 1,040 (-0%) | 11mo | $150,000 | $144 | 65 |
| 25 Lafayette Ave | 0.51mi | 3/2.0 | 1,009 (-3%) | 5mo | $110,000 | $109 | 62 |
| 12 Pooley Pl | 0.04mi | 4/1.0 (+1) | 1,126 (+8%) | 24mo | $175,000 | $155 | 60 |
| 123 Hawley St | 0.36mi | 3/1.0 | 930 (-11%) | 13mo | $191,000 | $205 | 54 |
| 196 Dewitt St | 0.31mi | 3/1.0 | 1,122 (+8%) | 23mo | $170,000 | $152 | 54 |
| 151 Forest Ave | 0.06mi | 4/2.0 (+1) | 1,176 (+13%) | 20mo | $230,000 | $196 | 50 |
| 74 Baynes St | 0.73mi | 4/2.0 (+1) | 1,075 (+3%) | 4mo | $195,925 | $182 | 49 |
| 369 Parkdale Ave | 0.33mi | 3/1.5 | 1,144 (+10%) | 22mo | $138,000 | $121 | 48 |
| 532 Bird Ave | 0.73mi | 3/1.0 | 1,161 (+11%) | 9mo | $289,900 | $250 | 40 |
| 9 Congress St | 0.60mi | 4/1.0 (+1) | 1,200 (+15%) | 8mo | $130,000 | $108 | 36 |
Match score weights: distance 35% · size 25% · config 20% · recency 20%. Top-matched comps best support the ARV.
Projected returns pro-forma
7.51% appreciation · 0.0% rent growth · sell at horizon
- IRR
- 23.4%
- Equity multiple
- 2.64×
- Total profit
- $66,671
- Equity at exit
- $105,309
- IRR
- 20.5%
- Equity multiple
- 5.26×
- Total profit
- $172,974
- Equity at exit
- $204,641
Cash invested: $40,572 (down + closing). Projections, not guarantees.
Landlord ↔ Tenant lean methodology
- Overall (STATE)
- 15 Strongly Tenant-Friendly
- State New York
- 15 Strongly Tenant-Friendly · D+10
- County
- — inherits STATE
- City
- — inherits STATE
ZIP-level market 14213
- Home prices YoY
- 1.7%
- Rents YoY
- -0.5%
- Active inventory
- 137
- Price-to-rent
- 7.6×
Monthly cashflow live
- Estimated rent
- $1,587 high interval (Pro) →
- Mortgage (P&I)
- −$760
- Tax est. 1.5%
- −$181 /mo · $2,174/yr
- Insurance
- −$60
- HOA
- −$0
- Vacancy / Maint / Mgmt
- −$333
- Net cashflow
- $253
Break-even live
Sensitivity live
| Price | -10% $353 | -5% $303 | +0% $253 | +5% $203 | +10% $153 |
|---|---|---|---|---|---|
| Rent | -10% $127 | -5% $190 | +0% $253 | +5% $315 | +10% $378 |
| Rate | -1.0pp $326 | -0.5pp $290 | base $253 | +0.5pp $215 | +1.0pp $177 |
UW: 25.0% down · 7.5% · 30yr · 1.5% tax · 5.0% vac · 8.0% maint · 8.0% mgmt
Financing live
Cash to close
- Down payment
- $36,225
- Closing costs
- $4,347
- Reserves months
- —
- Total cash needed
- —
Loan-product check · same deal, 3 products live
Conventional
25% down · 7.5% · 30yr
- Down + closing
- —
- Monthly P&I
- —
- Monthly cashflow
- —
- DSCR
- —
- Eligible?
- —
Personal DTI + credit; lowest rate.
DSCR
20% down · 8.5% · 30yr
- Down + closing
- —
- Monthly P&I
- —
- Monthly cashflow
- —
- DSCR
- —
- Eligible?
- —
No personal income docs; deal must DSCR.
Hard money
10% down · 12.0% · 12mo
- Down + closing
- —
- Monthly P&I
- —
- Monthly cashflow
- —
- DSCR
- —
- Eligible?
- —
Short-term bridge; refi at stabilization.
Rent comps 40 comps
| Address | Beds | Baths | Sqft | Rent | $/sqft | DOM | Units | Dist |
|---|---|---|---|---|---|---|---|---|
| 100 Forest Ave Buffalo, NY | 2.0–4.0 | 2.0–4.0 | 1304 | $1,600 | $1.23 | 2d | 14 | 0.13mi |
| 46 Hawley St #1 Buffalo, NY | 2.0 | 1.0 | 900 | $1,300 | $1.44 | 44d | 1 | 0.18mi |
| 185 Potomac Ave Buffalo, NY | 2.0 | 1.0 | 1200 | $1,300 | $1.08 | 24d | 1 | 0.22mi |
| 232 Dewitt St Buffalo, NY | 3.0 | 1.0 | 1200 | $1,300 | $1.08 | 24d | 1 | 0.28mi |
| 1485 Niagara St Buffalo, NY | 1.0–2.0 | 1.0 | 925 | $2,174 | $2.35 | 2d | 1 | 0.29mi |
| 305 Bird Ave Unit 3 Buffalo, NY | 3.0 | 1.5 | 1128 | $2,300 | $2.04 | 44d | 1 | 0.29mi |
| 309 Bird Ave Unit 1 Buffalo, NY | 3.0 | 1.0 | 1100 | $2,200 | $2.00 | 44d | 1 | 0.29mi |
| 163 W Delavan Ave Buffalo, NY | 3.0 | 1.0 | 1000 | $1,500 | $1.50 | 24d | 1 | 0.36mi |
| 311 Herkimer St #1 Buffalo, NY | 3.0 | 1.0 | 1272 | $1,400 | $1.10 | 15d | 1 | 0.39mi |
| 374 Baynes St Buffalo, NY | 3.0 | 1.0 | 1126 | $1,550 | $1.38 | 44d | 1 | 0.41mi |
| 57 Abbottsford Pl Buffalo, NY | 2.0 | 1.0 | 1000 | $1,550 | $1.55 | 24d | 1 | 0.49mi |
| 37 Abbottsford Pl Buffalo, NY | 3.0 | 1.0 | 1130 | $1,650 | $1.46 | 44d | 1 | 0.50mi |
| 1360 Niagara St Buffalo, NY | 1.0–2.0 | 1.0–2.0 | 1252 | $2,396 | $1.91 | 2d | 2 | 0.50mi |
| 257 Lafayette Ave Unit 317 Buffalo, NY | 2.0 | 1.0 | 897 | $1,400 | $1.56 | 24d | 1 | 0.54mi |
| 257 Lafayette Ave Apt 319 Buffalo, NY | 2.0 | 1.0 | 900 | $1,395 | $1.55 | 24d | 1 | 0.55mi |
| 196 Auburn Ave Buffalo, NY | 3.0 | 1.0 | 1000 | $1,300 | $1.30 | 44d | 1 | 0.57mi |
| 891 Richmond Ave Buffalo, NY | 3.0 | 1.0 | 1176 | $1,800 | $1.53 | 44d | 1 | 0.63mi |
| 865 Richmond Ave Unit Rear Buffalo, NY | 2.0 | 1.0 | 850 | $1,100 | $1.29 | 44d | 1 | 0.63mi |
| 478 Breckenridge St Buffalo, NY | 3.0 | 1.0 | 1100 | $1,575 | $1.43 | 44d | 1 | 0.82mi |
| 117 Bidwell Pkwy Unit 3 Buffalo, NY | 2.0 | 1.0 | 1192 | $1,500 | $1.26 | 3d | 1 | 0.84mi |
| 1015 Elmwood Ave Unit 3 Buffalo, NY | 2.0 | 2.0 | 1000 | $1,400 | $1.40 | 44d | 1 | 0.84mi |
| 67 Herkimer St Buffalo, NY | 3.0 | 1.0 | 1000 | $1,300 | $1.30 | 15d | 1 | 0.86mi |
| 62 Germain St Buffalo, NY | 3.0 | 1.0 | 1320 | $1,250 | $0.95 | 24d | 1 | 0.86mi |
| 411 W Ferry St Buffalo, NY | 2.0 | 1.0 | 900 | $1,100 | $1.22 | 15d | 1 | 0.88mi |
| 375 Hampshire St Buffalo, NY | 3.0 | 1.0 | 1200 | $1,100 | $0.92 | 44d | 1 | 0.89mi |
| 68 Peter St Buffalo, NY | 2.0 | 1.0 | 900 | $900 | $1.00 | 24d | 1 | 0.90mi |
| 310 Hampshire St Apt 3 Buffalo, NY | 3.0 | 1.0 | 1200 | $1,500 | $1.25 | 44d | 1 | 0.91mi |
| 484 Ashland Ave Unit 9 Buffalo, NY | 2.0 | 1.0 | 800 | $1,250 | $1.56 | 24d | 1 | 0.94mi |
| 77 California St Unit 1 Buffalo, NY | 2.0 | 1.0 | 800 | $1,100 | $1.38 | 44d | 1 | 0.94mi |
| 155 Germain St Apt 1 Buffalo, NY | 2.0 | 1.0 | 1000 | $1,000 | $1.00 | 11d | 1 | 1.02mi |
| 664 Auburn Ave Unit 2 Buffalo, NY | 2.0 | 1.0 | 900 | $2,200 | $2.44 | 44d | 1 | 1.03mi |
| 685 Auburn Ave Unit 2 Buffalo, NY | 3.0 | 1.0 | 1200 | $1,750 | $1.46 | 15d | 1 | 1.08mi |
| 685 Auburn Ave Buffalo, NY | 2.0 | 1.0 | 1200 | $1,600 | $1.33 | 45d | 1 | 1.08mi |
| 72 Reservation St Unit 2 Buffalo, NY | 3.0 | 1.0 | 950 | $1,150 | $1.21 | 24d | 1 | 1.08mi |
| 460 Rhode Island St Buffalo, NY | 2.0 | 1.0 | 1089 | $1,500 | $1.38 | 15d | 1 | 1.10mi |
| 1558 Elmwood Ave Unit 4 Buffalo, NY | 2.0 | 1.0 | 800 | $1,100 | $1.38 | 44d | 1 | 1.10mi |
| 139 Fordham Dr Buffalo, NY | 3.0 | 1.0 | 1453 | $1,700 | $1.17 | 24d | 1 | 1.13mi |
| 2099 Niagara St Unit A Buffalo, NY | 2.0 | 1.0 | 1000 | $1,197 | $1.20 | 44d | 1 | 1.19mi |
| 293 Grote St Buffalo, NY | 1.0–2.0 | 1.0–2.0 | 817 | $2,345 | $2.87 | 2d | 1 | 1.22mi |
| 75 Inwood Pl Unit Lower Buffalo, NY | 2.0 | 1.0 | 1175 | $1,550 | $1.32 | 44d | 1 | 1.24mi |
Listing history 11 events
-
2026-04-08status Pending
-
2026-04-01price $144,900
-
2026-04-01$149,900 Active
-
2025-11-24historical
-
2025-10-30price $149,900
-
2025-09-18status Active
-
2025-09-12status Pending
-
2025-09-03price $154,900
-
2025-08-05price $159,900
-
2025-06-24price $169,900
-
2025-06-05$189,900 Active
ⓘ Source: listings_history table (triggers on properties + properties_extension) + one-shot
backfill from property_details.listing_events for pre-trigger history.
Climate risk First Street
- Flood 1/10 Low FEMA zone X (unshaded) · 0% chance over 30 yrs
- Wildfire 1/10 Low
- Heat 3/10 Moderate 7 d/yr ≥92°F today · 15 d/yr by 30 yrs out
- Wind 1/10 Low
- Air quality 4/10 Moderate 4 unhealthy d/yr today · 9 by 30 yrs out
Nearby sold comps map
Loading sold comps map…
Walkable amenities ~0.75 mi
Loading nearby amenities…
Taxation est. · year 1
- Rental income
- $19,050
- − Mortgage interest
- −$8,117
- − Property taxes
- −$2,174
- − Insurance
- −$724
- − Repairs & maintenance
- −$1,524
- − Management
- −$1,524
- − Depreciation
- −$4,215
- Taxable income
- $772
- Est. tax owed @ 24.0%
- −$185
- After-tax cash flow
- $2,848/yr
For passive investors: Depreciation is non-cash, so a rental often shows a tax loss while cash-flowing — sheltering income. Rental losses are passive: they offset passive income freely, and up to $25,000/yr can offset ordinary (W-2) income if you actively participate and your MAGI is under $100k (phasing out to $0 by $150k); unused losses carry forward. On sale, claimed depreciation is recaptured at up to 25%, and gains may owe capital-gains tax (a 1031 exchange can defer both). Figures are a year-1 estimate at your 24.0% rate — not tax advice; consult a CPA.
Schools (NCES district)
- District
- Buffalo City School District
- NCES district ID
- 3605850
- Math proficiency
- 41% ▲ 11.00%
- Reading proficiency
- 40% ▲ 7.00%
- Median HH income
- $31,665
- Composite
- 33.17/100
- National rank
- #5544
- State rank
- #535 of 590 in NY
Livability — Buffalo
- Score
- 77/100
- State rank
- #195
- US rank
- #3011
Category grades
Schools grade is shown separately in the Schools card above.
Census & demographics
- Census place
- Buffalo, NY
- County
- Erie County · 714,559 people
- City population
- 440,021
- Metro
- Buffalo-Cheektowaga, NY
- Population (ZIP)
- 24,107
- Household income
- $53,870
- Rent vs Own
- Severe rent burden
- 1501.0
Population outlook (Erie County) Hauer SSP2
- Today (2025)
- 933,037 people
- By 2030
- 935,181 · +0.2%
- By 2040
- 928,531 · -0.5%
- By 2050
- 905,725 · -2.9%
- By 2075
- 834,037 · -10.6%
- By 2100
- 708,033 · -24.1%
Race, ethnicity, and origin ACS 2023
- Neighborhood character
- Highly diverse neighborhood (Simpson 0.70)
- Race & ethnicity
- White 46% Hispanic / Latino 20% Black 18% Asian 12% Two or more races 10%
- Hispanic origin (detail)
- Mexican 1% Puerto Rican 16% Dominican 1%
- Common ancestry
- Romanian 6% Slovak 3% Lithuanian 3%
- Foreign-born
- 16% · Philippines, Canada, India
- Languages at home
- 68% English-only · Spanish 12% Other Asian/Pacific 7% Arabic 3%
Political lean MEDSL · Erie
- 2024 margin
- Lean D (+9.7) · D 54.8% · R 45.2%
- 2008→2024 swing
- -7.9pp toward R · 2008: 17.5pp · 2024: 9.7pp
- All cycles
- 2024: D+9.7 2020: D+14.7 2016: D+4.8 2012: D+15.6 2008: D+17.5
Not yet ingested
- Civics
- —
Market trends
- HPI YoY
- ▲ 7.51%
- Current HPI
- 448.4879
- Rent YoY
- ▼ -0.49%
- Metro
- Buffalo-Cheektowaga, NY
- State GDP YoY
- ▲ 2.60%
- F500 in state
- 92
Industry mix (Fortune 500 HQ in NY)
| Industry | F500 HQs | Revenue |
|---|---|---|
| Financial Services | 10 | $950B |
|
||
| Consumer Goods | 9 | $162B |
|
||
| Insurance | 4 | $225B |
|
||
| Telecommunications | 2 | $144B |
|
||
| Pharmaceuticals | 2 | $112B |
|
||
| Media / Entertainment | 2 | $69B |
|
||
Price history
-23.7% since first listed11 events — show timeline
- 2026-04-08 Pending — WNYREIS
- 2026-04-01 Price Changed $144,900 WNYREIS
- 2026-04-01 Listed $149,900 WNYREIS
- 2025-11-24 Listing Removed — WNYREIS
- 2025-10-30 Price Changed $149,900 WNYREIS
- 2025-09-18 Relisted — WNYREIS
- 2025-09-12 Pending — WNYREIS
- 2025-09-03 Price Changed $154,900 WNYREIS
- 2025-08-05 Price Changed $159,900 WNYREIS
- 2025-06-24 Price Changed $169,900 WNYREIS
- 2025-06-05 Listed $189,900 WNYREIS
Property tax history
+7.0%/yrLatest (2025): $286 · +0.0% YoY. Source: county tax records.
Cash-flow waterfall
monthlySold comps — $/sqft
last 12 mo · ≤1 miLoading sold comps…