33-52 Crescent St Unit 4C · New York, NY
Flood risk 1/10 · Minimal
- FEMA flood zone
- X (unshaded)
- Chance of flooding over 30 yrs
- 0.0%
- Est. flood insurance / yr
- $507 – $1,088
Fire risk 1/10 · Minimal
- Est. fire insurance / yr
- $691 – $1,283
Heat risk 6/10 · Moderate
- Hot days now (above 99°F)
- 7 days/yr
- Hot days in 30 yrs
- 15 days/yr
Wind risk 6/10 · Moderate
- Chance of severe wind over 30 yrs
- 27.0%
Air-quality risk 4/10 · Minor
- Unhealthy air days now
- 5 days/yr
- Unhealthy air days in 30 yrs
- 6 days/yr
Risk factors via First Street. Map © Google.
Why this score? — see what drove the C grade
The composite is a weighted blend of 9 inputs, each scored 0–100. Each bar is that input's sub-score; the figure is the points it added to the 100-point composite (weight × sub-score).
- Cash flow +19.4/30.0
- ARV discount +7.5/15.0
- DSCR +6.1/10.0
- Appreciation +6.0/10.0
- 1% rule +5.2/10.0
- Schools +5.0/10.0
- Rent growth +4.3/5.0
- Livability +3.8/5.0
- Condition / age +2.5/5.0
$549,000
🖨 Deal sheet 📄 Offer letter ✓ Due diligence
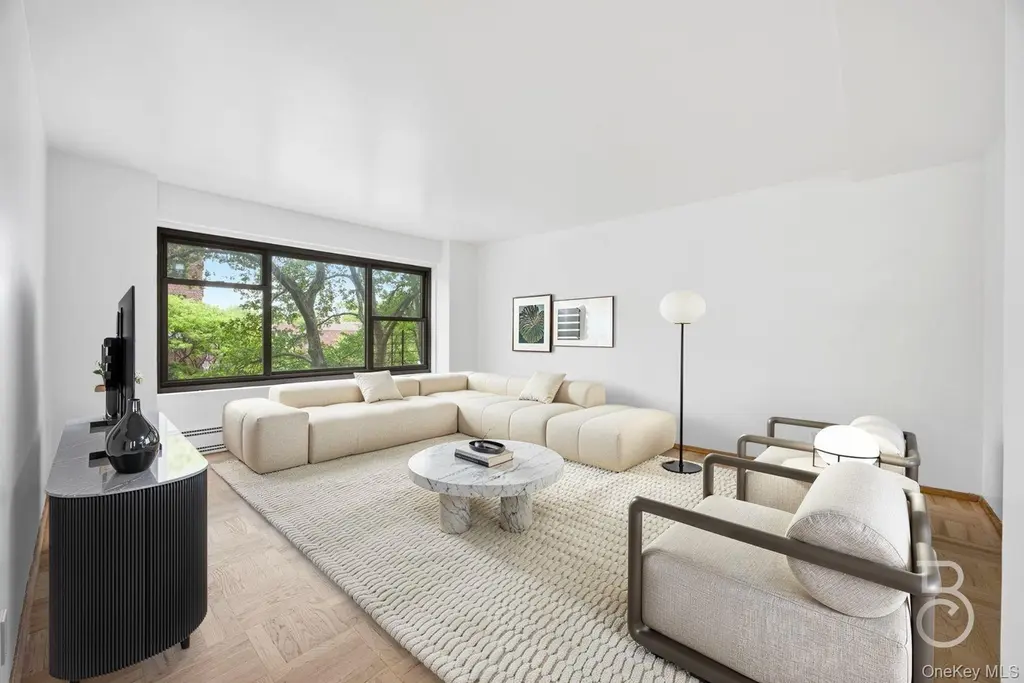
Listing remarks
Spacious and filled with natural light, this two-bedroom home is located on Crescent Street, just a short walk to the subway. Set away from the street and surrounded by the complex’s mature trees, the home offers a quiet, residential feel in the heart of Astoria. Beautifully refinished hardwood floors run throughout the apartment, which features a large living room, a spacious kitchen with ample workspace and room for a dining area, and two king-sized bedrooms. The windowed kitchen features butcher block countertops and modern slate-gray ceramic tile flooring, creating a clean and functional space with great natural light. Located within Queensview, one of Astoria’s most desirab
Key facts
- Laundry facilities
- Windowed kitchen
- Built 1950
Tags
Property features AI
Finance
- HOA & community: Association: Queensview; Monthly association fee; Association covers heat and hot water; Association amenities include parking, playground, and security
Exterior
- Parking: Off-street parking in a parking lot (unassigned); Parking fee applies
- Security: Community security
- Utilities: Public sewer; Cable connected; Electricity connected; Phone connected; Sewer connected; Trash collection (public); Water connected
- Home design: Stock cooperative; One level; Located on the 4th floor; 15-story building
- Construction: Brick construction
- Exterior features: Playground; Outdoor space
Interior
- Kitchen: Dishwasher; Range; Refrigerator
- Bedrooms: Located on entry level 4
- Flooring: Wood floors
- Bathrooms: 1 full bathroom
- Heating & cooling: Oil heating; Wall/window air conditioning units
- Interior features: Entrance foyer; Galley kitchen; Walk-in closet(s); Bicycle room; Outdoor space
- Laundry & utility: Common area laundry
Neighborhood map
What this means for you Summary
Snapshot
- This is a 2-bed/1.0-bath condo listed at $549k.
Deal economics
- At list price, monthly cash flow is $611 ($7k/yr) — positive.
- The deal already cash-flows at list — no discount required.
- Meets the 1% rule at list price ($6k rent vs $549k).
- Recommended offer: $541k (1.5% below list) — sets the bar for market timing.
- Cap rate 7.6% vs local median 2.6% in New York — top-decile yield for the area; either an underpriced asset or a hidden risk that comps aren't pricing in. Stress-test before assuming the spread holds.
Location & tenants
- Location reads 75/100 on livability (#268 in NY, #4,188 nationally) — a middle-class / working-renter tenant base. Strengths: amenities A+, commute A+, health & safety A; Watch: crime F, cost of living F.
- Market conditions: Rents rising fast (+7.3%/yr); 106 active listings in the ZIP; 28 comparable units currently listed for rent nearby; rentals at typical pace (median 22d on market — plan ~3-4 weeks tenant-placement turnaround); solid renter incomes; 5,302 units permitted in Queens County in 2024 (4,918 in 5+ unit buildings).
- At $5,575/mo this rent would consume 79% of the median local household income ($85k/yr) (locally 3679% of renters already pay >50% of income on rent) — very limited rent-growth headroom before tenants either downsize or default.
Forward outlook
- In year one you build about $15k of equity ($4k loan paydown + $11k appreciation (2.1% local appreciation)).
- Queens County population projected at +16% by 2050 — long-run rental-demand tailwind backs the buy-and-hold thesis.
- At projected returns (2.1% appreciation + 7.3% rent growth), your $154k cash investment doubles in ~5 years — after that, you're playing with house money.
- By year 3, paydown + projected appreciation supports a ~$38k cash-out refi (75% LTV) — recoverable capital for the next deal without selling this one.
Negotiation context
- It's been on market 15 days — a 2% lower offer ($541k) is reasonable based on typical stale-listing flexibility.
Risks & watch-outs
- Watch-outs: built in 1950 — expect roof / HVAC / electrical / plumbing capex.
- Climate carrying-cost: major wind risk, 27% chance of damaging wind over 30y; extreme-heat days projected 7→15/yr by 2055 (HVAC capex compounding) — expect insurance premiums to compound above CPI over the hold.
Questions for the listing agent
- Built in 1950 — when were the roof, HVAC, electrical panel, plumbing, and water heater last replaced?
- Any open or pending special assessments — roof, HVAC, plumbing, elevator, façade? What's the per-unit balance and payoff schedule, and is the seller paying it off at close or rolling it to the buyer?
- Is there a deadline driving the sale (1031 exchange, divorce, estate, relocation)? That informs how much negotiation room exists.
- Schools are B-rated — typically a magnet for longer-tenancy family renters. What's the average tenant stay here, and is there a school-zone premium baked into asking?
- Crime grade is F in this area — have there been break-ins, vandalism, or insurance claims at this property in the last 3 years? What carrier currently insures it and at what premium?
- What's the average days-on-market for RENTAL listings here right now (not sales)? A rising rental-DOM trend means longer vacancies and softer asking-rent achievability than the comps imply.
- What's the recent tenant-quality profile in this submarket — average credit score on applications, eviction rate, late-payment / NSF rate, and stable-employment percentage? A property-management company in the area should have these aggregated.
- How much new apartment / multifamily construction is in the pipeline within 1–3 miles? Heavy new supply (>2% of stock underway) typically softens rents 12–24 months out; light construction supports rent growth.
Investment metrics
- 1% rule
- 1.02% ✓
- Cap rate
- 7.63%
- Cash-on-cash
- 4.77%
- DSCR
- 1.21
- GRM
- 8.2
CMA / ARV
No comps found within radius.
Projected returns pro-forma
2.06% appreciation · 7.28% rent growth · sell at horizon
- IRR
- 12.1%
- Equity multiple
- 1.67×
- Total profit
- $103,449
- Equity at exit
- $218,451
- IRR
- 17.3%
- Equity multiple
- 3.56×
- Total profit
- $393,419
- Equity at exit
- $316,047
Cash invested: $153,720 (down + closing). Projections, not guarantees.
Landlord ↔ Tenant lean methodology
- Overall (CITY)
- 0 Strongly Tenant-Friendly
- State New York
- 15 Strongly Tenant-Friendly · D+10
- County
- — inherits STATE
- City New York
- 0 Strongly Tenant-Friendly · D+34
ZIP-level market 11106
- Home prices YoY
- 0.6%
- Rents YoY
- 7.3%
- Active inventory
- 106
- Price-to-rent
- 8.2×
Monthly cashflow live
- Estimated rent
- $5,575 high interval (Pro) →
- Mortgage (P&I)
- −$2,879
- Tax est. 1.5%
- −$686 /mo · $8,235/yr
- Insurance
- −$229
- HOA
- −$0
- Vacancy / Maint / Mgmt
- −$1,171
- Net cashflow
- $611
Break-even live
UW: 25.0% down · 7.5% · 30yr · 1.5% tax · 5.0% vac · 8.0% maint · 8.0% mgmt
Financing live
Cash to close
- Down payment
- $137,250
- Closing costs
- $16,470
- Reserves months
- —
- Total cash needed
- —
Loan-product check · same deal, 3 products live
Conventional
25% down · 7.5% · 30yr
- Down + closing
- —
- Monthly P&I
- —
- Monthly cashflow
- —
- DSCR
- —
- Eligible?
- —
Personal DTI + credit; lowest rate.
DSCR
20% down · 8.5% · 30yr
- Down + closing
- —
- Monthly P&I
- —
- Monthly cashflow
- —
- DSCR
- —
- Eligible?
- —
No personal income docs; deal must DSCR.
Hard money
10% down · 12.0% · 12mo
- Down + closing
- —
- Monthly P&I
- —
- Monthly cashflow
- —
- DSCR
- —
- Eligible?
- —
Short-term bridge; refi at stabilization.
Rent comps 28 comps
| Address | Beds | Baths | Sqft | Rent | $/sqft | DOM | Units | Dist |
|---|---|---|---|---|---|---|---|---|
| 3705 30th St Long Island City, NY | 2.0 | 1.0–2.0 | 700 | $6,180 | $8.83 | 10d | 3 | 0.50mi |
| 1420 27th Ave Astoria, NY | 1.0–2.0 | 1.0–2.0 | 887 | $4,899 | $5.52 | 3d | 9 | 0.75mi |
| 34-35 44th St Astoria, NY | 1.0–2.0 | 1.0–2.0 | 613 | $5,794 | $9.45 | 2d | 26 | 0.82mi |
| 888 Main St New York, NY | 1.0–3.0 | 1.0–2.0 | 963 | $5,903 | $6.13 | 6d | 7 | 0.87mi |
| 2719 44th Dr Long Island City, NY | 1.0 | 1.0 | 628 | $4,945 | $7.87 | 8d | 2 | 1.22mi |
| 3 Court Sq W #907 Long Island City, NY | 2.0 | 2.0 | 930 | $6,300 | $6.77 | 24d | 1 | 1.24mi |
| 515 E 72nd St Unit 17D New York, NY | 1.0 | 1.0 | 687 | $5,500 | $8.01 | 24d | 1 | 1.24mi |
| 501 1/2 E 83rd St #1998 New York, NY | 2.0 | 1.0 | 525 | $5,580 | $10.63 | 24d | 2 | 1.25mi |
| 501 E 74th St #1572 New York, NY | 2.0 | 2.0 | 1000 | $10,210 | $10.21 | 21d | 1 | 1.26mi |
| 435 E 79th St New York, NY | 1.0–3.0 | 1.0–2.0 | 943 | $7,500 | $7.95 | 8d | 3 | 1.28mi |
| 515 E 86th St Unit 589 New York, NY | 1.0 | 1.0 | 695 | $6,070 | $8.73 | 20d | 1 | 1.29mi |
| 1567 York Ave Unit 1021866P New York, NY | 2.0 | 1.0 | 742 | $5,910 | $7.96 | 22d | 1 | 1.29mi |
| 420 E 80th St #198 New York, NY | 1.0 | 1.0 | 623 | $4,760 | $7.64 | 18d | 1 | 1.31mi |
| 501 E 87th St #2094 New York, NY | 1.0 | 1.0 | 618 | $7,890 | $12.77 | 2d | 2 | 1.32mi |
| 885 Main St Unit 6B New York, NY | 2.0 | 2.0 | 950 | $5,320 | $5.60 | 12d | 1 | 1.36mi |
| 885 Main St #705 New York, NY | 2.0 | 2.0 | 1100 | $4,950 | $4.50 | 24d | 1 | 1.36mi |
| 404 E 76th St Unit 19C New York, NY | 2.0 | 2.0 | 1100 | $7,500 | $6.82 | 24d | 1 | 1.37mi |
| 404 E 76th St New York, NY | 1.0–2.0 | 1.0–2.0 | 1001 | $7,500 | $7.49 | 4d | 2 | 1.38mi |
| 435 E 86th St Unit 2001 New York, NY | 1.0 | 1.0 | 800 | $5,480 | $6.85 | 24d | 1 | 1.39mi |
| 1373 1st Ave Unit 1952 New York, NY | 2.0 | 2.0 | 650 | $7,260 | $11.17 | 24d | 1 | 1.41mi |
| 403 E 69th St #1518 New York, NY | 1.0–3.0 | 1.0 | 745 | $6,748 | $9.06 | 24d | 3 | 1.43mi |
| 347 E 78th St Unit 1460467P New York, NY | 2.0 | 1.0 | 645 | $7,606 | $11.79 | 24d | 1 | 1.43mi |
| 347 E 78th St Unit 1530420P New York, NY | 2.0 | 1.0 | 645 | $6,270 | $9.72 | 22d | 1 | 1.43mi |
| 411 E 68th St Unit 1021976P New York, NY | 2.0 | 1.0 | 893 | $6,792 | $7.61 | 22d | 1 | 1.44mi |
| 1290 1st Ave #1499 New York, NY | 2.0 | 1.0 | 671 | $6,100 | $9.09 | 3d | 2 | 1.45mi |
| 315 E 78th St Unit 1021894P New York, NY | 1.0 | 1.0 | 548 | $5,643 | $10.30 | 22d | 1 | 1.48mi |
| 308 E 78th St #2024 New York, NY | 1.0–2.0 | 1.0 | 550 | $5,340 | $9.71 | 24d | 2 | 1.49mi |
| 301 E 79th St Unit 28P New York, NY | 1.0 | 1.0 | 700 | $5,500 | $7.86 | 24d | 1 | 1.50mi |
HOA detail condo
- Monthly dues
- $0 · $0/yr
- Assessments
- None detected in remarks — confirm with the listing agent.
Listing history 10 events
-
2026-06-18days on market $549,000 Active 15 DOM
-
2026-06-17days on market $549,000 Active 14 DOM
-
2026-06-16days on market $549,000 Active 13 DOM
-
2026-06-15days on market $549,000 Active 12 DOM
-
2026-06-13days on market $549,000 Active 10 DOM
-
2026-06-09days on market $549,000 Active 6 DOM
-
2026-06-08days on market $549,000 Active 5 DOM
-
2026-06-07days on market $549,000 Active 4 DOM
-
2026-06-04remarks 687-char remark
-
2026-06-04$549,000 Active 1 DOM
ⓘ Source: listings_history table (triggers on properties + properties_extension) + one-shot
backfill from property_details.listing_events for pre-trigger history.
Climate risk First Street
- Flood 1/10 Low FEMA zone X (unshaded) · 0% chance over 30 yrs
- Wildfire 1/10 Low
- Heat 6/10 Major 7 d/yr ≥99°F today · 15 d/yr by 30 yrs out
- Wind 6/10 Major 27% chance of damaging wind over 30 yrs
- Air quality 4/10 Moderate 5 unhealthy d/yr today · 6 by 30 yrs out
Nearby sold comps map
Loading sold comps map…
Walkable amenities ~0.75 mi
Loading nearby amenities…
Taxation est. · year 1
- Rental income
- $66,905
- − Mortgage interest
- −$30,753
- − Property taxes
- −$8,235
- − Insurance
- −$2,745
- − Repairs & maintenance
- −$5,352
- − Management
- −$5,352
- − Depreciation
- −$15,971
- Taxable loss
- −$1,504
- Est. tax savings @ 24.0%
- +$361
- After-tax cash flow
- $7,687/yr
For passive investors: Depreciation is non-cash, so a rental often shows a tax loss while cash-flowing — sheltering income. Rental losses are passive: they offset passive income freely, and up to $25,000/yr can offset ordinary (W-2) income if you actively participate and your MAGI is under $100k (phasing out to $0 by $150k); unused losses carry forward. On sale, claimed depreciation is recaptured at up to 25%, and gains may owe capital-gains tax (a 1031 exchange can defer both). Figures are a year-1 estimate at your 24.0% rate — not tax advice; consult a CPA.
Schools (NCES district)
No district data.
Livability — New York
- Score
- 75/100
- State rank
- #268
- US rank
- #4188
Category grades
Schools grade is shown separately in the Schools card above.
Census & demographics
- Census place
- New York, NY
- County
- Queens County · 1,914,869 people
- City population
- 7,731,280
- Metro
- New York-Newark-Jersey City, NY-NJ-PA
- Population (ZIP)
- 40,930
- Household income
- $84,867
- Rent vs Own
- Severe rent burden
- 3679.0
Population outlook (Queens County) Hauer SSP2
- Today (2025)
- 2,546,320 people
- By 2030
- 2,643,059 · +3.8%
- By 2040
- 2,815,563 · +10.6%
- By 2050
- 2,944,423 · +15.6%
- By 2075
- 3,123,338 · +22.7%
- By 2100
- 3,098,688 · +21.7%
Race, ethnicity, and origin ACS 2023
- Neighborhood character
- Highly diverse neighborhood (Simpson 0.71)
- Race & ethnicity
- White 42% Hispanic / Latino 27% Asian 19% Two or more races 12% Black 7% Native American 1%
- Hispanic origin (detail)
- Mexican 7% Puerto Rican 6% Dominican 4%
- Common ancestry
- Scotch-Irish 3% Romanian 3% Estonian 2%
- Foreign-born
- 39% · Canada, Jamaica, China
- Languages at home
- 48% English-only · Spanish 22% Other Indo-European 13% Russian/Polish/Slavic 4%
Political lean MEDSL · Queens
- 2024 margin
- Strong D (+24.6) · D 62.3% · R 37.7%
- 2008→2024 swing
- -26.2pp toward R · 2008: 50.8pp · 2024: 24.6pp
- All cycles
- 2024: D+24.6 2020: D+45.2 2016: D+53.4 2012: D+58.5 2008: D+50.8
Not yet ingested
- Civics
- —
Market trends
- HPI YoY
- ▲ 2.06%
- Current HPI
- 348.3009
- Rent YoY
- ▲ 7.28%
- Metro
- New York-Newark-Jersey City, NY-NJ-PA
- State GDP YoY
- ▲ 2.60%
- F500 in state
- 92
Industry mix (Fortune 500 HQ in NY)
| Industry | F500 HQs | Revenue |
|---|---|---|
| Financial Services | 10 | $950B |
|
||
| Consumer Goods | 9 | $162B |
|
||
| Insurance | 4 | $225B |
|
||
| Telecommunications | 2 | $144B |
|
||
| Pharmaceuticals | 2 | $112B |
|
||
| Media / Entertainment | 2 | $69B |
|
||
Price history
1 event — show timeline
- 2026-06-03 Listed $549,000 OneKey® MLS as Distributed by MLS Grid
Cash-flow waterfall
monthlySold comps — $/sqft
last 12 mo · ≤1 miLoading sold comps…