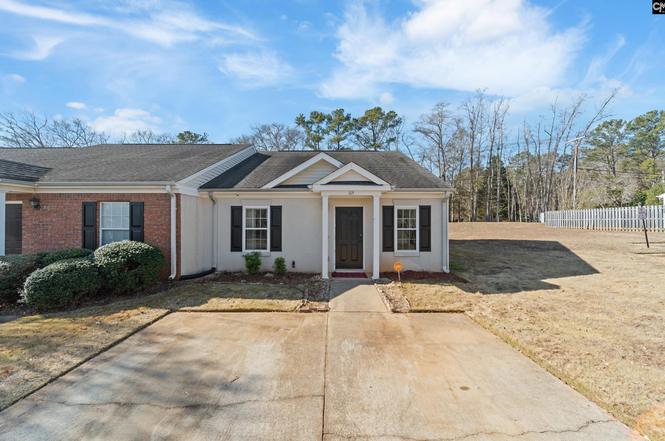
115 Bennock Mill Ct · Lexington, SC
Flood risk 1/10 · Minimal
- FEMA flood zone
- X (unshaded)
- Chance of flooding over 30 yrs
- 0.0%
- Est. flood insurance / yr
- $507 – $1,088
Fire risk 3/10 · Minor
- Est. fire insurance / yr
- $783 – $1,453
Heat risk 7/10 · Major
- Hot days now (above 107°F)
- 7 days/yr
- Hot days in 30 yrs
- 16 days/yr
Wind risk 6/10 · Moderate
- Chance of severe wind over 30 yrs
- 62.0%
Air-quality risk 3/10 · Minor
- Unhealthy air days now
- 2 days/yr
- Unhealthy air days in 30 yrs
- 2 days/yr
Risk factors via First Street. Map © Google.
Why this score? — see what drove the D grade
The composite is a weighted blend of 9 inputs, each scored 0–100. Each bar is that input's sub-score; the figure is the points it added to the 100-point composite (weight × sub-score).
- Cash flow +11.7/30.0
- ARV discount +9.2/15.0
- Schools +4.2/10.0
- Livability +4.0/5.0
- DSCR +3.4/10.0
- Rent growth +3.3/5.0
- 1% rule +2.6/10.0
- Condition / age +2.5/5.0
- Appreciation +0.0/10.0
$189,000
🖨 Deal sheet (PDF) 📄 Offer letter ✓ Due diligence
Listing remarks
Perfectly positioned in the heart of Lexington and just minutes from downtown and the sparkling waters of Lake Murray, this beautifully designed corner-lot townhome offers the rare combination of privacy, charm, and effortless living. Set beside the neighborhood mailboxes, the home enjoys extra open space and an airy, set-apart feel; something rarely found in townhome communities. Step inside to an inviting open-concept living area where natural light and thoughtful design create a warm, welcoming atmosphere. The cozy fireplace anchors the space, making it ideal for relaxed evenings, quiet mornings, or entertaining friends with ease. The seamless flow between the living, dining, and kitchen
Key facts
- Covered back patio
- Cozy fireplace
- Wood privacy fence
Tags
Property features AI
Finance
- HOA & community: Property is in an association
Exterior
- Utilities: Public water; Public sewer
- Home design: Stucco and vinyl exterior
- Construction: Slab foundation
- Exterior features: Full gutters; Covered back porch; Rear wood fencing
Interior
- Kitchen: Tile floor; Painted cabinets; Non-standard countertops; Microwave (above stove); Dishwasher; Garbage disposal; Free-standing smooth-surface range
- Bedrooms: Master bedroom on main level with private bath, walk-in closet and ceiling fan; Second bedroom with shared bath, ceiling fan and private closet
- Flooring: Laminate flooring in bedrooms and great room; Tile flooring in kitchen
- Bathrooms: Two full bathrooms
- Heating & cooling: Central heating; Central air
- Interior features: Fireplace in great room; Vaulted ceilings; Recessed lighting
Neighborhood map
What this means for you Summary
Snapshot
- This is a 2-bed/2.0-bath townhouse listed at $189k.
Deal economics
- At list price, monthly cash flow is $-55 ($-664/yr) — negative.
- To cash-flow at today's rent, offer at most $179k (5.2% below list).
- To meet the 1% rule (rent ≥ 1% of price), the offer needs to be $143k (24.1% below list).
- Recommended offer: $143k (24.1% below list) — sets the bar for 1% rule.
Location & tenants
- Location reads 81/100 on livability (#8 in SC, #1,502 nationally) — a professional / high-income tenant draw. Strengths: housing A+, health & safety A+, employment A; Watch: commute F.
- Lexington 01 (suburban): math 42% / reading 53% proficiency, ranked #11 of 80 in SC (top 14%) — families likely to look elsewhere, expect single-tenant / working-renter base with shorter leases.
- Zoned schools: New Providence Elementary (math 66% / reading 66%, grade B+, #52 of 597 statewide, top 9%, 803 students, 13% FRL); River Bluff High (math 54% / reading 93%, grade B+, #43 of 196 statewide, top 22%, 2,197 students, 19% FRL).
- Zoned-school proficiency averages 70% at this address vs 48% district-wide (+22 pts) — the actual schools serving this property are materially stronger than the Lexington 01 average implies; a family-tenant draw the district grade alone would hide.
- Market conditions: Rents rising (+3.2%/yr); 694 active listings in the ZIP; 5 comparable units currently listed for rent nearby; rentals at typical pace (median 16d on market — plan ~3-4 weeks tenant-placement turnaround); solid renter incomes; 1,712 units permitted in Lexington County in 2024 (0 in 5+ unit buildings).
- This rent is only 16% of the median local income ($106k/yr) — well below the 30% rent-burden line; pricing power to push rent on renewal without tenant pushback.
Forward outlook
- Local home prices are declining (-3.0%/yr); year-one equity from $1k of loan paydown is wiped out by about $6k of value loss. Plan a longer hold.
- Lexington County population projected at +26% by 2050 — long-run rental-demand tailwind backs the buy-and-hold thesis.
Negotiation context
- It's been on market 132 days — a 12% lower offer ($166k) is reasonable based on typical stale-listing flexibility.
- 3 sale attempts since 6y ago; this cycle's ask has dropped $16k (8%) from the opening price — seller is motivated, your offer sets the floor, not the list.
- Current owner paid $127k; 49% above their basis — modest negotiation headroom, anchor on the comps not their cost.
Risks & watch-outs
- Climate carrying-cost: major wind risk, 62% chance of damaging wind over 30y; extreme-heat days projected 7→16/yr by 2055 (HVAC capex compounding) — expect insurance premiums to compound above CPI over the hold.
Questions for the listing agent
- What do current leases actually rent for vs. the listed asking? Can we see a recent rent roll and the last 12 months of T-12 income?
- It's been on market 132 days. Have you received any prior offers? Is the seller open to a 24% concession, seller financing, or rate buy-down credit?
- What does the HOA fee cover, when was the last increase, and are there any pending special assessments or reserve-fund shortfalls?
- Why hasn't it sold? Are there any deal-killer items the seller is aware of (foundation, flood, title, zoning, code violations)?
- Is there a deadline driving the sale (1031 exchange, divorce, estate, relocation)? That informs how much negotiation room exists.
- Schools are B-rated — typically a magnet for longer-tenancy family renters. What's the average tenant stay here, and is there a school-zone premium baked into asking?
- The area grade is low — what's the realistic commute time and amenity access for the typical tenant pool here? Any planned neighborhood developments (good or bad) we should know about?
- What's the average days-on-market for RENTAL listings here right now (not sales)? A rising rental-DOM trend means longer vacancies and softer asking-rent achievability than the comps imply.
- What's the recent tenant-quality profile in this submarket — average credit score on applications, eviction rate, late-payment / NSF rate, and stable-employment percentage? A property-management company in the area should have these aggregated.
- How much new for-sale + rental construction is in the pipeline within 1–3 miles? Heavy new supply typically softens prices + rents 12–24 months out; constrained supply supports both.
Investment metrics
- 1% rule
- 0.76% ✗
- Cap rate
- 5.94%
- Cash-on-cash
- -1.26%
- DSCR
- 0.94
- GRM
- 11.0
CMA / ARV
- ARV (on-the-fly)
- $196,560
- Comps found
- 1
Show comp detail 1 sale within ~0.75 mi
| Address | Dist | Beds/Ba | Sqft | Sold | Price | $/sf | Match |
|---|---|---|---|---|---|---|---|
| 130 Weatherstone Rd #130 | 0.53mi | 2/2.0 | 1,040 (-5%) | 15mo | $187,000 | $180 | 55 |
Match score weights: distance 35% · size 25% · config 20% · recency 20%. Top-matched comps best support the ARV.
Projected returns pro-forma
-3.0% appreciation · 3.23% rent growth · sell at horizon
- IRR
- -18.2%
- Equity multiple
- 0.36×
- Total profit
- $-33,870
- Equity at exit
- $28,181
- IRR
- -10.1%
- Equity multiple
- 0.38×
- Total profit
- $-32,868
- Equity at exit
- $16,341
Cash invested: $52,920 (down + closing). Projections, not guarantees.
Landlord ↔ Tenant lean methodology
- Overall (STATE)
- 90 Strongly Landlord-Friendly
- State South Carolina
- 90 Strongly Landlord-Friendly · R+6
- County
- — inherits STATE
- City
- — inherits STATE
ZIP-level market 29072
- Rents YoY
- 3.2%
- Active inventory
- 694
- Price-to-rent
- 11.0×
Monthly cashflow live
- Estimated rent
- $1,434 high interval (Pro) →
- Mortgage (P&I)
- −$991
- Tax from tax record
- −$74 /mo · $891/yr
- Insurance
- −$79
- HOA
- −$44
- Vacancy / Maint / Mgmt
- −$301
- Net cashflow
- $-55
Break-even live
Sensitivity live
| Price | -10% $52 | -5% $-2 | +0% $-55 | +5% $-109 | +10% $-162 |
|---|---|---|---|---|---|
| Rent | -10% $-169 | -5% $-112 | +0% $-55 | +5% $1 | +10% $58 |
| Rate | -1.0pp $40 | -0.5pp $-7 | base $-55 | +0.5pp $-104 | +1.0pp $-154 |
UW: 25.0% down · 7.5% · 30yr · 1.5% tax · 5.0% vac · 8.0% maint · 8.0% mgmt
Financing live
Cash to close
- Down payment
- $47,250
- Closing costs
- $5,670
- Reserves months
- —
- Total cash needed
- —
Loan-product check · same deal, 3 products live
Conventional
25% down · 7.5% · 30yr
- Down + closing
- —
- Monthly P&I
- —
- Monthly cashflow
- —
- DSCR
- —
- Eligible?
- —
Personal DTI + credit; lowest rate.
DSCR
20% down · 8.5% · 30yr
- Down + closing
- —
- Monthly P&I
- —
- Monthly cashflow
- —
- DSCR
- —
- Eligible?
- —
No personal income docs; deal must DSCR.
Hard money
10% down · 12.0% · 12mo
- Down + closing
- —
- Monthly P&I
- —
- Monthly cashflow
- —
- DSCR
- —
- Eligible?
- —
Short-term bridge; refi at stabilization.
Rent comps 5 comps
| Address | Beds | Baths | Sqft | Rent | $/sqft | DOM | Units | Dist |
|---|---|---|---|---|---|---|---|---|
| 2000 Water Oak Dr Unit 4B 1 Lexington, SC | 2.0 | 2.0 | 1100 | $1,599 | $1.45 | 15d | 1 | 0.98mi |
| 121 Northpoint Dr Lexington, SC | 1.0–2.0 | 1.0–2.0 | 973 | $1,560 | $1.60 | 4d | 13 | 0.98mi |
| 313 W Main St Unit F Lexington, SC | 2.0 | 1.5 | 1150 | $1,295 | $1.13 | 24d | 1 | 1.06mi |
| 510 Conway Dr Lexington, SC | 2.0 | 2.0 | 1056 | $1,050 | $0.99 | 4d | 1 | 1.07mi |
| 106 Rogers Ct Unit D Lexington, SC | 2.0 | 1.5 | 1100 | $1,295 | $1.18 | 15d | 1 | 1.19mi |
HOA detail
- Monthly dues
- $44 · $528/yr
- Likely covers
- water
Listing history 21 events
-
2026-06-18days on market $189,000 Active 132 DOM
-
2026-06-17days on market $189,000 Active 131 DOM
-
2026-06-16days on market $189,000 Active 130 DOM
-
2026-06-15days on market $189,000 Active 129 DOM
-
2026-06-14days on market $189,000 Active 127 DOM
-
2026-06-10days on market $189,000 Active 124 DOM
-
2026-06-09days on market $189,000 Active 123 DOM
-
2026-06-08days on market $189,000 Active 122 DOM
-
2026-06-07days on market $189,000 Active 121 DOM
-
2026-06-03days on market $189,000 Active 117 DOM
-
2026-06-03days on market $189,000 Active 116 DOM
-
2026-06-02days on market $189,000 Active 115 DOM
-
2026-05-31days on market $189,000 Active 114 DOM
-
2026-05-01price $191,000
-
2026-03-07price $199,000
-
2026-02-06$204,900 Active
-
2026-01-09$204,900 Active
-
2021-01-19soldstatus $126,900
-
2020-11-22historical
-
2020-11-19$123,900 Active
-
2008-05-07soldstatus $24,250
ⓘ Source: listings_history table (triggers on properties + properties_extension) + one-shot
backfill from property_details.listing_events for pre-trigger history.
Tax reassessment forecast SC · Resets to sale price
- Current annual tax
- $891 · $74/mo
- Projected year-2 tax
- $1,077 · $90/mo
- Expected delta
- +$186/yr (+$16/mo · 20.9%)
ⓘ Screening estimate from a state-policy table — verify with the county assessor before closing.
Climate risk First Street
- Flood 1/10 Low FEMA zone X (unshaded) · 0% chance over 30 yrs
- Wildfire 3/10 Moderate
- Heat 7/10 Severe 7 d/yr ≥107°F today · 16 d/yr by 30 yrs out
- Wind 6/10 Major 62% chance of damaging wind over 30 yrs
- Air quality 3/10 Moderate 2 unhealthy d/yr today · 2 by 30 yrs out
Nearby sold comps map
Loading sold comps map…
Walkable amenities ~0.75 mi
Loading nearby amenities…
Taxation est. · year 1
- Rental income
- $17,207
- − Mortgage interest
- −$10,587
- − Property taxes
- −$891
- − Insurance
- −$945
- − Repairs & maintenance
- −$1,377
- − Management
- −$1,377
- − HOA
- −$528
- − Depreciation
- −$5,498
- Taxable loss
- −$3,995
- Est. tax savings @ 24.0%
- +$959
- After-tax cash flow
- $295/yr
For passive investors: Depreciation is non-cash, so a rental often shows a tax loss while cash-flowing — sheltering income. Rental losses are passive: they offset passive income freely, and up to $25,000/yr can offset ordinary (W-2) income if you actively participate and your MAGI is under $100k (phasing out to $0 by $150k); unused losses carry forward. On sale, claimed depreciation is recaptured at up to 25%, and gains may owe capital-gains tax (a 1031 exchange can defer both). Figures are a year-1 estimate at your 24.0% rate — not tax advice; consult a CPA.
Schools (NCES district)
- District
- Lexington 01
- NCES district ID
- 4502700
- Math proficiency
- 42% ▼ -12.00%
- Reading proficiency
- 53% ▼ -2.00%
- Median HH income
- $61,298
- Composite
- 41.75/100
- National rank
- #3399
- State rank
- #11 of 80 in SC
Livability — Lexington
- Score
- 81/100
- State rank
- #8
- US rank
- #1502
Category grades
Schools grade is shown separately in the Schools card above.
Census & demographics
- Census place
- Lexington, SC
- County
- Lexington County · 232,571 people
- City population
- 122,563
- Metro
- Columbia, SC
- Population (ZIP)
- 69,407
- Household income
- $106,382
- Rent vs Own
- Severe rent burden
- 858.0
Population outlook (Lexington County) Hauer SSP2
- Today (2025)
- 322,999 people
- By 2030
- 342,356 · +6.0%
- By 2040
- 377,715 · +16.9%
- By 2050
- 406,984 · +26.0%
- By 2075
- 465,447 · +44.1%
- By 2100
- 485,674 · +50.4%
Race, ethnicity, and origin ACS 2023
- Neighborhood character
- Predominantly White (80%)
- Race & ethnicity
- White 80% Black 7% Hispanic / Latino 5% Two or more races 5% Asian 4%
- Hispanic origin (detail)
- Mexican 1%
- Common ancestry
- Italian 4% Serbian 3% Romanian 3%
- Foreign-born
- 7% · Canada, Jamaica, China
- Languages at home
- 91% English-only · Spanish 4% Other Indo-European 1% Other Asian/Pacific 1%
Political lean MEDSL · Lexington
- 2024 margin
- Solid R (+33.5) · D 32.5% · R 66.0% · Other 1.4%
- 2008→2024 swing
- +4.6pp toward D · 2008: -38.0pp · 2024: -33.5pp
- All cycles
- 2024: R+33.5 2020: R+30.1 2016: R+36.7 2012: R+37.8 2008: R+38.0
Not yet ingested
- Civics
- —
Market trends
- HPI YoY
- ▼ -197.53%
- Current HPI
- 212.3235
- Rent YoY
- ▲ 3.23%
- Metro
- Columbia, SC
- State GDP YoY
- ▲ 4.51%
- F500 in state
- 2
Industry mix (Fortune 500 HQ in SC)
| Industry | F500 HQs | Revenue |
|---|---|---|
| Packaging | 1 | $7B |
|
||
Price history
+687.6% since first listed8 events — show timeline
- 2026-05-01 Price Changed $191,000 Consolidated MLS
- 2026-03-07 Price Changed $199,000 Consolidated MLS
- 2026-02-06 Listed $204,900 Consolidated MLS
- 2026-01-09 Listed $204,900 Consolidated MLS
- 2021-01-19 Sold (Public Records) $126,900 Public Records
- 2020-11-22 Delisted — Consolidated MLS
- 2020-11-19 Listed $123,900 Consolidated MLS
- 2008-05-07 Sold (Public Records) $24,250 Public Records
Property tax history
-7.5%/yrLatest (2024): $891 · +3.8% YoY. Source: county tax records.
Cash-flow waterfall
monthlySold comps — $/sqft
last 12 mo · ≤1 miLoading sold comps…