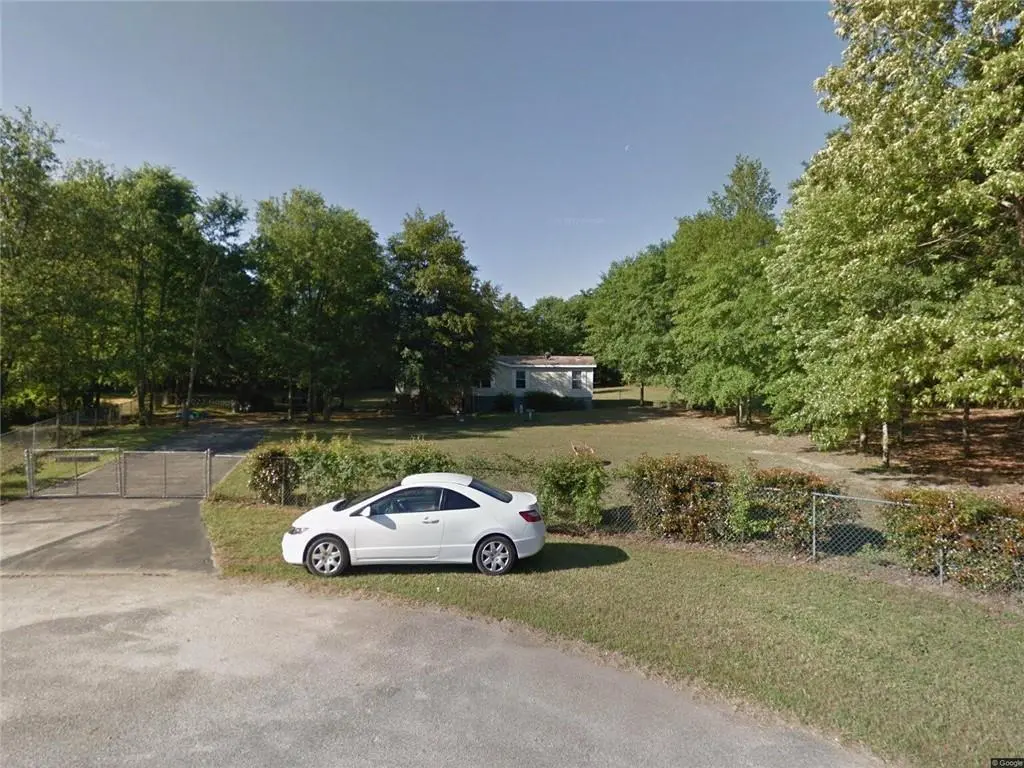
516 Beacham Ct W · Macon-Bibb County, GA
Flood risk 1/10 · Minimal
- FEMA flood zone
- X (unshaded)
- Chance of flooding over 30 yrs
- 0.0%
- Est. flood insurance / yr
- $507 – $1,088
Fire risk 4/10 · Minor
- Est. fire insurance / yr
- $963 – $1,789
Heat risk 7/10 · Major
- Hot days now (above 108°F)
- 7 days/yr
- Hot days in 30 yrs
- 18 days/yr
Wind risk 6/10 · Moderate
- Chance of severe wind over 30 yrs
- 68.0%
Air-quality risk 3/10 · Minor
- Unhealthy air days now
- 3 days/yr
- Unhealthy air days in 30 yrs
- 3 days/yr
Risk factors via First Street. Map © Google.
Why this score? — see what drove the B- grade
The composite is a weighted blend of 9 inputs, each scored 0–100. Each bar is that input's sub-score; the figure is the points it added to the 100-point composite (weight × sub-score).
- Cash flow +30.0/30.0
- 1% rule +10.0/10.0
- DSCR +10.0/10.0
- ARV discount +7.5/15.0
- Livability +2.5/5.0
- Condition / age +2.5/5.0
- Rent growth +1.9/5.0
- Schools +1.2/10.0
- Appreciation +0.0/10.0
$125,000
🖨 Deal sheet (PDF) 📄 Offer letter ✓ Due diligence
Listing remarks
Built in 1998. Manufactured home on large lot featuring 3 beds/2 baths. NO SELLER DISCLOURES. Sold as is. Bring all offers.
Key facts
- 0.82 acre lot
- Built 1998
- Listed 27 days
Property features AI
Exterior
- Parking: Driveway parking; Open parking available
- Utilities: Public water; Public sewer; 110 volt electric; Cable available; Electricity available; Natural gas available; Phone available; Sewer available; Water available
- Home design: Double wide mobile home; One level; Resale property
- Construction: Vinyl siding; Shingle roof
- Exterior features: Chain link fencing; Asphalt road frontage on a city street; Directions: please use GPS
Interior
- Kitchen: Appliances: other (details not specified)
- Bedrooms: Three main-level bedrooms; Bedroom features: none specified
- Flooring: Hardwood flooring
- Bathrooms: Two full bathrooms (both on the main level); Master bathroom: none specified
- Heating & cooling: Heating: other (details not specified); Cooling: other (details not specified)
- Interior features: One fireplace located in the living room; Crawl space basement; No common walls; Other interior features
- Laundry & utility: Laundry located on the main level
Neighborhood map
What this means for you Summary
Snapshot
- This is a 3-bed/2.0-bath manufactured listed at $125k.
Deal economics
- At list price, monthly cash flow is $764 ($9k/yr) — positive.
- The deal already cash-flows at list — no discount required.
- Meets the 1% rule at list price ($2k rent vs $125k).
- Recommended offer: $123k (1.5% below list) — sets the bar for market timing.
- Cap rate 13.6% vs local median 5.5% in Macon-Bibb County — top-decile yield for the area; either an underpriced asset or a hidden risk that comps aren't pricing in. Stress-test before assuming the spread holds.
Location & tenants
- Location reads: area grade B — affects rentability + tenant quality, not the cash-flow math above.
- Bibb County (urban): math 11% / reading 18% proficiency, ranked #161 of 174 in GA (top 92%) — low school quality limits family demand, transient renter base, plan for 1-2y turnover; 75% free/reduced lunch — lower-income household profile, screen leases tightly.
- Zoned schools: Porter Elementary School (math 12% / reading 22%, grade F, #936 of 1,228 statewide, top 79%, 406 students, 100% FRL); Rutland Middle School (math 12% / reading 28%, grade F, #349 of 470 statewide, top 75%, 812 students, 100% FRL); Rutland High School (math 2% / reading 8%, grade F, #394 of 424 statewide, top 97%, 907 students, 100% FRL) — zoned schools average 100% FRL vs 75% district-wide (25 pts higher); higher-poverty schools than district average — tighter screening recommended.
- Market conditions: Rents soft (-2.3%/yr); 194 active listings in the ZIP; 2 comparable units currently listed for rent nearby; 154 units permitted in Bibb County in 2024 (0 in 5+ unit buildings).
- This rent runs 32% of the median local income ($72k/yr) — at the standard rent-burdened threshold; future hikes will face affordability resistance.
Forward outlook
- Local home prices are declining (-3.0%/yr); year-one equity from $864 of loan paydown is wiped out by about $4k of value loss. Plan a longer hold.
- Bibb County population projected at -12% by 2050 — secular population decline; favor cash flow + early exit over multi-decade hold.
- At projected returns (-3.0% appreciation + 0.0% rent growth), your $35k cash investment doubles in ~6 years — after that, you're playing with house money.
Negotiation context
- It's been on market 28 days — a 2% lower offer ($123k) is reasonable based on typical stale-listing flexibility.
- 4 sale attempts since 3y ago with the ask held roughly flat each time — persistent listings suggest the price (not the market) is what's stuck; bring a comps-based counter.
- Current owner paid $18k; list at $125k implies a 598% gain — meaningful room to come down on a strong offer.
Risks & watch-outs
- Climate carrying-cost: major wind risk, 68% chance of damaging wind over 30y; extreme-heat days projected 7→18/yr by 2055 (HVAC capex compounding) — expect insurance premiums to compound above CPI over the hold.
Questions for the listing agent
- Is there a deadline driving the sale (1031 exchange, divorce, estate, relocation)? That informs how much negotiation room exists.
- What's the average days-on-market for RENTAL listings here right now (not sales)? A rising rental-DOM trend means longer vacancies and softer asking-rent achievability than the comps imply.
- What's the recent tenant-quality profile in this submarket — average credit score on applications, eviction rate, late-payment / NSF rate, and stable-employment percentage? A property-management company in the area should have these aggregated.
- How much new for-sale + rental construction is in the pipeline within 1–3 miles? Heavy new supply typically softens prices + rents 12–24 months out; constrained supply supports both.
Investment metrics
- 1% rule
- 1.53% ✓
- Cap rate
- 13.63%
- Cash-on-cash
- 26.21%
- DSCR
- 2.17
- GRM
- 5.4
CMA / ARV
No comps found within radius.
Projected returns pro-forma
-3.0% appreciation · 0.0% rent growth · sell at horizon
- IRR
- 16.7%
- Equity multiple
- 1.65×
- Total profit
- $22,781
- Equity at exit
- $18,638
- IRR
- 23.2%
- Equity multiple
- 2.73×
- Total profit
- $60,686
- Equity at exit
- $10,808
Cash invested: $35,000 (down + closing). Projections, not guarantees.
Landlord ↔ Tenant lean methodology
- Overall (STATE)
- 90 Strongly Landlord-Friendly
- State Georgia
- 90 Strongly Landlord-Friendly · R+3
- County
- — inherits STATE
- City
- — inherits STATE
ZIP-level market 31216
- Rents YoY
- -2.3%
- Active inventory
- 194
- Price-to-rent
- 5.4×
Monthly cashflow live
- Estimated rent
- $1,913 medium interval (Pro) →
- Mortgage (P&I)
- −$656
- Tax from tax record
- −$39 /mo · $474/yr
- Insurance
- −$52
- HOA
- −$0
- Vacancy / Maint / Mgmt
- −$402
- Net cashflow
- $764
Break-even live
Sensitivity live
| Price | -10% $835 | -5% $800 | +0% $764 | +5% $729 | +10% $694 |
|---|---|---|---|---|---|
| Rent | -10% $613 | -5% $689 | +0% $764 | +5% $840 | +10% $916 |
| Rate | -1.0pp $827 | -0.5pp $796 | base $764 | +0.5pp $732 | +1.0pp $699 |
UW: 25.0% down · 7.5% · 30yr · 1.5% tax · 5.0% vac · 8.0% maint · 8.0% mgmt
Financing live
Cash to close
- Down payment
- $31,250
- Closing costs
- $3,750
- Reserves months
- —
- Total cash needed
- —
Loan-product check · same deal, 3 products live
Conventional
25% down · 7.5% · 30yr
- Down + closing
- —
- Monthly P&I
- —
- Monthly cashflow
- —
- DSCR
- —
- Eligible?
- —
Personal DTI + credit; lowest rate.
DSCR
20% down · 8.5% · 30yr
- Down + closing
- —
- Monthly P&I
- —
- Monthly cashflow
- —
- DSCR
- —
- Eligible?
- —
No personal income docs; deal must DSCR.
Hard money
10% down · 12.0% · 12mo
- Down + closing
- —
- Monthly P&I
- —
- Monthly cashflow
- —
- DSCR
- —
- Eligible?
- —
Short-term bridge; refi at stabilization.
Rent comps 2 comps
| Address | Beds | Baths | Sqft | Rent | $/sqft | DOM | Units | Dist |
|---|---|---|---|---|---|---|---|---|
| 334 Amanda Dr Macon, GA | 3.0 | 2.5 | 2316 | $2,265 | $0.98 | 22d | 1 | 0.82mi |
| 3478 Bridgewood Dr Macon, GA | 3.0 | 2.5 | 1915 | $2,095 | $1.09 | 45d | 1 | 1.29mi |
Listing history 26 events
-
2026-06-21days on market $125,000 Active 28 DOM
-
2026-06-19days on market $125,000 Active 26 DOM
-
2026-06-18days on market $125,000 Active 25 DOM
-
2026-06-17days on market $125,000 Active 24 DOM
-
2026-06-16days on market $125,000 Active 23 DOM
-
2026-06-15days on market $125,000 Active 22 DOM
-
2026-06-14days on market $125,000 Active 20 DOM
-
2026-06-13days on market $125,000 Active 19 DOM
-
2026-06-10days on market $125,000 Active 17 DOM
-
2026-06-09days on market $125,000 Active 16 DOM
-
2026-06-08days on market $125,000 Active 15 DOM
-
2026-06-07days on market $125,000 Active 14 DOM
-
2026-06-03days on market $125,000 Active 10 DOM
-
2026-06-02days on market $125,000 Active 9 DOM
-
2026-06-01days on market $125,000 Active 8 DOM
-
2026-05-31days on market $125,000 Active 7 DOM
-
2026-05-30days on market $125,000 Active 6 DOM
-
2026-05-22$125,000 Active
-
2023-12-18historical
-
2023-10-23price $91,999
-
2023-09-25$99,999 New
-
2023-09-19historical
-
2023-09-06status Back On Market
-
2023-07-12status Under Contract
-
2023-05-26$109,000 New
-
1999-03-09soldstatus $17,900
ⓘ Source: listings_history table (triggers on properties + properties_extension) + one-shot
backfill from property_details.listing_events for pre-trigger history.
Tax reassessment forecast GA · Resets to sale price
- Current annual tax
- $474 · $39/mo
- Projected year-2 tax
- $1,150 · $96/mo
- Expected delta
- +$676/yr (+$56/mo · 142.8%)
ⓘ Screening estimate from a state-policy table — verify with the county assessor before closing.
Climate risk First Street
- Flood 1/10 Low FEMA zone X (unshaded) · 0% chance over 30 yrs
- Wildfire 4/10 Moderate
- Heat 7/10 Severe 7 d/yr ≥108°F today · 18 d/yr by 30 yrs out
- Wind 6/10 Major 68% chance of damaging wind over 30 yrs
- Air quality 3/10 Moderate 3 unhealthy d/yr today · 3 by 30 yrs out
Nearby sold comps map
Loading sold comps map…
Walkable amenities ~0.75 mi
Loading nearby amenities…
Taxation est. · year 1
- Rental income
- $22,959
- − Mortgage interest
- −$7,002
- − Property taxes
- −$474
- − Insurance
- −$625
- − Repairs & maintenance
- −$1,837
- − Management
- −$1,837
- − Depreciation
- −$3,636
- Taxable income
- $7,549
- Est. tax owed @ 24.0%
- −$1,812
- After-tax cash flow
- $7,361/yr
For passive investors: Depreciation is non-cash, so a rental often shows a tax loss while cash-flowing — sheltering income. Rental losses are passive: they offset passive income freely, and up to $25,000/yr can offset ordinary (W-2) income if you actively participate and your MAGI is under $100k (phasing out to $0 by $150k); unused losses carry forward. On sale, claimed depreciation is recaptured at up to 25%, and gains may owe capital-gains tax (a 1031 exchange can defer both). Figures are a year-1 estimate at your 24.0% rate — not tax advice; consult a CPA.
Schools (NCES district)
- District
- Bibb County
- NCES district ID
- 1300420
- Math proficiency
- 11% ▼ -14.00%
- Reading proficiency
- 18% ▼ -11.00%
- Median HH income
- $37,426
- Composite
- 12.13/100
- National rank
- #9654
- State rank
- #161 of 174 in GA
Livability — Macon-Bibb County
No livability data for this city. (Only ~50 U.S. cities are tracked.)
Census & demographics
- Census place
- Macon-Bibb County, GA
- County
- Bibb County · 164,332 people
- City population
- 143,186
- Metro
- Macon-Bibb County, GA
- Population (ZIP)
- 16,328
- Household income
- $72,452
- Rent vs Own
- Severe rent burden
- 161.0
Population outlook (Bibb County) Hauer SSP2
- Today (2025)
- 148,772 people
- By 2030
- 145,904 · -1.9%
- By 2040
- 139,404 · -6.3%
- By 2050
- 131,603 · -11.5%
- By 2075
- 111,050 · -25.4%
- By 2100
- 83,346 · -44.0%
Race, ethnicity, and origin ACS 2023
- Neighborhood character
- Diverse neighborhood (Simpson 0.56)
- Race & ethnicity
- White 56% Black 35% Hispanic / Latino 4% Two or more races 3% Asian 1%
- Common ancestry
- Serbian 2% Lithuanian 2% Italian 1%
- Foreign-born
- 3% · South Korea, Canada
- Languages at home
- 97% English-only · Spanish 2% Korean 1%
Political lean MEDSL · Bibb
- 2024 margin
- Strong D (+22.4) · D 61.0% · R 38.5%
- 2008→2024 swing
- +4.4pp toward D · 2008: 18.0pp · 2024: 22.4pp
- All cycles
- 2024: D+22.4 2020: D+23.8 2016: D+20.2 2012: D+20.0 2008: D+18.0
Not yet ingested
- Civics
- —
Market trends
- HPI YoY
- ▼ -135.37%
- Current HPI
- 211.3565
- Rent YoY
- ▼ -2.31%
- Metro
- Macon-Bibb County, GA
- State GDP YoY
- ▲ 2.66%
- F500 in state
- 28
Industry mix (Fortune 500 HQ in GA)
| Industry | F500 HQs | Revenue |
|---|---|---|
| Paper / Packaging | 2 | $29B |
|
||
| Retail | 1 | $160B |
|
||
| Transportation / Logistics | 1 | $91B |
|
||
| Airlines | 1 | $62B |
|
||
| Consumer Goods | 1 | $47B |
|
||
| Utilities | 1 | $25B |
|
||
Price history
+598.3% since first listed9 events — show timeline
- 2026-05-22 Listed $125,000 FMLS
- 2023-12-18 Listing Removed — GAMLS
- 2023-10-23 Price Changed $91,999 GAMLS
- 2023-09-25 Listed $99,999 GAMLS
- 2023-09-19 Listing Removed — GAMLS
- 2023-09-06 Relisted — GAMLS
- 2023-07-12 Pending — GAMLS
- 2023-05-26 Listed $109,000 GAMLS
- 1999-03-09 Sold (Public Records) $17,900 Public Records
Property tax history
+4.6%/yrLatest (2025): $474 · -18.2% YoY. Source: county tax records.
Cash-flow waterfall
monthlySold comps — $/sqft
last 12 mo · ≤1 miLoading sold comps…