 🏗️ New Construction
2152 Salinas Dr · Iowa Colony, TX
Flood risk 1/10 · Minimal
- FEMA flood zone
- X (unshaded)
- Chance of flooding over 30 yrs
- 0.0%
- Est. flood insurance / yr
- $507 – $1,088
Fire risk 6/10 · Moderate
- Est. fire insurance / yr
- $1,222 – $2,270
Heat risk 9/10 · Severe
- Hot days now (above 110°F)
- 7 days/yr
- Hot days in 30 yrs
- 21 days/yr
Wind risk 9/10 · Severe
- Chance of severe wind over 30 yrs
- 99.0%
Air-quality risk 3/10 · Minor
- Unhealthy air days now
- 2 days/yr
- Unhealthy air days in 30 yrs
- 3 days/yr
Risk factors via First Street. Map © Google.
Why this score? — see what drove the D+ grade
The composite is a weighted blend of 9 inputs, each scored 0–100. Each bar is that input's sub-score; the figure is the points it added to the 100-point composite (weight × sub-score).
- Cash flow +18.8/30.0
- ARV discount +7.5/15.0
- DSCR +5.9/10.0
- 1% rule +4.3/10.0
- Schools +3.9/10.0
- Livability +3.2/5.0
- Rent growth +2.6/5.0
- Condition / age +2.5/5.0
- Appreciation +0.0/10.0
$238,990
🖨 Deal sheet 📄 Offer letter ✓ Due diligence
Listing remarks
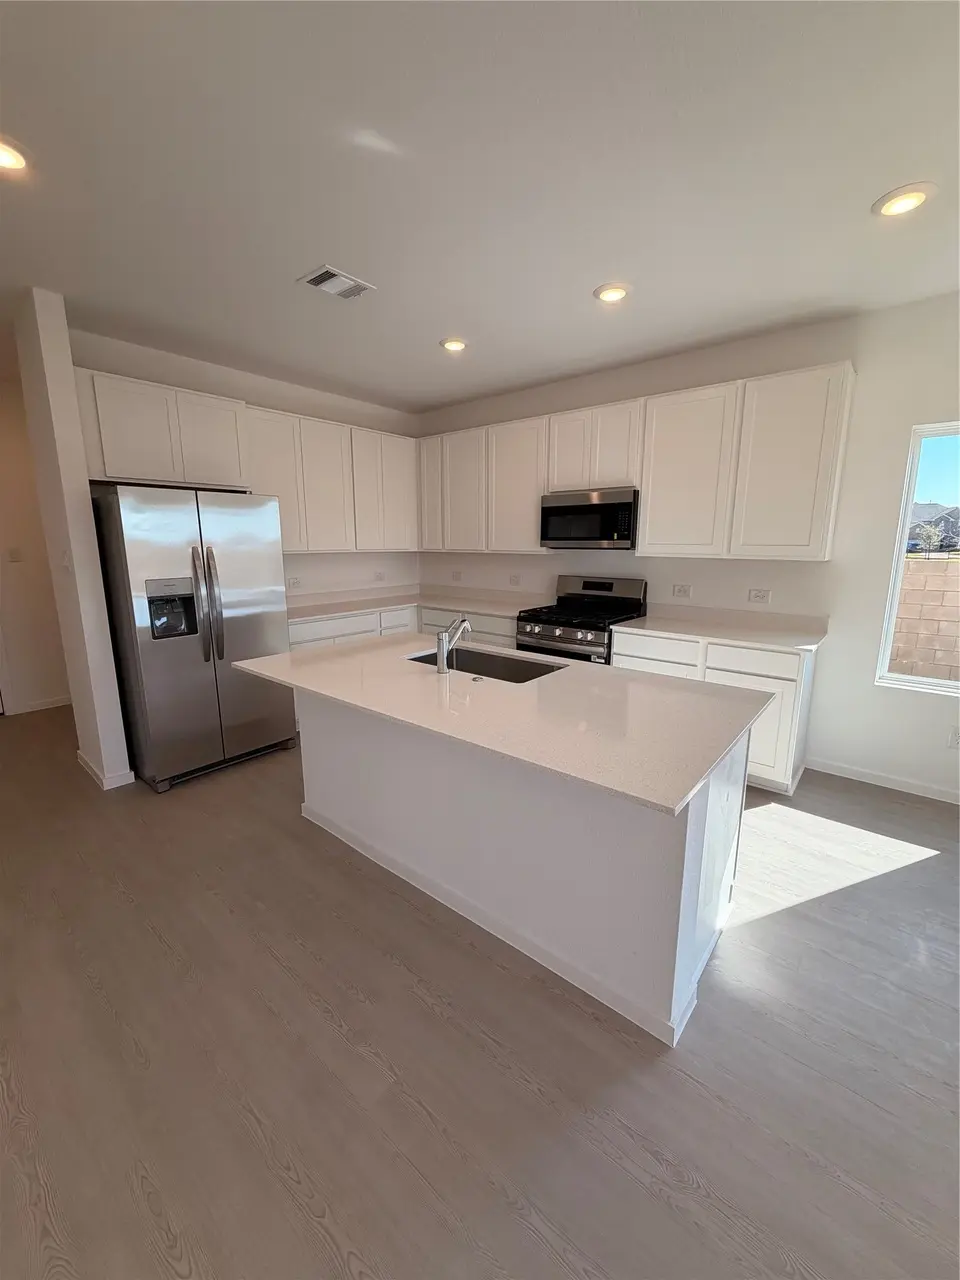
NEW! Lennar Texas Villas "Monarch" Plan with Brick Elevation "F" in Sierra Vista! This new two-story paired home features an inviting open-concept floorplan on the first level that blends a modern kitchen and comfortable Great Room. All three bedrooms are located on the second floor for optimal comfort and privacy, including a lavish owner’s suite with a full bathroom, steps from a versatile loft. Prices, dimensions and features may vary and are subject to change. Photos are for illustrative purposes only.
Key facts
- $133 HOA
- 2 garage spots
- Built 2026
Property features AI
Finance
- Other: Builder: Lennar
- HOA & community: Sierra Vista HOA with annual fee (includes clubhouse)
Exterior
- Parking: Attached 2-car garage
- Utilities: Has heating and cooling
- Home design: Residential property; Two-story home; Under construction (new construction); Slab foundation
- Construction: Built in 2026; Brick and cement siding construction
- Exterior features: Composition roof
Interior
- Kitchen: Kitchen with island; Pantry and walk-in pantry; Breakfast bar
- Bedrooms: Primary bedroom on second floor (13 x 15); Two additional bedrooms on second floor (each 10 x 10); One additional bedroom on second floor/bonus space noted
- Bathrooms: Two full bathrooms; One half bathroom
- Heating & cooling: Central heating (gas); Central electric air conditioning
- Interior features: Breakfast bar; Double vanity in bath; Kitchen island; Primary bath; Pantry; Walk-in pantry; Loft/bonus space
- Laundry & utility: Utility/loft area available (laundry location not specified)
Neighborhood map
What this means for you Summary
Snapshot
- This is a 3-bed/2.5-bath townhouse listed at $239k.
Deal economics
- At list price, monthly cash flow is $282 ($3k/yr) — positive.
- The deal already cash-flows at list — no discount required.
- Meets the 1% rule at list price ($3k rent vs $239k).
- Cap rate 7.5% vs local median 4.2% in Iowa Colony — top-decile yield for the area; either an underpriced asset or a hidden risk that comps aren't pricing in. Stress-test before assuming the spread holds.
Location & tenants
- Location reads 64/100 on livability (#757 in TX) — a middle-class / working-renter tenant base. Strengths: crime A+, employment A+, cost of living A+; Watch: amenities F, commute F, health & safety F.
- Alvin ISD (suburban): math 39% / reading 48% proficiency, ranked #255 of 826 in TX (top 31%) — families likely to look elsewhere, expect single-tenant / working-renter base with shorter leases.
- Zoned schools: Iowa Colony H S (792 students, 56% FRL).
- Market conditions: Rents flat; 1139 active listings in the ZIP; 21 comparable units currently listed for rent nearby; rentals leasing fast (median 13d on market — plan ~1-2 weeks tenant-placement turnaround); high-income renter base; 3,960 units permitted in Brazoria County in 2024 (593 in 5+ unit buildings).
Forward outlook
- Local home prices are declining (-3.0%/yr); year-one equity from $2k of loan paydown is wiped out by about $8k of value loss. Plan a longer hold.
- Brazoria County population projected at +44% by 2050 — long-run rental-demand tailwind backs the buy-and-hold thesis.
Negotiation context
- Only 2 days on market — expect competitive offers; lowballing is unlikely to land.
Risks & watch-outs
- Climate carrying-cost: severe wind risk, 99% chance of damaging wind over 30y; major wildfire risk; extreme-heat days projected 7→21/yr by 2055 (HVAC capex compounding) — expect insurance premiums to compound above CPI over the hold.
Questions for the listing agent
- What does the HOA fee cover, when was the last increase, and are there any pending special assessments or reserve-fund shortfalls?
- Is there a deadline driving the sale (1031 exchange, divorce, estate, relocation)? That informs how much negotiation room exists.
- Schools are F-rated, which usually means shorter tenancies and higher turnover. Who's the typical renter profile here, and what's been the actual vacancy rate?
- The area grade is low — what's the realistic commute time and amenity access for the typical tenant pool here? Any planned neighborhood developments (good or bad) we should know about?
- What's the average days-on-market for RENTAL listings here right now (not sales)? A rising rental-DOM trend means longer vacancies and softer asking-rent achievability than the comps imply.
- What's the recent tenant-quality profile in this submarket — average credit score on applications, eviction rate, late-payment / NSF rate, and stable-employment percentage? A property-management company in the area should have these aggregated.
- How much new for-sale + rental construction is in the pipeline within 1–3 miles? Heavy new supply typically softens prices + rents 12–24 months out; constrained supply supports both.
Investment metrics
- 1% rule
- 0.93% ✗
- Cap rate
- 7.50%
- Cash-on-cash
- 4.29%
- DSCR
- 1.19
- GRM
- 8.9
CMA / ARV
- ARV (on-the-fly)
- $281,260
- Comps found
- 12
Show comp detail 12 sales within ~0.75 mi
| Address | Dist | Beds/Ba | Sqft | Sold | Price | $/sf | Match |
|---|---|---|---|---|---|---|---|
| 2176 Salinas Dr | 0.03mi | 3/2.5 | 1,715 (0%) | 1mo | $279,990 | $163 | 98 |
| 2163 Salinas Dr | 0.03mi | 3/2.5 | 1,718 (+0%) | 2mo | $280,990 | $164 | 97 |
| 2167 Salinas Dr | 0.06mi | 3/2.5 | 1,728 (+1%) | 0mo | $280,990 | $163 | 96 |
| 2160 Salinas Dr | 0.01mi | 3/2.5 | 1,782 (+4%) | 1mo | $286,990 | $161 | 92 |
| 2171 Salinas Dr | 0.04mi | 3/2.5 | 1,778 (+4%) | 2mo | $287,990 | $162 | 91 |
| 2172 Salinas Dr | 0.03mi | 4/2.5 (+1) | 1,780 (+4%) | 1mo | $294,990 | $166 | 87 |
| 2214 Salinas Dr | 0.05mi | 4/2.5 (+1) | 1,777 (+4%) | 1mo | $299,991 | $169 | 86 |
| 2203 Salinas Dr | 0.05mi | 4/2.5 (+1) | 1,782 (+4%) | 1mo | $295,990 | $166 | 86 |
| 2227 Salinas Dr | 0.07mi | 4/2.5 (+1) | 1,782 (+4%) | 0mo | $298,990 | $168 | 85 |
| 2207 Salinas Dr | 0.05mi | 4/2.5 (+1) | 1,782 (+4%) | 2mo | $295,990 | $166 | 85 |
| 2782 Mariposa Creek Dr | 0.72mi | 3/2.5 | 1,686 (-2%) | 2mo | $229,000 | $136 | 62 |
| 2766 Mariposa Creek Dr #3 | 0.71mi | 3/2.5 | 1,661 (-3%) | 2mo | $229,000 | $138 | 60 |
Match score weights: distance 35% · size 25% · config 20% · recency 20%. Top-matched comps best support the ARV.
Projected returns pro-forma
-3.0% appreciation · 0.44% rent growth · sell at horizon
- IRR
- -12.3%
- Equity multiple
- 0.56×
- Total profit
- $-34,279
- Equity at exit
- $41,937
- IRR
- -7.3%
- Equity multiple
- 0.59×
- Total profit
- $-32,667
- Equity at exit
- $24,318
Cash invested: $78,753 (down + closing). Projections, not guarantees.
Landlord ↔ Tenant lean methodology
- Overall (STATE)
- 87 Strongly Landlord-Friendly
- State Texas
- 87 Strongly Landlord-Friendly · R+5
- County
- — inherits STATE
- City
- — inherits STATE
ZIP-level market 77583
- Rents YoY
- 0.4%
- Active inventory
- 1139
- Price-to-rent
- 7.6×
Monthly cashflow live
- Estimated rent
- $2,625 high interval (Pro) →
- Mortgage (P&I)
- −$1,475
- Tax from tax record
- −$67 /mo · $807/yr
- Insurance
- −$117
- HOA
- −$133
- Vacancy / Maint / Mgmt
- −$551
- Net cashflow
- $282
Break-even live
UW: 25.0% down · 7.5% · 30yr · 1.5% tax · 5.0% vac · 8.0% maint · 8.0% mgmt
Financing live
Cash to close
- Down payment
- $70,315
- Closing costs
- $8,438
- Reserves months
- —
- Total cash needed
- —
Loan-product check · same deal, 3 products live
Conventional
25% down · 7.5% · 30yr
- Down + closing
- —
- Monthly P&I
- —
- Monthly cashflow
- —
- DSCR
- —
- Eligible?
- —
Personal DTI + credit; lowest rate.
DSCR
20% down · 8.5% · 30yr
- Down + closing
- —
- Monthly P&I
- —
- Monthly cashflow
- —
- DSCR
- —
- Eligible?
- —
No personal income docs; deal must DSCR.
Hard money
10% down · 12.0% · 12mo
- Down + closing
- —
- Monthly P&I
- —
- Monthly cashflow
- —
- DSCR
- —
- Eligible?
- —
Short-term bridge; refi at stabilization.
Rent comps 21 comps
| Address | Beds | Baths | Sqft | Rent | $/sqft | DOM | Units | Dist |
|---|---|---|---|---|---|---|---|---|
| 10211 Alpine Lake Ln Rosharon, TX | 3.0–4.0 | 2.0–2.5 | 1731 | $2,700 | $1.56 | 1d | 6 | 0.16mi |
| 10211 Alpine Lake Ln Rosharon, TX | 3.0–4.0 | 2.0–2.5 | 1731 | $2,469 | $1.43 | 43d | 7 | 0.16mi |
| 1816 Corsica Creek Ln Rosharon, TX | 3.0–4.0 | 2.0–2.5 | 1653 | $2,306 | $1.40 | 1d | 21 | 0.33mi |
| 10313 Malta Trace Dr Rosharon, TX | 4.0 | 2.0 | 1802 | $2,545 | $1.41 | 43d | 1 | 0.42mi |
| 9518 Peridot Green Dr Rosharon, TX | 4.0 | 2.0 | 1593 | $1,886 | $1.18 | 22d | 1 | 0.50mi |
| 10203 Karsten Blvd Rosharon, TX | 1.0–2.0 | 1.0–2.0 | 935 | $2,061 | $2.20 | 1d | 138 | 0.59mi |
| 9423 Grand Spark Dr Rosharon, TX | 3.0 | 3.0 | 1999 | $2,600 | $1.30 | 43d | 1 | 0.80mi |
| 10610 Cascade Creek Dr Rosharon, TX | 3.0 | 2.0 | 1548 | $2,700 | $1.74 | 43d | 1 | 1.04mi |
| 10622 Cascade Creek Dr Rosharon, TX | 4.0 | 2.0 | 1780 | $2,775 | $1.56 | 43d | 1 | 1.07mi |
| 1403 Cascade Hills Dr Rosharon, TX | 4.0 | 3.0 | 2067 | $3,450 | $1.67 | 7d | 1 | 1.08mi |
| 10630 Cascade Creek Dr Rosharon, TX | 3.0 | 2.5 | 1940 | $2,875 | $1.48 | 2d | 1 | 1.08mi |
| 10507 Moon Valley Ln Rosharon, TX | 3.0 | 2.0 | 1548 | $2,650 | $1.71 | 1d | 1 | 1.11mi |
| 10502 Moon Valley Ln Rosharon, TX | 3.0 | 2.0 | 1615 | $2,725 | $1.69 | 1d | 1 | 1.14mi |
| 1123 Diamond Drape Dr Rosharon, TX | 4.0 | 2.0 | 1844 | $2,000 | $1.08 | 12d | 1 | 1.15mi |
| 1234 Scarlet Creek Dr Rosharon, TX | 3.0 | 2.0 | 1548 | $2,650 | $1.71 | 1d | 1 | 1.17mi |
| 9901 Kilkenny St Iowa Colony, TX | 3.0–4.0 | 2.5 | 1735 | $2,275 | $1.31 | 4d | 1 | 1.19mi |
| 10538 Wildflower View Dr Rosharon, TX | 3.0 | 2.0 | 1522 | $2,775 | $1.82 | 1d | 1 | 1.22mi |
| 2510 Green Jasper Dr Rosharon, TX | 3.0 | 2.0 | 1561 | $2,375 | $1.52 | 43d | 1 | 1.22mi |
| 10602 Wildflower View Dr Rosharon, TX | 4.0 | 2.0 | 1596 | $2,850 | $1.79 | 20d | 1 | 1.23mi |
| 10714 Cliffs View Dr Iowa Colony, TX | 4.0 | 3.5 | 2070 | $2,700 | $1.30 | 43d | 1 | 1.27mi |
| 2523 Topaz Hill Ln Rosharon, TX | 3.0–4.0 | 2.0–2.5 | 1857 | $2,425 | $1.31 | 16d | 1 | 1.46mi |
HOA detail
- Monthly dues
- $133 · $1,596/yr
Listing history 3 events
-
2026-06-18days on market $238,990 Active 2 DOM
-
2026-06-18price $238,990 Active 1 DOM
-
2026-05-28$241,990 Active
ⓘ Source: listings_history table (triggers on properties + properties_extension) + one-shot
backfill from property_details.listing_events for pre-trigger history.
Tax reassessment forecast TX · Resets to sale price
- Current annual tax
- $807 · $67/mo
- Projected year-2 tax
- $4,374 · $364/mo
- Expected delta
- +$3,567/yr (+$297/mo · 442.1%)
ⓘ Screening estimate from a state-policy table — verify with the county assessor before closing.
Climate risk First Street
- Flood 1/10 Low FEMA zone X (unshaded) · 0% chance over 30 yrs
- Wildfire 6/10 Major
- Heat 9/10 Extreme 7 d/yr ≥110°F today · 21 d/yr by 30 yrs out
- Wind 9/10 Extreme 99% chance of damaging wind over 30 yrs
- Air quality 3/10 Moderate 2 unhealthy d/yr today · 3 by 30 yrs out
Nearby sold comps map
Loading sold comps map…
Walkable amenities ~0.75 mi
Loading nearby amenities…
Taxation est. · year 1
- Rental income
- $31,506
- − Mortgage interest
- −$15,755
- − Property taxes
- −$807
- − Insurance
- −$1,406
- − Repairs & maintenance
- −$2,520
- − Management
- −$2,520
- − HOA
- −$1,596
- − Depreciation
- −$8,182
- Taxable loss
- −$1,281
- Est. tax savings @ 24.0%
- +$308
- After-tax cash flow
- $3,688/yr
For passive investors: Depreciation is non-cash, so a rental often shows a tax loss while cash-flowing — sheltering income. Rental losses are passive: they offset passive income freely, and up to $25,000/yr can offset ordinary (W-2) income if you actively participate and your MAGI is under $100k (phasing out to $0 by $150k); unused losses carry forward. On sale, claimed depreciation is recaptured at up to 25%, and gains may owe capital-gains tax (a 1031 exchange can defer both). Figures are a year-1 estimate at your 24.0% rate — not tax advice; consult a CPA.
Schools (NCES district)
- District
- Alvin ISD
- NCES district ID
- 4808090
- Math proficiency
- 39% ▼ -11.00%
- Reading proficiency
- 48% ▬ 0.00%
- Median HH income
- $66,740
- Composite
- 38.96/100
- National rank
- #4080
- State rank
- #255 of 826 in TX
Livability — Iowa Colony
- Score
- 64/100
- State rank
- #757
- US rank
- #13904
Category grades
Schools grade is shown separately in the Schools card above.
Census & demographics
- County
- Brazoria County · 374,982 people
- City population
- 52,747
- Metro
- Houston-The Woodlands-Sugar Land, TX
- Population (ZIP)
- 52,747
- Household income
- $119,287
- Rent vs Own
- Severe rent burden
- 251.0
Population outlook (Brazoria County) Hauer SSP2
- Today (2025)
- 420,414 people
- By 2030
- 457,585 · +8.8%
- By 2040
- 532,232 · +26.6%
- By 2050
- 605,399 · +44.0%
- By 2075
- 779,358 · +85.4%
- By 2100
- 883,759 · +110.2%
Race, ethnicity, and origin ACS 2023
- Neighborhood character
- Highly diverse neighborhood (Simpson 0.70)
- Race & ethnicity
- Hispanic / Latino 38% Black 34% White 20% Two or more races 18% Asian 5%
- Hispanic origin (detail)
- Mexican 31% Puerto Rican 2%
- Common ancestry
- Lithuanian 1% Slovak 1% Romanian 1%
- Foreign-born
- 16% · Canada, Vietnam, China
- Languages at home
- 64% English-only · Spanish 28% Other Asian/Pacific 2% Vietnamese 1%
Political lean MEDSL · Brazoria
- 2024 margin
- R (+19.7) · D 39.5% · R 59.2% · Other 1.3%
- 2008→2024 swing
- +9.9pp toward D · 2008: -29.6pp · 2024: -19.7pp
- All cycles
- 2024: R+19.7 2020: R+18.2 2016: R+24.6 2012: R+34.2 2008: R+29.6
Not yet ingested
- Civics
- —
Market trends
- HPI YoY
- ▼ -120.19%
- Current HPI
- 198.6559
- Rent YoY
- ▲ 0.44%
- Metro
- Houston-The Woodlands-Sugar Land, TX
- State GDP YoY
- ▲ 3.95%
- F500 in state
- 110
Industry mix (Fortune 500 HQ in TX)
| Industry | F500 HQs | Revenue |
|---|---|---|
| Energy | 16 | $1,198B |
|
||
| Technology | 5 | $198B |
|
||
| Engineering / Construction | 4 | $72B |
|
||
| Energy Services | 3 | $60B |
|
||
| Utilities | 3 | $41B |
|
||
| Healthcare | 2 | $330B |
|
||
Price history
1 event — show timeline
- 2026-05-28 Listed $241,990 HARMLS
Cash-flow waterfall
monthlySold comps — $/sqft
last 12 mo · ≤1 miLoading sold comps…