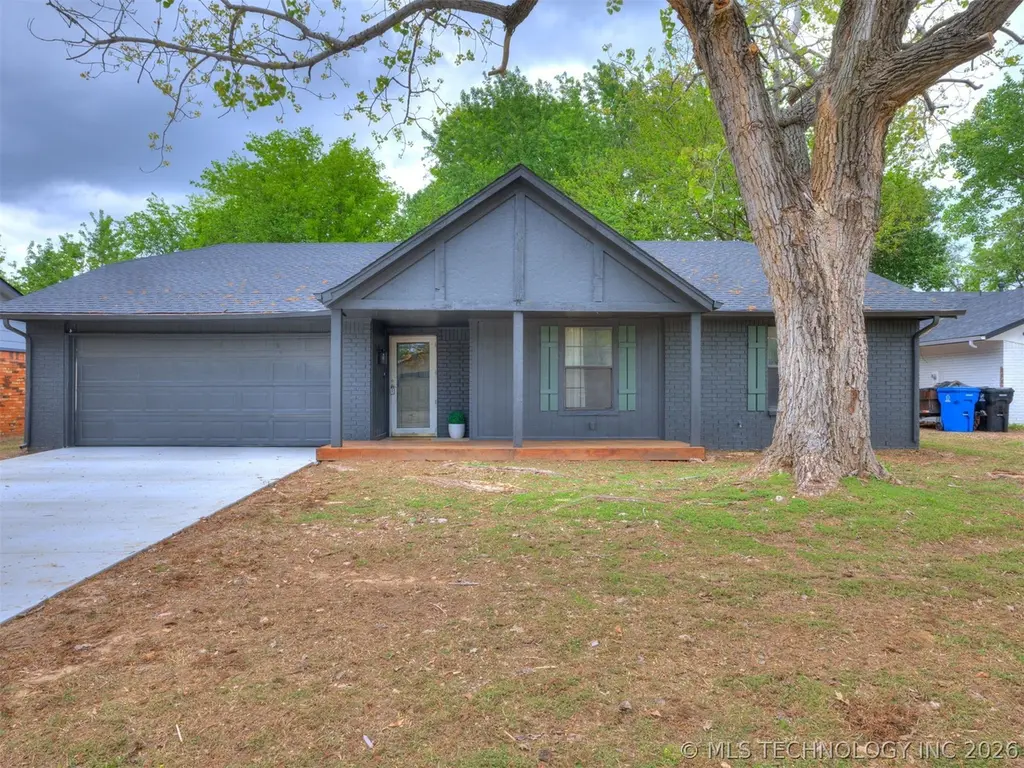
5001 S Ironwood Ave · Broken Arrow, OK
Flood risk 1/10 · Minimal
- FEMA flood zone
- X (unshaded)
- Chance of flooding over 30 yrs
- 0.0%
- Est. flood insurance / yr
- $473 – $860
Fire risk 4/10 · Minor
- Est. fire insurance / yr
- $2,463 – $4,575
Heat risk 7/10 · Major
- Hot days now (above 111°F)
- 7 days/yr
- Hot days in 30 yrs
- 18 days/yr
Wind risk 3/10 · Minor
- Chance of severe wind over 30 yrs
- 4.0%
Air-quality risk 2/10 · Minimal
- Unhealthy air days now
- 1 days/yr
- Unhealthy air days in 30 yrs
- 1 days/yr
Risk factors via First Street. Map © Google.
Why this score? — see what drove the D- grade
The composite is a weighted blend of 9 inputs, each scored 0–100. Each bar is that input's sub-score; the figure is the points it added to the 100-point composite (weight × sub-score).
- Cash flow +12.4/30.0
- ARV discount +5.9/15.0
- Livability +3.9/5.0
- DSCR +3.7/10.0
- Rent growth +3.2/5.0
- 1% rule +2.7/10.0
- Condition / age +2.5/5.0
- Schools +2.4/10.0
- Appreciation +0.0/10.0
$254,900
🖨 Deal sheet (PDF) 📄 Offer letter ✓ Due diligence
Listing remarks
Broken Arrow 4-bedroom home with updates rarely found at this value — fully updated with major systems already completed. Open layout with vaulted ceilings, spacious living area, and wood-burning fireplace. Kitchen features new quartz countertops, stainless steel appliances, an added pantry, and an interior laundry. Big-ticket upgrades include a new roof, new HVAC system, new hot water tank, and new concrete driveway for long-term peace of mind. Additional updates: waterproof LVP flooring, new carpet, tile showers, fresh paint, and updated fixtures throughout. Located near the Creek Turnpike, a truly move-in-ready 4-bedroom home. Owner/Agent.
Key facts
- Interior laundry
- Added pantry
- New roof
Tags
Property features AI
Finance
- HOA & community: Community gutters
Exterior
- Parking: Attached 2-car garage with shelving
- Security: Smoke detector(s); No safety shelter
- Utilities: Public water; Public sewer; Electricity available; Natural gas available; Cable available; Phone available
- Home design: Single-story home; Faces west; Slab foundation
- Construction: Built per public records; Brick and wood frame construction; Asphalt fiberglass roof
- Exterior features: Concrete driveway; Covered patio and porch; Rain gutters; Chain link full privacy fencing; Mature trees
Interior
- Kitchen: Pantry; Breakfast nook; Dishwasher; Microwave; Oven; Range; Disposal
- Bedrooms: Master bedroom with private bath and walk-in closet (first level); Multiple additional bedrooms (first level)
- Flooring: Carpet; Vinyl
- Bathrooms: Two full bathrooms; Master bath with separate shower (shower only) and ventilation; Hall bath with bathtub and ventilation
- Heating & cooling: Central heating (electric and gas); Central air conditioning
- Interior features: Quartz and stone counters; Vaulted ceilings; Electric oven and range connections; Blower fan on fireplace; Smoke detector(s)
- Laundry & utility: Interior utility room (first level); Gas water heater
Neighborhood map
What this means for you Summary
Snapshot
- This is a 4-bed/2.0-bath single-family listed at $255k.
Deal economics
- At list price, monthly cash flow is $-42 ($-503/yr) — negative.
- To cash-flow at today's rent, offer at most $247k (2.9% below list).
- To meet the 1% rule (rent ≥ 1% of price), the offer needs to be $197k (22.8% below list).
- Recommended offer: $197k (22.8% below list) — sets the bar for 1% rule.
- Cap rate 6.1% vs local median 4.1% in Broken Arrow — top-decile yield for the area; either an underpriced asset or a hidden risk that comps aren't pricing in. Stress-test before assuming the spread holds.
Location & tenants
- Location reads 78/100 on livability (#7 in OK, #2,691 nationally) — a middle-class / working-renter tenant base. Strengths: commute A+, cost of living A+, housing A+; Watch: amenities F.
- Broken Arrow (suburban): math 23% / reading 28% proficiency, ranked #79 of 270 in OK (top 29%) — low school quality limits family demand, transient renter base, plan for 1-2y turnover.
- Zoned schools: Aspen Creek Es (math 23% / reading 22%, grade F, #409 of 845 statewide, top 49%, 628 students, 0% FRL); Childers Ms (math 16% / reading 28%, grade F, #129 of 345 statewide, top 42%, 796 students, 0% FRL); Broken Arrow Hs (math 22% / reading 36%, grade F, #120 of 447 statewide, top 27%, 4,589 students, 0% FRL) — zoned schools average 0% FRL vs 33% district-wide (33 pts lower); this property's tenant base skews higher-income than the district average.
- Market conditions: Rents rising (+2.9%/yr); 446 active listings in the ZIP; 8 comparable units currently listed for rent nearby; rentals at typical pace (median 22d on market — plan ~3-4 weeks tenant-placement turnaround); solid renter incomes; 2,818 units permitted in Tulsa County in 2024 (518 in 5+ unit buildings).
Forward outlook
- Local home prices are declining (-3.0%/yr); year-one equity from $2k of loan paydown is wiped out by about $8k of value loss. Plan a longer hold.
- Tulsa County population projected at +30% by 2050 — long-run rental-demand tailwind backs the buy-and-hold thesis.
Negotiation context
- It's been on market 22 days — a 2% lower offer ($251k) is reasonable based on typical stale-listing flexibility.
- 5 sale attempts since 35y ago with the ask held roughly flat each time — persistent listings suggest the price (not the market) is what's stuck; bring a comps-based counter.
- Current owner paid $64k; list at $255k implies a 298% gain — meaningful room to come down on a strong offer.
Risks & watch-outs
- Climate carrying-cost: extreme-heat days projected 7→18/yr by 2055 (HVAC capex compounding) — expect insurance premiums to compound above CPI over the hold.
Questions for the listing agent
- What do current leases actually rent for vs. the listed asking? Can we see a recent rent roll and the last 12 months of T-12 income?
- Is there a deadline driving the sale (1031 exchange, divorce, estate, relocation)? That informs how much negotiation room exists.
- Schools are D-rated, which usually means shorter tenancies and higher turnover. Who's the typical renter profile here, and what's been the actual vacancy rate?
- The area grade is low — what's the realistic commute time and amenity access for the typical tenant pool here? Any planned neighborhood developments (good or bad) we should know about?
- What's the average days-on-market for RENTAL listings here right now (not sales)? A rising rental-DOM trend means longer vacancies and softer asking-rent achievability than the comps imply.
- What's the recent tenant-quality profile in this submarket — average credit score on applications, eviction rate, late-payment / NSF rate, and stable-employment percentage? A property-management company in the area should have these aggregated.
- How much new for-sale + rental construction is in the pipeline within 1–3 miles? Heavy new supply typically softens prices + rents 12–24 months out; constrained supply supports both.
Investment metrics
- 1% rule
- 0.77% ✗
- Cap rate
- 6.10%
- Cash-on-cash
- -0.70%
- DSCR
- 0.97
- GRM
- 10.8
CMA / ARV
- ARV (on-the-fly)
- $246,160
- Comps found
- 12
Show comp detail 12 sales within ~0.75 mi
| Address | Dist | Beds/Ba | Sqft | Sold | Price | $/sf | Match |
|---|---|---|---|---|---|---|---|
| 1105 W Durham St | 0.20mi | 3/2.0 (-1) | 1,478 (+2%) | 1mo | $225,000 | $152 | 82 |
| 4508 S Ironwood Ave | 0.37mi | 3/2.0 (-1) | 1,449 (+0%) | 1mo | $245,000 | $169 | 76 |
| 1305 E Durham St | 0.20mi | 3/2.0 (-1) | 1,532 (+6%) | 1mo | $265,000 | $173 | 75 |
| 1113 W Durham St | 0.18mi | 3/2.0 (-1) | 1,320 (-9%) | 2mo | $225,000 | $170 | 70 |
| 5305 S Maple Pl | 0.38mi | 3/2.0 (-1) | 1,526 (+5%) | 1mo | $270,000 | $177 | 68 |
| 1116 W Birmingham St | 0.32mi | 3/2.0 (-1) | 1,340 (-8%) | 1mo | $195,000 | $146 | 67 |
| 1305 W Miami St | 0.43mi | 3/2.0 (-1) | 1,274 (-12%) | 0mo | $235,000 | $184 | 55 |
| 1308 W Birmingham St | 0.37mi | 3/2.0 (-1) | 1,232 (-15%) | 0mo | $255,000 | $207 | 53 |
| 417 W Birmingham Ave | 0.48mi | 3/2.0 (-1) | 1,286 (-11%) | 2mo | $220,000 | $171 | 52 |
| 5613 S Juniper Ave | 0.37mi | 3/2.5 (-1) | 1,652 (+14%) | 4mo | $191,051 | $116 | 49 |
| 4609 S Date Ave | 0.51mi | 3/2.0 (-1) | 1,260 (-13%) | 3mo | $198,000 | $157 | 47 |
| 4605 S Cedar Ave | 0.56mi | 3/2.0 (-1) | 1,260 (-13%) | 4mo | $210,000 | $167 | 44 |
Match score weights: distance 35% · size 25% · config 20% · recency 20%. Top-matched comps best support the ARV.
Projected returns pro-forma
-3.0% appreciation · 2.94% rent growth · sell at horizon
- IRR
- -17.6%
- Equity multiple
- 0.38×
- Total profit
- $-44,165
- Equity at exit
- $38,006
- IRR
- -9.8%
- Equity multiple
- 0.40×
- Total profit
- $-42,673
- Equity at exit
- $22,039
Cash invested: $71,372 (down + closing). Projections, not guarantees.
Landlord ↔ Tenant lean methodology
- Overall (STATE)
- 83 Strongly Landlord-Friendly
- State Oklahoma
- 83 Strongly Landlord-Friendly · R+20
- County
- — inherits STATE
- City
- — inherits STATE
ZIP-level market 74012
- Rents YoY
- 2.9%
- Active inventory
- 446
- Price-to-rent
- 10.8×
Monthly cashflow live
- Estimated rent
- $1,968 high interval (Pro) →
- Mortgage (P&I)
- −$1,337
- Tax from tax record
- −$154 /mo · $1,846/yr
- Insurance
- −$106
- HOA
- −$0
- Lot rent
- −$0
- Vacancy / Maint / Mgmt
- −$413
- Net cashflow
- $-42
Break-even live
Sensitivity live
| Price | -10% $102 | -5% $30 | +0% $-42 | +5% $-114 | +10% $-186 |
|---|---|---|---|---|---|
| Rent | -10% $-197 | -5% $-120 | +0% $-42 | +5% $36 | +10% $114 |
| Rate | -1.0pp $86 | -0.5pp $23 | base $-42 | +0.5pp $-108 | +1.0pp $-175 |
UW: 25.0% down · 7.5% · 30yr · 1.5% tax · 5.0% vac · 8.0% maint · 8.0% mgmt
Financing live
Cash to close
- Down payment
- $63,725
- Closing costs
- $7,647
- Reserves months
- —
- Total cash needed
- —
Loan-product check · same deal, 3 products live
Conventional
25% down · 7.5% · 30yr
- Down + closing
- —
- Monthly P&I
- —
- Monthly cashflow
- —
- DSCR
- —
- Eligible?
- —
Personal DTI + credit; lowest rate.
DSCR
20% down · 8.5% · 30yr
- Down + closing
- —
- Monthly P&I
- —
- Monthly cashflow
- —
- DSCR
- —
- Eligible?
- —
No personal income docs; deal must DSCR.
Hard money
10% down · 12.0% · 12mo
- Down + closing
- —
- Monthly P&I
- —
- Monthly cashflow
- —
- DSCR
- —
- Eligible?
- —
Short-term bridge; refi at stabilization.
Rent comps 8 comps
| Address | Beds | Baths | Sqft | Rent | $/sqft | DOM | Units | Dist |
|---|---|---|---|---|---|---|---|---|
| 1110 W Birmingham Pl Broken Arrow, OK | 3.0 | 2.0 | 1282 | $1,750 | $1.37 | 6d | 1 | 0.27mi |
| 4325 S Ash Ave Broken Arrow, OK | 4.0 | 2.0 | 1400 | $1,578 | $1.13 | 24d | 1 | 0.90mi |
| 505 W Quantico St Broken Arrow, OK | 3.0 | 2.0 | 1033 | $1,250 | $1.21 | 13d | 1 | 0.96mi |
| 312 W Quantico St Broken Arrow, OK | 3.0 | 2.0 | 1200 | $1,295 | $1.08 | 0d | 1 | 1.03mi |
| 6308 S 1st Pl Broken Arrow, OK | 3.0 | 2.0 | 1600 | $3,400 | $2.12 | 18d | 1 | 1.05mi |
| 2242 W Quantico St Broken Arrow, OK | 3.0 | 2.5 | 1296 | $1,395 | $1.08 | 26d | 1 | 1.25mi |
| 2909 S Narcissus Ave Broken Arrow, OK | 3.0 | 2.0 | 1200 | $1,625 | $1.35 | 22d | 1 | 1.32mi |
| 1113 W Fulton St Broken Arrow, OK | 3.0 | 2.0 | 1135 | $1,495 | $1.32 | 26d | 1 | 1.46mi |
Listing history 12 events
-
2026-05-07status Pending
-
2026-05-04price $254,900
-
2026-04-13$259,900 Active
-
1998-07-01soldstatus $64,000
-
1997-08-27historical
-
1997-03-27$74,000
-
1997-01-22historical
-
1996-07-22$69,900
-
1992-06-11historical
-
1992-03-11$59,900
-
1992-02-14historical
-
1991-08-14$64,900
ⓘ Source: listings_history table (triggers on properties + properties_extension) + one-shot
backfill from property_details.listing_events for pre-trigger history.
Tax reassessment forecast OK · Resets to sale price
- Current annual tax
- $1,846 · $154/mo
- Projected year-2 tax
- $2,294 · $191/mo
- Expected delta
- +$448/yr (+$37/mo · 24.3%)
ⓘ Screening estimate from a state-policy table — verify with the county assessor before closing.
Climate risk First Street
- Flood 1/10 Low FEMA zone X (unshaded) · 0% chance over 30 yrs
- Wildfire 4/10 Moderate
- Heat 7/10 Severe 7 d/yr ≥111°F today · 18 d/yr by 30 yrs out
- Wind 3/10 Moderate 4% chance of damaging wind over 30 yrs
- Air quality 2/10 Low 1 unhealthy d/yr today · 1 by 30 yrs out
Nearby sold comps map
Loading sold comps map…
Walkable amenities ~0.75 mi
Loading nearby amenities…
Taxation est. · year 1
- Rental income
- $23,618
- − Mortgage interest
- −$14,278
- − Property taxes
- −$1,846
- − Insurance
- −$1,274
- − Repairs & maintenance
- −$1,889
- − Management
- −$1,889
- − Depreciation
- −$7,415
- Taxable loss
- −$4,975
- Est. tax savings @ 24.0%
- +$1,194
- After-tax cash flow
- $691/yr
For passive investors: Depreciation is non-cash, so a rental often shows a tax loss while cash-flowing — sheltering income. Rental losses are passive: they offset passive income freely, and up to $25,000/yr can offset ordinary (W-2) income if you actively participate and your MAGI is under $100k (phasing out to $0 by $150k); unused losses carry forward. On sale, claimed depreciation is recaptured at up to 25%, and gains may owe capital-gains tax (a 1031 exchange can defer both). Figures are a year-1 estimate at your 24.0% rate — not tax advice; consult a CPA.
Schools (NCES district)
- District
- Broken Arrow
- NCES district ID
- 4005490
- Math proficiency
- 23% ▼ -9.00%
- Reading proficiency
- 28% ▼ -9.00%
- Median HH income
- $64,646
- Composite
- 23.86/100
- National rank
- #7801
- State rank
- #79 of 270 in OK
Livability — Broken Arrow
- Score
- 78/100
- State rank
- #7
- US rank
- #2691
Category grades
Schools grade is shown separately in the Schools card above.
Census & demographics
- Census place
- Broken Arrow, OK
- County
- Tulsa County · 640,811 people
- City population
- 144,172
- Metro
- Tulsa, OK
- Population (ZIP)
- 65,060
- Household income
- $81,456
- Rent vs Own
- Severe rent burden
- 1378.0
Population outlook (Tulsa County) Hauer SSP2
- Today (2025)
- 723,846 people
- By 2030
- 766,033 · +5.8%
- By 2040
- 851,386 · +17.6%
- By 2050
- 938,389 · +29.6%
- By 2075
- 1,166,011 · +61.1%
- By 2100
- 1,350,277 · +86.5%
Race, ethnicity, and origin ACS 2023
- Neighborhood character
- Diverse neighborhood (Simpson 0.58)
- Race & ethnicity
- White 63% Two or more races 13% Hispanic / Latino 11% Black 7% Asian 5% Native American 5%
- Hispanic origin (detail)
- Mexican 8%
- Common ancestry
- Slovak 2% Italian 2% Lithuanian 2%
- Foreign-born
- 10% · Canada, Vietnam
- Languages at home
- 86% English-only · Spanish 7% Vietnamese 2% Other Asian/Pacific 1%
Political lean MEDSL · Tulsa
- 2024 margin
- R (+15.2) · D 41.3% · R 56.5% · Other 2.2%
- 2008→2024 swing
- +9.2pp toward D · 2008: -24.5pp · 2024: -15.2pp
- All cycles
- 2024: R+15.2 2020: R+15.6 2016: R+22.9 2012: R+27.4 2008: R+24.5
Not yet ingested
- Civics
- —
Market trends
- HPI YoY
- ▼ -170.42%
- Current HPI
- 214.1279
- Rent YoY
- ▲ 2.94%
- Metro
- Tulsa, OK
- State GDP YoY
- ▲ 1.55%
- F500 in state
- 6
Industry mix (Fortune 500 HQ in OK)
| Industry | F500 HQs | Revenue |
|---|---|---|
| Energy | 3 | $48B |
|
||
Price history
+292.8% since first listed12 events — show timeline
- 2026-05-07 Pending — MLS Technology, Inc.
- 2026-05-04 Price Changed $254,900 MLS Technology, Inc.
- 2026-04-13 Listed $259,900 MLS Technology, Inc.
- 1998-07-01 Sold (Public Records) $64,000 Public Records
- 1997-08-27 Listing Removed — MLS Technology, Inc.
- 1997-03-27 Listed $74,000 MLS Technology, Inc.
- 1997-01-22 Listing Removed — MLS Technology, Inc.
- 1996-07-22 Listed $69,900 MLS Technology, Inc.
- 1992-06-11 Listing Removed — MLS Technology, Inc.
- 1992-03-11 Listed $59,900 MLS Technology, Inc.
- 1992-02-14 Listing Removed — MLS Technology, Inc.
- 1991-08-14 Listed $64,900 MLS Technology, Inc.
Property tax history
+3.1%/yrLatest (2025): $1,846 · +3.1% YoY. Source: county tax records.
Cash-flow waterfall
monthlySold comps — $/sqft
last 12 mo · ≤1 miLoading sold comps…