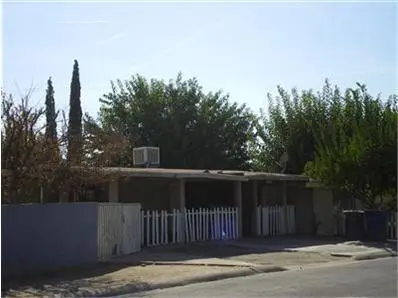
2242 Oleander St · Delano, CA
Flood risk 1/10 · Minimal
- FEMA flood zone
- X (unshaded)
- Chance of flooding over 30 yrs
- 0.0%
- Est. flood insurance / yr
- $507 – $1,088
Fire risk 5/10 · Moderate
- Est. fire insurance / yr
- $659 – $1,223
Heat risk 8/10 · Major
- Hot days now (above 106°F)
- 7 days/yr
- Hot days in 30 yrs
- 18 days/yr
Wind risk 1/10 · Minimal
- Chance of severe wind over 30 yrs
- —
Air-quality risk 10/10 · Severe
- Unhealthy air days now
- 30 days/yr
- Unhealthy air days in 30 yrs
- 34 days/yr
Risk factors via First Street. Map © Google.
Why this score? — see what drove the D+ grade
The composite is a weighted blend of 9 inputs, each scored 0–100. Each bar is that input's sub-score; the figure is the points it added to the 100-point composite (weight × sub-score).
- ARV discount +15.0/15.0
- Cash flow +14.8/30.0
- DSCR +4.5/10.0
- Schools +3.4/10.0
- 1% rule +3.2/10.0
- Rent growth +2.5/5.0
- Livability +2.5/5.0
- Condition / age +2.5/5.0
- Appreciation +0.0/10.0
$259,000
🖨 Deal sheet 📄 Offer letter ✓ Due diligence
Listing remarks MLS
Good deal in Delano. 4 bedroom home on corner of Oleander and 23rd. Opportunity to restore this house to your home. Don't delay. .. call today!
Key facts
- New ac
- Corner lot
- 6,098 sq ft lot
Tags
Property features AI
Exterior
- Parking: Uncovered parking
- Utilities: Public water; Sewer
- Home design: Single-family residence (R1 zoning)
- Construction: Slab foundation; Composition roof
- Exterior features: Covered patio; Corner lot
Interior
- Bathrooms: 2 full bathrooms
- Heating & cooling: Evaporative cooling; Floor/wall heater
- Interior features: Formal living room; Evaporative cooling; Floor/wall heating
Neighborhood map
What this means for you Summary
Snapshot
- This is a 4-bed/1.0-bath single-family listed at $259k.
Deal economics
- At list price, monthly cash flow is $71 ($849/yr) — positive.
- The deal already cash-flows at list — no discount required.
- To meet the 1% rule (rent ≥ 1% of price), the offer needs to be $212k (18.3% below list).
- Recommended offer: $212k (18.3% below list) — sets the bar for 1% rule.
- Cap rate 6.6% vs local median 3.2% in Delano — top-decile yield for the area; either an underpriced asset or a hidden risk that comps aren't pricing in. Stress-test before assuming the spread holds.
Location & tenants
- Location reads 50/100 on livability (#1,143 in CA) — a working-class tenant base; expect higher turnover. Strengths: housing A+; Watch: cost of living D, amenities F, commute F.
- Delano Union Elementary (suburban): math 32% / reading 43% proficiency, ranked #860 of 1,400 in CA (top 61%) — families likely to look elsewhere, expect single-tenant / working-renter base with shorter leases; 76% free/reduced lunch — lower-income household profile, screen leases tightly.
- Zoned schools: Princeton Street Elementary (365 students, 91% FRL) — zoned schools average 91% FRL vs 76% district-wide (16 pts higher); higher-poverty schools than district average — tighter screening recommended.
- Market conditions: 149 active listings in the ZIP; 9 comparable units currently listed for rent nearby; rentals leasing fast (median 3d on market — plan ~1-2 weeks tenant-placement turnaround); 3,244 units permitted in Kern County in 2024 (73 in 5+ unit buildings).
Forward outlook
- Local home prices are declining (-3.0%/yr); year-one equity from $2k of loan paydown is wiped out by about $8k of value loss. Plan a longer hold.
- Kern County population projected at +17% by 2050 — long-run rental-demand tailwind backs the buy-and-hold thesis.
Negotiation context
- Only 1 days on market — expect competitive offers; lowballing is unlikely to land.
- 3 sale attempts since 30y ago; this cycle's ask is 4% above the opening price — seller raised mid-cycle; expect resistance to lowballs.
- Current owner paid $30k; list at $259k implies a 763% gain — meaningful room to come down on a strong offer.
Risks & watch-outs
- Watch-outs: built in 1956 — expect roof / HVAC / electrical / plumbing capex.
- Climate carrying-cost: moderate wildfire risk; extreme-heat days projected 7→18/yr by 2055 (HVAC capex compounding) — expect insurance premiums to compound above CPI over the hold.
Questions for the listing agent
- Built in 1956 — when were the roof, HVAC, electrical panel, plumbing, and water heater last replaced?
- Is there a deadline driving the sale (1031 exchange, divorce, estate, relocation)? That informs how much negotiation room exists.
- Schools are F-rated, which usually means shorter tenancies and higher turnover. Who's the typical renter profile here, and what's been the actual vacancy rate?
- The area grade is low — what's the realistic commute time and amenity access for the typical tenant pool here? Any planned neighborhood developments (good or bad) we should know about?
- What's the average days-on-market for RENTAL listings here right now (not sales)? A rising rental-DOM trend means longer vacancies and softer asking-rent achievability than the comps imply.
- What's the recent tenant-quality profile in this submarket — average credit score on applications, eviction rate, late-payment / NSF rate, and stable-employment percentage? A property-management company in the area should have these aggregated.
- How much new for-sale + rental construction is in the pipeline within 1–3 miles? Heavy new supply typically softens prices + rents 12–24 months out; constrained supply supports both.
Investment metrics
- 1% rule
- 0.82% ✗
- Cap rate
- 6.62%
- Cash-on-cash
- 1.17%
- DSCR
- 1.05
- GRM
- 10.2
CMA / ARV
- ARV (on-the-fly)
- $317,652
- Comps found
- 12
Show comp detail 12 sales within ~0.75 mi
| Address | Dist | Beds/Ba | Sqft | Sold | Price | $/sf | Match |
|---|---|---|---|---|---|---|---|
| 1202 Lewis Ave | 0.25mi | 3/2.0 (-1) | 1,285 (+4%) | 1mo | $330,000 | $257 | 72 |
| 2240 Princeton St | 0.19mi | 3/1.8 (-1) | 1,280 (+4%) | 12mo | $320,000 | $250 | 67 |
| 2307 Oxford St | 0.06mi | 3/2.0 (-1) | 1,132 (-8%) | 9mo | $283,000 | $250 | 67 |
| 1112 Valencia Ave | 0.40mi | 4/2.0 | 1,160 (-6%) | 2mo | $251,500 | $217 | 66 |
| 2302 Norwalk St | 0.06mi | 3/2.0 (-1) | 1,098 (-11%) | 5mo | $350,000 | $319 | 65 |
| 2104 Norwalk St | 0.22mi | 3/1.0 (-1) | 1,176 (-5%) | 14mo | $289,000 | $246 | 65 |
| 1473 22nd Ave | 0.10mi | 3/2.0 (-1) | 1,416 (+15%) | 0mo | $250,000 | $177 | 62 |
| 2214 Quincy | 0.32mi | 4/2.5 | 1,397 (+13%) | 1mo | $367,000 | $263 | 56 |
| 2129 Randolph St | 0.47mi | 3/2.0 (-1) | 1,260 (+2%) | 14mo | $329,000 | $261 | 55 |
| 2125 Randolph St | 0.47mi | 3/2.0 (-1) | 1,260 (+2%) | 14mo | $360,000 | $286 | 54 |
| 1827 Summer Dr | 0.50mi | 3/2.0 (-1) | 1,303 (+5%) | 15mo | $355,000 | $272 | 46 |
| 725 18th | 0.74mi | 3/2.0 (-1) | 1,412 (+14%) | 2mo | $332,500 | $235 | 31 |
Match score weights: distance 35% · size 25% · config 20% · recency 20%. Top-matched comps best support the ARV.
Projected returns pro-forma
-3.0% appreciation · 3.0% rent growth · sell at horizon
- IRR
- -14.5%
- Equity multiple
- 0.48×
- Total profit
- $-37,546
- Equity at exit
- $38,618
- IRR
- -5.8%
- Equity multiple
- 0.62×
- Total profit
- $-27,234
- Equity at exit
- $22,394
Cash invested: $72,520 (down + closing). Projections, not guarantees.
Landlord ↔ Tenant lean methodology
- Overall (STATE)
- 18 Strongly Tenant-Friendly
- State California
- 18 Strongly Tenant-Friendly · D+13
- County
- — inherits STATE
- City
- — inherits STATE
ZIP-level market 93215
- Home prices YoY
- -15.4%
- Active inventory
- 149
- Price-to-rent
- 10.2×
Monthly cashflow live
- Estimated rent
- $2,115 high interval (Pro) →
- Mortgage (P&I)
- −$1,358
- Tax from tax record
- −$134 /mo · $1,611/yr
- Insurance
- −$108
- HOA
- −$0
- Vacancy / Maint / Mgmt
- −$444
- Net cashflow
- $71
Break-even live
UW: 25.0% down · 7.5% · 30yr · 1.5% tax · 5.0% vac · 8.0% maint · 8.0% mgmt
Financing live
Cash to close
- Down payment
- $64,750
- Closing costs
- $7,770
- Reserves months
- —
- Total cash needed
- —
Loan-product check · same deal, 3 products live
Conventional
25% down · 7.5% · 30yr
- Down + closing
- —
- Monthly P&I
- —
- Monthly cashflow
- —
- DSCR
- —
- Eligible?
- —
Personal DTI + credit; lowest rate.
DSCR
20% down · 8.5% · 30yr
- Down + closing
- —
- Monthly P&I
- —
- Monthly cashflow
- —
- DSCR
- —
- Eligible?
- —
No personal income docs; deal must DSCR.
Hard money
10% down · 12.0% · 12mo
- Down + closing
- —
- Monthly P&I
- —
- Monthly cashflow
- —
- DSCR
- —
- Eligible?
- —
Short-term bridge; refi at stabilization.
Rent comps 9 comps
| Address | Beds | Baths | Sqft | Rent | $/sqft | DOM | Units | Dist |
|---|---|---|---|---|---|---|---|---|
| 2032 Norwalk St Delano, CA | 3.0 | 2.0 | 1040 | $2,100 | $2.02 | 2d | 1 | 0.26mi |
| 2111 Kalibo St Delano, CA | 4.0 | 3.0 | 1260 | $2,450 | $1.94 | 2d | 1 | 0.35mi |
| 2203 Rounds St Delano, CA | 4.0 | 2.0 | 1481 | $2,000 | $1.35 | 2d | 1 | 0.37mi |
| 420 20th Ave Unit F Delano, CA | 3.0 | 2.0 | 1100 | $1,900 | $1.73 | 2d | 1 | 0.87mi |
| 420 20th Ave Unit C Delano, CA | 3.0 | 2.0 | 1100 | $1,900 | $1.73 | 43d | 1 | 0.88mi |
| 301 Stork Ct Delano, CA | 3.0 | 2.0 | 1498 | $2,450 | $1.64 | 2d | 1 | 0.90mi |
| 1914 17th Pl Delano, CA | 4.0 | 2.0 | 1382 | $1,900 | $1.37 | 18d | 1 | 0.92mi |
| 2108 Chaparral Dr Delano, CA | 4.0 | 2.0 | 1352 | $2,150 | $1.59 | 10d | 1 | 0.94mi |
| 1225 Lexington St Unit B Delano, CA | 3.0 | 2.0 | 983 | $1,700 | $1.73 | 2d | 1 | 1.03mi |
Listing history 12 events
-
2026-06-19pricedays on market $259,000 Active 1 DOM
-
2026-04-30$249,000 Active
-
2009-02-20soldstatus $30,000 143-char remark
Show marketing remark (143 chars)
Good deal in Delano. 4 bedroom home on corner of Oleander and 23rd. Opportunity to restore this house to your home. Don't delay. .. call today!
-
2009-02-11historical 143-char remark
Show marketing remark (143 chars)
Good deal in Delano. 4 bedroom home on corner of Oleander and 23rd. Opportunity to restore this house to your home. Don't delay. .. call today!
-
2009-02-11price $45,900 143-char remark
Show marketing remark (143 chars)
Good deal in Delano. 4 bedroom home on corner of Oleander and 23rd. Opportunity to restore this house to your home. Don't delay. .. call today!
-
2009-01-16$30,000 143-char remark
Show marketing remark (143 chars)
Good deal in Delano. 4 bedroom home on corner of Oleander and 23rd. Opportunity to restore this house to your home. Don't delay. .. call today!
-
2002-04-05price $47,500 196-char remark
Show marketing remark (196 chars)
Great Starter Home Or Investment In Delano. Over 1400 Squarefeet, 4 Bedrooms, 2 Baths, Living Room With Fireplace, Sep Family Room, Spacious Kitchen With Breakfast Area. Covered Patio And Carport.
-
1996-10-03soldstatus $50,000 196-char remark
Show marketing remark (196 chars)
Great Starter Home Or Investment In Delano. Over 1400 Squarefeet, 4 Bedrooms, 2 Baths, Living Room With Fireplace, Sep Family Room, Spacious Kitchen With Breakfast Area. Covered Patio And Carport.
-
1996-10-03soldstatus $50,000
Show marketing remark (196 chars)
Great Starter Home Or Investment In Delano. Over 1400 Squarefeet, 4 Bedrooms, 2 Baths, Living Room With Fireplace, Sep Family Room, Spacious Kitchen With Breakfast Area. Covered Patio And Carport.
-
1996-09-04historical 196-char remark
Show marketing remark (196 chars)
Great Starter Home Or Investment In Delano. Over 1400 Squarefeet, 4 Bedrooms, 2 Baths, Living Room With Fireplace, Sep Family Room, Spacious Kitchen With Breakfast Area. Covered Patio And Carport.
-
1996-08-23$50,000 196-char remark
Show marketing remark (196 chars)
Great Starter Home Or Investment In Delano. Over 1400 Squarefeet, 4 Bedrooms, 2 Baths, Living Room With Fireplace, Sep Family Room, Spacious Kitchen With Breakfast Area. Covered Patio And Carport.
-
1978-03-31soldstatus $8,500
ⓘ Source: listings_history table (triggers on properties + properties_extension) + one-shot
backfill from property_details.listing_events for pre-trigger history.
Tax reassessment forecast CA · Resets to sale price
- Current annual tax
- $1,611 · $134/mo
- Projected year-2 tax
- $1,968 · $164/mo
- Expected delta
- +$357/yr (+$30/mo · 22.2%)
ⓘ Screening estimate from a state-policy table — verify with the county assessor before closing.
Climate risk First Street
- Flood 1/10 Low FEMA zone X (unshaded) · 0% chance over 30 yrs
- Wildfire 5/10 Major
- Heat 8/10 Severe 7 d/yr ≥106°F today · 18 d/yr by 30 yrs out
- Wind 1/10 Low
- Air quality 10/10 Extreme 30 unhealthy d/yr today · 34 by 30 yrs out
Nearby sold comps map
Loading sold comps map…
Walkable amenities ~0.75 mi
Loading nearby amenities…
Taxation est. · year 1
- Rental income
- $25,385
- − Mortgage interest
- −$14,508
- − Property taxes
- −$1,611
- − Insurance
- −$1,295
- − Repairs & maintenance
- −$2,031
- − Management
- −$2,031
- − Depreciation
- −$7,535
- Taxable loss
- −$3,625
- Est. tax savings @ 24.0%
- +$870
- After-tax cash flow
- $1,719/yr
For passive investors: Depreciation is non-cash, so a rental often shows a tax loss while cash-flowing — sheltering income. Rental losses are passive: they offset passive income freely, and up to $25,000/yr can offset ordinary (W-2) income if you actively participate and your MAGI is under $100k (phasing out to $0 by $150k); unused losses carry forward. On sale, claimed depreciation is recaptured at up to 25%, and gains may owe capital-gains tax (a 1031 exchange can defer both). Figures are a year-1 estimate at your 24.0% rate — not tax advice; consult a CPA.
Schools (NCES district)
- District
- Delano Union Elementary
- NCES district ID
- 0610890
- Math proficiency
- 32% ▲ 6.00%
- Reading proficiency
- 43% ▲ 4.00%
- Median HH income
- $36,893
- Composite
- 33.68/100
- National rank
- #10442
- State rank
- #860 of 1400 in CA
Livability — Delano
- Score
- 50/100
- State rank
- #1143
- US rank
- #25752
Category grades
Schools grade is shown separately in the Schools card above.
Census & demographics
- Census place
- Delano, CA
- Population (ZIP)
- 53,627
Population outlook (Kern County) Hauer SSP2
- Today (2025)
- 947,286 people
- By 2030
- 978,984 · +3.3%
- By 2040
- 1,045,018 · +10.3%
- By 2050
- 1,105,232 · +16.7%
- By 2075
- 1,229,538 · +29.8%
- By 2100
- 1,238,059 · +30.7%
Race, ethnicity, and origin ACS 2023
- Neighborhood character
- Predominantly Hispanic (77%)
- Race & ethnicity
- Hispanic / Latino 77% Two or more races 37% Asian 13% White 5% Black 4%
- Hispanic origin (detail)
- Mexican 73%
- Foreign-born
- 34% · Canada, Vietnam
- Languages at home
- 26% English-only · Spanish 64% Tagalog/Filipino 6% Other Asian/Pacific 3%
Political lean MEDSL · Kern
- 2024 margin
- Strong R (+21.1) · D 38.2% · R 59.3% · Other 2.5%
- 2008→2024 swing
- -3.3pp toward R · 2008: -17.8pp · 2024: -21.1pp
- All cycles
- 2024: R+21.1 2020: R+10.2 2016: R+15.0 2012: R+20.9 2008: R+17.8
Not yet ingested
- Civics
- —
Market trends
- HPI YoY
- ▼ -70.32%
- Current HPI
- 385.3136
- Rent YoY
- —
- Metro
- —
- State GDP YoY
- ▲ 3.21%
- F500 in state
- 116
Industry mix (Fortune 500 HQ in CA)
| Industry | F500 HQs | Revenue |
|---|---|---|
| Technology | 27 | $1,492B |
|
||
| Financial Services | 3 | $174B |
|
||
| Retail | 3 | $44B |
|
||
| Insurance | 3 | $26B |
|
||
| Media / Entertainment | 2 | $115B |
|
||
| Pharmaceuticals / Biotech | 2 | $62B |
|
||
Price history
+2829.4% since first listed11 events — show timeline
- 2026-04-30 Listed $249,000 GEMLS
- 2009-02-20 Sold (MLS) $30,000 GEMLS
- 2009-02-11 Price Changed $45,900 GEMLS
- 2009-02-11 Delisted — GEMLS
- 2009-01-16 Listed $30,000 GEMLS
- 2002-04-05 Price Changed $47,500 GEMLS
- 1996-10-03 Sold (Public Records) $50,000 Public Records
- 1996-10-03 Sold (MLS) $50,000 GEMLS
- 1996-09-04 Delisted — GEMLS
- 1996-08-23 Listed $50,000 GEMLS
- 1978-03-31 Sold (Public Records) $8,500 Public Records
Property tax history
+12.1%/yrLatest (2025): $1,611 · +3.9% YoY. Source: county tax records.
Cash-flow waterfall
monthlySold comps — $/sqft
last 12 mo · ≤1 miLoading sold comps…