2491 N Highway 89 N #102 · Pleasant View, UT
Flood risk 4/10 · Minor
- FEMA flood zone
- X (unshaded)
- Chance of flooding over 30 yrs
- 0.2%
- Est. flood insurance / yr
- $507 – $1,088
Fire risk 1/10 · Minimal
- Est. fire insurance / yr
- $453 – $841
Heat risk 4/10 · Minor
- Hot days now (above 94°F)
- 7 days/yr
- Hot days in 30 yrs
- 18 days/yr
Wind risk 1/10 · Minimal
- Chance of severe wind over 30 yrs
- —
Air-quality risk 3/10 · Minor
- Unhealthy air days now
- 2 days/yr
- Unhealthy air days in 30 yrs
- 3 days/yr
Risk factors via First Street. Map © Google.
Why this score? — see what drove the B- grade
The composite is a weighted blend of 9 inputs, each scored 0–100. Each bar is that input's sub-score; the figure is the points it added to the 100-point composite (weight × sub-score).
- Cash flow +30.0/30.0
- 1% rule +10.0/10.0
- DSCR +10.0/10.0
- ARV discount +7.5/15.0
- Livability +3.9/5.0
- Schools +3.2/10.0
- Rent growth +3.1/5.0
- Condition / age +2.2/5.0
- Appreciation +0.0/10.0
$47,500
🖨 Deal sheet 📄 Offer letter ✓ Due diligence
Listing remarks
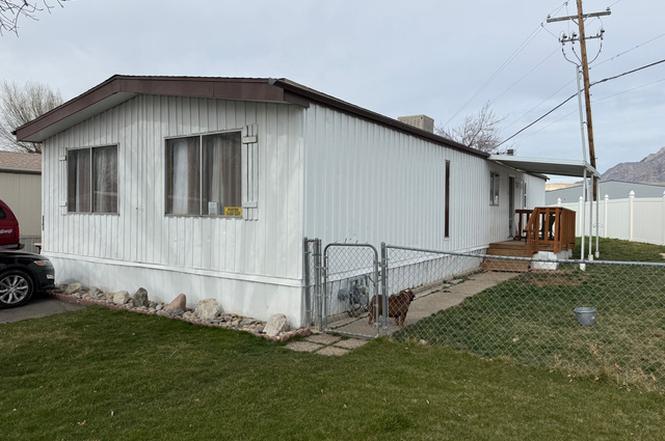
3 bed, 2 bath home (1,300 sq ft) built in 1973 in Evergreen Village MHC. Features a functional open layout, spacious living area, and private primary suite. Move-in ready with great natural light and storage. Close to shopping, dining, and major roads. Buyer must be park approved; lot rent $984/mo. Financing options available based on approval. Casa de 3 hab, 2 baos (1,300 sq ft) construida en 1973 en Evergreen Village MHC. Cuenta con una distribucin abierta y funcional, amplia sala de estar y una suite principal privada. Lista para mudar con excelente luz natural y espacio de almacenamiento. Cerca de tiendas, restaurantes y vas principales. El comprador debe ser aprobado por el parque; el
Key facts
- Storage
- Spacious living area
- Natural light
Tags
Property features AI
Finance
- HOA & community: Homeowners association with monthly dues; HOA amenities: clubhouse, pool, playground, RV parking, management, snow removal, trash service; HOA fees cover water, sewer and trash
Exterior
- Parking: 2 open/uncovered parking spaces; Common RV parking
- Utilities: Natural gas connected; Electricity connected; Sewer connected; Culinary (public) water
- Home design: Manufactured home; Built and standing
- Construction: Aluminum construction; Asphalt roof; Accessible doors
- Exterior features: Covered patio; Open patio; Open porch; Dog run; Storage shed(s); In-ground private pool; Corner lot; Fully fenced; Paved road; Landscaped
Interior
- Kitchen: Portable dishwasher; Microwave; Refrigerator; Gas oven/range; Range hood
- Bedrooms: 3 bedrooms on main level
- Flooring: Carpet; Hardwood; Laminate; Tile
- Bathrooms: 2 full bathrooms
- Heating & cooling: Gas central heating; Central air conditioning
- Interior features: Walk-in closet; Garbage disposal; Gas oven; Drapes; Ceiling fan; Gas grill/BBQ; Range hood
- Laundry & utility: Washer; Dryer; Gas dryer hookup
Neighborhood map
What this means for you Summary
Snapshot
- This is a 3-bed/2.0-bath manufactured listed at $48k. Condition is rated fair.
Deal economics
- At list price, monthly cash flow is $184 ($2k/yr) — positive.
- The deal already cash-flows at list — no discount required.
- Meets the 1% rule at list price ($2k rent vs $48k).
- Recommended offer: $47k (1.5% below list) — sets the bar for market timing.
Location & tenants
- Location reads 77/100 on livability (#51 in UT, #2,901 nationally) — a middle-class / working-renter tenant base. Strengths: crime A+, commute A+, employment A+; Watch: cost of living D, amenities F, health & safety F.
- Weber District (suburban): math 36% / reading 35% proficiency, ranked #56 of 80 in UT (top 70%) — families likely to look elsewhere, expect single-tenant / working-renter base with shorter leases.
- Zoned schools: Majestic School (math 35% / reading 35%, grade F, #388 of 585 statewide, top 67%, 771 students, 26% FRL) — zoned schools at 26% FRL track the district average.
- Market conditions: Rents rising (+2.3%/yr); 611 active listings in the ZIP; 8 comparable units currently listed for rent nearby; rentals at typical pace (median 14d on market — plan ~3-4 weeks tenant-placement turnaround); solid renter incomes; 1,630 units permitted in Weber County in 2024 (521 in 5+ unit buildings).
Forward outlook
- Local home prices are declining (-3.0%/yr); year-one equity from $328 of loan paydown is wiped out by about $1k of value loss. Plan a longer hold.
- Weber County population projected at +24% by 2050 — long-run rental-demand tailwind backs the buy-and-hold thesis.
- At projected returns (-3.0% appreciation + 2.3% rent growth), your $13k cash investment doubles in ~8 years — after that, you're playing with house money.
Negotiation context
- It's been on market 20 days — a 2% lower offer ($47k) is reasonable based on typical stale-listing flexibility.
Risks & watch-outs
- Watch-outs: HOA is 52% of rent.
Questions for the listing agent
- Have any recent inspections been done? Can we get a copy of the seller's disclosures and any deferred-maintenance estimates?
- Built in 1973 — when were the roof, HVAC, electrical panel, plumbing, and water heater last replaced?
- What does the HOA fee cover, when was the last increase, and are there any pending special assessments or reserve-fund shortfalls?
- Is there a deadline driving the sale (1031 exchange, divorce, estate, relocation)? That informs how much negotiation room exists.
- Schools are B-rated — typically a magnet for longer-tenancy family renters. What's the average tenant stay here, and is there a school-zone premium baked into asking?
- What's the average days-on-market for RENTAL listings here right now (not sales)? A rising rental-DOM trend means longer vacancies and softer asking-rent achievability than the comps imply.
- What's the recent tenant-quality profile in this submarket — average credit score on applications, eviction rate, late-payment / NSF rate, and stable-employment percentage? A property-management company in the area should have these aggregated.
- How much new for-sale + rental construction is in the pipeline within 1–3 miles? Heavy new supply typically softens prices + rents 12–24 months out; constrained supply supports both.
Investment metrics
- 1% rule
- 3.99% ✓
- Cap rate
- 10.93%
- Cash-on-cash
- 16.58%
- DSCR
- 1.74
- GRM
- 2.1
CMA / ARV
No comps found within radius.
Projected returns pro-forma
-3.0% appreciation · 2.33% rent growth · sell at horizon
- IRR
- 6.6%
- Equity multiple
- 1.25×
- Total profit
- $3,369
- Equity at exit
- $7,082
- IRR
- 15.0%
- Equity multiple
- 2.16×
- Total profit
- $15,439
- Equity at exit
- $4,107
Cash invested: $13,300 (down + closing). Projections, not guarantees.
Landlord ↔ Tenant lean methodology
- Overall (STATE)
- 86 Strongly Landlord-Friendly
- State Utah
- 86 Strongly Landlord-Friendly · R+15
- County
- — inherits STATE
- City
- — inherits STATE
ZIP-level market 84404
- Rents YoY
- 2.3%
- Active inventory
- 611
- Price-to-rent
- 2.1×
Monthly cashflow live
- Estimated rent
- $1,894 high interval (Pro) →
- Mortgage (P&I)
- −$249
- Tax est. 1.5%
- −$59 /mo · $712/yr
- Insurance
- −$20
- HOA
- −$984
- Vacancy / Maint / Mgmt
- −$398
- Net cashflow
- $184
Break-even live
UW: 25.0% down · 7.5% · 30yr · 1.5% tax · 5.0% vac · 8.0% maint · 8.0% mgmt
Financing live
Cash to close
- Down payment
- $11,875
- Closing costs
- $1,425
- Reserves months
- —
- Total cash needed
- —
Loan-product check · same deal, 3 products live
Conventional
25% down · 7.5% · 30yr
- Down + closing
- —
- Monthly P&I
- —
- Monthly cashflow
- —
- DSCR
- —
- Eligible?
- —
Personal DTI + credit; lowest rate.
DSCR
20% down · 8.5% · 30yr
- Down + closing
- —
- Monthly P&I
- —
- Monthly cashflow
- —
- DSCR
- —
- Eligible?
- —
No personal income docs; deal must DSCR.
Hard money
10% down · 12.0% · 12mo
- Down + closing
- —
- Monthly P&I
- —
- Monthly cashflow
- —
- DSCR
- —
- Eligible?
- —
Short-term bridge; refi at stabilization.
Rent comps 8 comps
| Address | Beds | Baths | Sqft | Rent | $/sqft | DOM | Units | Dist |
|---|---|---|---|---|---|---|---|---|
| 2100 US-89 Harrisville, UT | 2.0–3.0 | 1.0–2.5 | 1373 | $1,839 | $1.34 | 14d | 8 | 0.51mi |
| 1148 Spring Valley Ln Pleasant View, UT | 2.0 | 2.0 | 1148 | $1,551 | $1.35 | 14d | 1 | 0.82mi |
| 1502 N 900 W Ogden, UT | 2.0–3.0 | 1.0–1.5 | 1050 | $1,475 | $1.40 | 14d | 8 | 1.06mi |
| 1933 N 325 W Ogden, UT | 3.0 | 2.5 | 1374 | $1,795 | $1.31 | 19d | 1 | 1.09mi |
| 282 W 1975 N Ogden, UT | 3.0 | 2.5 | 1362 | $1,700 | $1.25 | 14d | 1 | 1.12mi |
| 255 W 2700 N Pleasant View, UT | 2.0–3.0 | 2.5 | 1557 | $2,219 | $1.43 | 14d | 2 | 1.18mi |
| 811 W 1340 N Ogden, UT | 1.0–3.0 | 1.0–2.5 | 1106 | $1,859 | $1.68 | 14d | 1 | 1.18mi |
| 2510 Charleston Ave Ogden, UT | 2.0–3.0 | 2.0 | 900 | $1,550 | $1.72 | 14d | 5 | 1.35mi |
HOA detail
- Monthly dues
- $984 · $11,808/yr
Listing history 3 events
-
2026-06-18days on market $47,500 Active 20 DOM
-
2026-06-17remarks 699-char remark
-
2026-06-17$47,500 Active 19 DOM
ⓘ Source: listings_history table (triggers on properties + properties_extension) + one-shot
backfill from property_details.listing_events for pre-trigger history.
Climate risk First Street
- Flood 4/10 Moderate FEMA zone X (unshaded) · 20% chance over 30 yrs
- Wildfire 1/10 Low
- Heat 4/10 Moderate 7 d/yr ≥94°F today · 18 d/yr by 30 yrs out
- Wind 1/10 Low
- Air quality 3/10 Moderate 2 unhealthy d/yr today · 3 by 30 yrs out
Nearby sold comps map
Loading sold comps map…
Walkable amenities ~0.75 mi
Loading nearby amenities…
Taxation est. · year 1
- Rental income
- $22,724
- − Mortgage interest
- −$2,661
- − Property taxes
- −$712
- − Insurance
- −$238
- − Repairs & maintenance
- −$1,818
- − Management
- −$1,818
- − HOA
- −$11,808
- − Depreciation
- −$1,382
- Taxable income
- $2,287
- Est. tax owed @ 24.0%
- −$549
- After-tax cash flow
- $1,656/yr
For passive investors: Depreciation is non-cash, so a rental often shows a tax loss while cash-flowing — sheltering income. Rental losses are passive: they offset passive income freely, and up to $25,000/yr can offset ordinary (W-2) income if you actively participate and your MAGI is under $100k (phasing out to $0 by $150k); unused losses carry forward. On sale, claimed depreciation is recaptured at up to 25%, and gains may owe capital-gains tax (a 1031 exchange can defer both). Figures are a year-1 estimate at your 24.0% rate — not tax advice; consult a CPA.
Condition & rehab AI · 12 photos
This manufactured home requires moderate renovations to update its dated kitchen, bathrooms, and flooring. Painting the interior walls and replacing the cabinets and fixtures can significantly improve its resale value.
Repairs flagged
- Moderate kitchen cabinets — dated and in need of replacement
- Moderate bathroom fixtures — outdated and in need of replacement
- Moderate flooring — dated and in need of replacement
- Moderate interior walls — dated and in need of repainting
Value-add opportunities
- Resale paint interior walls — Fresh paint can make a significant difference in the home's appearance
- Resale replace kitchen cabinets — New cabinets can improve the kitchen's functionality and aesthetics
- Resale replace bathroom fixtures — Upgraded fixtures can make the bathrooms more appealing
- Resale replace flooring — New flooring can enhance the home's overall appeal and functionality
Renovation cost estimate screening
| Repair item | Severity | Est. cost |
|---|---|---|
| kitchen cabinets · dated and in need of replacement | Moderate | $3,000–15,000 |
| bathroom fixtures · outdated and in need of replacement | Moderate | $3,000–15,000 |
| flooring · dated and in need of replacement | Moderate | $3,000–15,000 |
| interior walls · dated and in need of repainting | Moderate | $3,000–15,000 |
| Total estimated repair cost · 4 items | $12,000–60,000 |
Value-add ROI direction
- Resale paint interior walls — Fresh paint can make a significant difference in the home's appearance ↑
- Resale replace kitchen cabinets — New cabinets can improve the kitchen's functionality and aesthetics ↑
- Resale replace bathroom fixtures — Upgraded fixtures can make the bathrooms more appealing ↑
- Resale replace flooring — New flooring can enhance the home's overall appeal and functionality ↑
ⓘ Cost ranges are severity-bucket heuristics (US national rule-of-thumb). Get contractor quotes + a written scope before underwriting a rehab budget.
Schools (NCES district)
- District
- Weber District
- NCES district ID
- 4901200
- Math proficiency
- 36% ▼ -4.00%
- Reading proficiency
- 35% ▼ -5.00%
- Median HH income
- $65,750
- Composite
- 32.28/100
- National rank
- #5757
- State rank
- #56 of 80 in UT
Livability — Pleasant View
- Score
- 77/100
- State rank
- #51
- US rank
- #2901
Category grades
Schools grade is shown separately in the Schools card above.
Census & demographics
- Census place
- Pleasant View, UT
- County
- Weber County · 260,557 people
- Metro
- Ogden-Clearfield, UT
- Population (ZIP)
- 66,587
- Household income
- $85,057
- Rent vs Own
- Severe rent burden
- 1201.0
Population outlook (Weber County) Hauer SSP2
- Today (2025)
- 274,329 people
- By 2030
- 288,577 · +5.2%
- By 2040
- 314,848 · +14.8%
- By 2050
- 338,710 · +23.5%
- By 2075
- 384,412 · +40.1%
- By 2100
- 409,305 · +49.2%
Race, ethnicity, and origin ACS 2023
- Neighborhood character
- Predominantly White (70%)
- Race & ethnicity
- White 70% Hispanic / Latino 24% Two or more races 7% Asian 1%
- Hispanic origin (detail)
- Mexican 20%
- Common ancestry
- Italian 5% Slovak 4% Iranian 3%
- Foreign-born
- 8% · Canada
- Languages at home
- 83% English-only · Spanish 15% Other Indo-European 1%
Political lean MEDSL · Weber
- 2024 margin
- Strong R (+23.5) · D 36.8% · R 60.3% · Other 2.9%
- 2008→2024 swing
- +4.1pp toward D · 2008: -27.6pp · 2024: -23.5pp
- All cycles
- 2024: R+23.5 2020: R+22.7 2016: R+20.0 2012: R+46.0 2008: R+27.6
Not yet ingested
- Civics
- —
Market trends
- HPI YoY
- ▼ -317.85%
- Current HPI
- 323.2499
- Rent YoY
- ▲ 2.33%
- Metro
- Ogden-Clearfield, UT
- State GDP YoY
- ▲ 3.54%
- F500 in state
- 2
Industry mix (Fortune 500 HQ in UT)
| Industry | F500 HQs | Revenue |
|---|---|---|
| Financial Services | 1 | $3B |
|
||
Price history
1 event — show timeline
- 2026-05-29 Listed $47,500 WFRMLS
Cash-flow waterfall
monthlySold comps — $/sqft
last 12 mo · ≤1 miLoading sold comps…