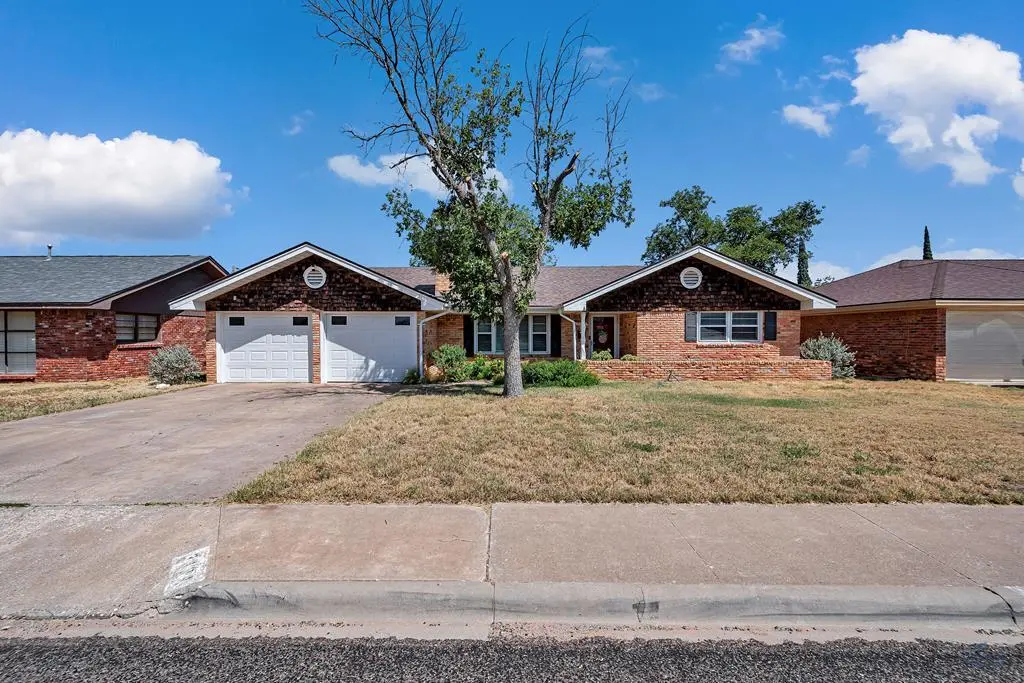
3104 Byron Ave · Odessa, TX
Flood risk 1/10 · Minimal
- FEMA flood zone
- X (unshaded)
- Chance of flooding over 30 yrs
- 0.0%
- Est. flood insurance / yr
- $507 – $1,088
Fire risk 2/10 · Minimal
- Est. fire insurance / yr
- $1,222 – $2,270
Heat risk 6/10 · Moderate
- Hot days now (above 101°F)
- 7 days/yr
- Hot days in 30 yrs
- 22 days/yr
Wind risk 2/10 · Minimal
- Chance of severe wind over 30 yrs
- 3.0%
Air-quality risk 1/10 · Minimal
- Unhealthy air days now
- 0 days/yr
- Unhealthy air days in 30 yrs
- 0 days/yr
Risk factors via First Street. Map © Google.
Why this score? — see what drove the D grade
The composite is a weighted blend of 9 inputs, each scored 0–100. Each bar is that input's sub-score; the figure is the points it added to the 100-point composite (weight × sub-score).
- Cash flow +14.3/30.0
- ARV discount +7.5/15.0
- DSCR +4.4/10.0
- Livability +3.8/5.0
- 1% rule +3.5/10.0
- Rent growth +2.8/5.0
- Condition / age +2.5/5.0
- Schools +2.2/10.0
- Appreciation +0.0/10.0
$235,000
🖨 Deal sheet 📄 Offer letter ✓ Due diligence
Listing remarks MLS
Charming updated home in established neighborhood has much to offer. Granite and recent appliances in kitchen. Cozy fireplace, large bedrooms. Attic has decking for storage. Backyard is picture perfect with great porch for entertaining.
Key facts
- 9,648 sq ft lot
- 2 garage spots
- Built 1957
Property features AI
Exterior
- Parking: 2 total parking spaces; 2 covered parking spaces; 2-car garage
- Security: Leased security system
- Utilities: Public water; Public sewer; Propane service
- Home design: Single-family residence; Residential property
- Construction: Composition roof; Slab foundation; Built for single-family use
- Exterior features: Landscaped lot; Paved road access; Wood fencing; Solar panels
Interior
- Kitchen: Electric range; Microwave; Dishwasher; Water heater
- Bathrooms: 2 full bathrooms
- Heating & cooling: Central heating; Central air conditioning
- Interior features: Blinds on windows; Living room fireplace; Leased security system
Neighborhood map
What this means for you Summary
Snapshot
- This is a 3-bed/2.0-bath single-family listed at $235k.
Deal economics
- At list price, monthly cash flow is $45 ($536/yr) — positive.
- The deal already cash-flows at list — no discount required.
- To meet the 1% rule (rent ≥ 1% of price), the offer needs to be $200k (14.9% below list).
- Recommended offer: $200k (14.9% below list) — sets the bar for 1% rule.
Location & tenants
- Location reads 75/100 on livability (#132 in TX, #3,928 nationally) — a middle-class / working-renter tenant base. Strengths: cost of living A+, housing A+, health & safety A+; Watch: commute D+, amenities D.
- Ector County ISD (urban): math 22% / reading 27% proficiency, ranked #707 of 826 in TX (top 86%) — low school quality limits family demand, transient renter base, plan for 1-2y turnover.
- Zoned schools: Edward K Downing El (math 25% / reading 20%, grade F, #3,311 of 4,322 statewide, top 77%, 817 students, 85% FRL); Bonham Middle (math 9% / reading 16%, grade F, #1,616 of 1,662 statewide, top 97%, 867 students, 65% FRL); Permian H S (math 19% / reading 29%, grade F, #1,333 of 1,632 statewide, top 82%, 3,978 students, 51% FRL).
- Market conditions: Rents rising (+1.4%/yr); 263 active listings in the ZIP; 40 comparable units currently listed for rent nearby; rentals at typical pace (median 21d on market — plan ~3-4 weeks tenant-placement turnaround); solid renter incomes; 1,004 units permitted in Ector County in 2024 (0 in 5+ unit buildings).
- This rent runs 32% of the median local income ($75k/yr) — at the standard rent-burdened threshold; future hikes will face affordability resistance.
Forward outlook
- Local home prices are declining (-3.0%/yr); year-one equity from $2k of loan paydown is wiped out by about $7k of value loss. Plan a longer hold.
- Ector County population projected at +78% by 2050 — long-run rental-demand tailwind backs the buy-and-hold thesis.
Negotiation context
- Only 3 days on market — expect competitive offers; lowballing is unlikely to land.
- 3 sale attempts since 14y ago with the ask held roughly flat each time — persistent listings suggest the price (not the market) is what's stuck; bring a comps-based counter.
Risks & watch-outs
- Watch-outs: built in 1957 — expect roof / HVAC / electrical / plumbing capex.
- Climate carrying-cost: extreme-heat days projected 7→22/yr by 2055 (HVAC capex compounding) — expect insurance premiums to compound above CPI over the hold.
Questions for the listing agent
- Built in 1957 — when were the roof, HVAC, electrical panel, plumbing, and water heater last replaced?
- Is there a deadline driving the sale (1031 exchange, divorce, estate, relocation)? That informs how much negotiation room exists.
- Schools are F-rated, which usually means shorter tenancies and higher turnover. Who's the typical renter profile here, and what's been the actual vacancy rate?
- The area grade is low — what's the realistic commute time and amenity access for the typical tenant pool here? Any planned neighborhood developments (good or bad) we should know about?
- What's the average days-on-market for RENTAL listings here right now (not sales)? A rising rental-DOM trend means longer vacancies and softer asking-rent achievability than the comps imply.
- What's the recent tenant-quality profile in this submarket — average credit score on applications, eviction rate, late-payment / NSF rate, and stable-employment percentage? A property-management company in the area should have these aggregated.
- How much new for-sale + rental construction is in the pipeline within 1–3 miles? Heavy new supply typically softens prices + rents 12–24 months out; constrained supply supports both.
Investment metrics
- 1% rule
- 0.85% ✗
- Cap rate
- 6.52%
- Cash-on-cash
- 0.81%
- DSCR
- 1.04
- GRM
- 9.8
CMA / ARV
No comps found within radius.
Projected returns pro-forma
-3.0% appreciation · 1.36% rent growth · sell at horizon
- IRR
- -16.8%
- Equity multiple
- 0.41×
- Total profit
- $-38,506
- Equity at exit
- $35,039
- IRR
- -11.7%
- Equity multiple
- 0.35×
- Total profit
- $-42,853
- Equity at exit
- $20,319
Cash invested: $65,800 (down + closing). Projections, not guarantees.
Landlord ↔ Tenant lean methodology
- Overall (STATE)
- 87 Strongly Landlord-Friendly
- State Texas
- 87 Strongly Landlord-Friendly · R+5
- County
- — inherits STATE
- City
- — inherits STATE
ZIP-level market 79762
- Rents YoY
- 1.4%
- Active inventory
- 263
- Price-to-rent
- 9.8×
Monthly cashflow live
- Estimated rent
- $1,999 high interval (Pro) →
- Mortgage (P&I)
- −$1,232
- Tax from tax record
- −$204 /mo · $2,449/yr
- Insurance
- −$98
- HOA
- −$0
- Vacancy / Maint / Mgmt
- −$420
- Net cashflow
- $45
Break-even live
UW: 25.0% down · 7.5% · 30yr · 1.5% tax · 5.0% vac · 8.0% maint · 8.0% mgmt
Financing live
Cash to close
- Down payment
- $58,750
- Closing costs
- $7,050
- Reserves months
- —
- Total cash needed
- —
Loan-product check · same deal, 3 products live
Conventional
25% down · 7.5% · 30yr
- Down + closing
- —
- Monthly P&I
- —
- Monthly cashflow
- —
- DSCR
- —
- Eligible?
- —
Personal DTI + credit; lowest rate.
DSCR
20% down · 8.5% · 30yr
- Down + closing
- —
- Monthly P&I
- —
- Monthly cashflow
- —
- DSCR
- —
- Eligible?
- —
No personal income docs; deal must DSCR.
Hard money
10% down · 12.0% · 12mo
- Down + closing
- —
- Monthly P&I
- —
- Monthly cashflow
- —
- DSCR
- —
- Eligible?
- —
Short-term bridge; refi at stabilization.
Rent comps 40 comps
| Address | Beds | Baths | Sqft | Rent | $/sqft | DOM | Units | Dist |
|---|---|---|---|---|---|---|---|---|
| 2905 Byron Ave Odessa, TX | 3.0 | 2.0 | 1816 | $2,400 | $1.32 | 13d | 1 | 0.13mi |
| 2901 Nabors Ln Odessa, TX | 3.0 | 1.0 | 1374 | $1,800 | $1.31 | 21d | 1 | 0.26mi |
| 2901 Nabors Ln Odessa, TX | 3.0 | 1.0 | 1508 | $1,800 | $1.19 | 13d | 1 | 0.26mi |
| 3009 N Century Ave Odessa, TX | 3.0 | 2.0 | 1909 | $2,600 | $1.36 | 43d | 1 | 0.30mi |
| 2801 Redbud Ave Odessa, TX | 3.0 | 2.0 | 1558 | $1,800 | $1.16 | 13d | 1 | 0.32mi |
| 3420 Fairlane Ave Odessa, TX | 3.0 | 2.0 | 2164 | $2,100 | $0.97 | 21d | 1 | 0.34mi |
| 2826 Hilltop Dr Odessa, TX | 4.0 | 2.0 | 1307 | $2,000 | $1.53 | 13d | 1 | 0.51mi |
| 3812 E Everglade Ave Odessa, TX | 3.0 | 2.0 | 1861 | $2,500 | $1.34 | 21d | 1 | 0.54mi |
| 2608 Cumberland Rd Odessa, TX | 2.0 | 2.0 | 1404 | $1,500 | $1.07 | 13d | 1 | 0.63mi |
| 1709 Byron Ave Odessa, TX | 3.0 | 2.0 | 1981 | $1,975 | $1.00 | 43d | 1 | 0.68mi |
| 1706 Emerald Ave Odessa, TX | 3.0 | 2.0 | 1992 | $2,500 | $1.26 | 43d | 1 | 0.70mi |
| 2702 S Colonial Dr Odessa, TX | 3.0 | 1.0 | 1490 | $1,500 | $1.01 | 13d | 1 | 0.71mi |
| 3824 Englewood Cir Odessa, TX | 2.0 | 1.5 | 1150 | $1,295 | $1.13 | 13d | 1 | 0.72mi |
| 3616 E 30th St Odessa, TX | 3.0 | 2.0 | 1436 | $1,995 | $1.39 | 43d | 1 | 0.72mi |
| 3902 Englewood Cir Odessa, TX | 2.0 | 1.5 | 1280 | $1,445 | $1.13 | 13d | 1 | 0.74mi |
| 4217 Redbud Ave Odessa, TX | 3.0 | 1.5 | 1203 | $2,200 | $1.83 | 13d | 1 | 0.75mi |
| 3904 Englewood Cir Odessa, TX | 2.0 | 1.0 | 1280 | $1,445 | $1.13 | 13d | 1 | 0.75mi |
| 3907 Englewood Cir Odessa, TX | 2.0 | 1.5 | 1170 | $1,395 | $1.19 | 13d | 1 | 0.77mi |
| 4233 Bonham Ave Odessa, TX | 3.0 | 2.0 | 1144 | $1,600 | $1.40 | 43d | 1 | 0.78mi |
| 3802 Englewood Cir Odessa, TX | 2.0 | 1.5 | 1150 | $1,295 | $1.13 | 13d | 1 | 0.80mi |
| 4207 Dakota Ave Odessa, TX | 3.0 | 2.0 | 1904 | $2,300 | $1.21 | 43d | 1 | 0.80mi |
| 4256 Bonham Ave Odessa, TX | 3.0 | 2.0 | 1261 | $1,600 | $1.27 | 21d | 1 | 0.87mi |
| 1212 E Century Ave Odessa, TX | 3.0 | 1.0 | 1359 | $1,300 | $0.96 | 21d | 1 | 0.87mi |
| 3916 Boulder Ave Odessa, TX | 3.0 | 2.0 | 1935 | $2,100 | $1.09 | 21d | 1 | 0.91mi |
| 1401 E 18th St Odessa, TX | 3.0 | 2.0 | 1690 | $2,000 | $1.18 | 13d | 1 | 0.92mi |
| 3624 Walnut Ave Odessa, TX | 3.0 | 1.0 | 1488 | $1,950 | $1.31 | 43d | 1 | 0.96mi |
| 3310 Tanglewood Ln Unit 1 Odessa, TX | 3.0 | 2.5 | 1732 | $2,200 | $1.27 | 21d | 1 | 1.00mi |
| 3312 Tanglewood Ln Odessa, TX | 3.0 | 2.5 | 1664 | $2,000 | $1.20 | 43d | 1 | 1.00mi |
| 3843 Penbrook St Odessa, TX | 1.0–3.0 | 1.0–2.0 | 885 | $1,584 | $1.79 | 13d | 24 | 1.00mi |
| 3843 Penbrook St Odessa, TX | 1.0–3.0 | 1.0–2.0 | 885 | $1,584 | $1.79 | 21d | 17 | 1.00mi |
| 1308 Alpine St Odessa, TX | 3.0 | 2.0 | 1800 | $2,195 | $1.22 | 13d | 1 | 1.02mi |
| 1202 E 42nd St Odessa, TX | 3.0 | 1.0 | 1100 | $1,650 | $1.50 | 43d | 1 | 1.07mi |
| 4425 Conley Ave Odessa, TX | 3.0 | 1.5 | 1584 | $2,200 | $1.39 | 21d | 1 | 1.10mi |
| 4424 Conley Ave Odessa, TX | 4.0 | 2.5 | 2100 | $2,500 | $1.19 | 43d | 1 | 1.12mi |
| 1813 Petroleum Dr Odessa, TX | 3.0 | 2.0 | 1299 | $1,700 | $1.31 | 21d | 1 | 1.15mi |
| 1513 E 11th St Odessa, TX | 3.0 | 2.0 | 1728 | $3,300 | $1.91 | 43d | 1 | 1.18mi |
| 2511 Beechwood St Odessa, TX | 3.0 | 2.0 | 2200 | $2,595 | $1.18 | 13d | 1 | 1.23mi |
| 4315 Esmond Dr Odessa, TX | 1.0–2.0 | 1.0–2.5 | 839 | $1,550 | $1.85 | 21d | 22 | 1.27mi |
| 2620 Cambridge St Odessa, TX | 3.0 | 2.0 | 1595 | $1,950 | $1.22 | 21d | 1 | 1.33mi |
| 2705 Cambridge St Odessa, TX | 3.0 | 2.0 | 1456 | $2,400 | $1.65 | 21d | 1 | 1.36mi |
Listing history 4 events
-
2026-06-03days on market $235,000 Active 3 DOM
-
2026-06-01days on market $235,000 Active 2 DOM
-
2026-05-31remarks 492-char remark
-
2026-05-31$235,000 Active 1 DOM
ⓘ Source: listings_history table (triggers on properties + properties_extension) + one-shot
backfill from property_details.listing_events for pre-trigger history.
Tax reassessment forecast TX · Resets to sale price
- Current annual tax
- $2,449 · $204/mo
- Projected year-2 tax
- $4,300 · $358/mo
- Expected delta
- +$1,852/yr (+$154/mo · 75.6%)
ⓘ Screening estimate from a state-policy table — verify with the county assessor before closing.
Climate risk First Street
- Flood 1/10 Low FEMA zone X (unshaded) · 0% chance over 30 yrs
- Wildfire 2/10 Low
- Heat 6/10 Major 7 d/yr ≥101°F today · 22 d/yr by 30 yrs out
- Wind 2/10 Low 3% chance of damaging wind over 30 yrs
- Air quality 1/10 Low 0 unhealthy d/yr today · 0 by 30 yrs out
Nearby sold comps map
Loading sold comps map…
Walkable amenities ~0.75 mi
Loading nearby amenities…
Taxation est. · year 1
- Rental income
- $23,985
- − Mortgage interest
- −$13,164
- − Property taxes
- −$2,449
- − Insurance
- −$1,175
- − Repairs & maintenance
- −$1,919
- − Management
- −$1,919
- − Depreciation
- −$6,836
- Taxable loss
- −$3,476
- Est. tax savings @ 24.0%
- +$834
- After-tax cash flow
- $1,370/yr
For passive investors: Depreciation is non-cash, so a rental often shows a tax loss while cash-flowing — sheltering income. Rental losses are passive: they offset passive income freely, and up to $25,000/yr can offset ordinary (W-2) income if you actively participate and your MAGI is under $100k (phasing out to $0 by $150k); unused losses carry forward. On sale, claimed depreciation is recaptured at up to 25%, and gains may owe capital-gains tax (a 1031 exchange can defer both). Figures are a year-1 estimate at your 24.0% rate — not tax advice; consult a CPA.
Schools (NCES district)
- District
- Ector County ISD
- NCES district ID
- 4818000
- Math proficiency
- 22% ▼ -9.00%
- Reading proficiency
- 27% ▼ -4.00%
- Median HH income
- $52,740
- Composite
- 21.89/100
- National rank
- #8233
- State rank
- #707 of 826 in TX
Livability — Odessa
- Score
- 75/100
- State rank
- #132
- US rank
- #3928
Category grades
Schools grade is shown separately in the Schools card above.
Census & demographics
- Census place
- Odessa, TX
- County
- Ector County · 131,169 people
- City population
- 131,169
- Metro
- Odessa, TX
- Population (ZIP)
- 39,927
- Household income
- $75,272
- Rent vs Own
- Severe rent burden
- 1477.0
Population outlook (Ector County) Hauer SSP2
- Today (2025)
- 212,765 people
- By 2030
- 241,962 · +13.7%
- By 2040
- 306,582 · +44.1%
- By 2050
- 379,755 · +78.5%
- By 2075
- 568,991 · +167.4%
- By 2100
- 709,829 · +233.6%
Race, ethnicity, and origin ACS 2023
- Neighborhood character
- Diverse neighborhood (Simpson 0.58)
- Race & ethnicity
- Hispanic / Latino 52% White 38% Two or more races 22% Black 6% Asian 2% Native American 1%
- Hispanic origin (detail)
- Mexican 45% Cuban 3%
- Common ancestry
- Slovak 1% Lithuanian 1% Italian 1%
- Foreign-born
- 12% · Canada, Vietnam
- Languages at home
- 68% English-only · Spanish 30%
Political lean MEDSL · Ector
- 2024 margin
- Solid R (+52.9) · D 23.2% · R 76.1%
- 2008→2024 swing
- -4.9pp toward R · 2008: -48.0pp · 2024: -52.9pp
- All cycles
- 2024: R+52.9 2020: R+47.8 2016: R+40.6 2012: R+48.9 2008: R+48.0
Not yet ingested
- Civics
- —
Market trends
- HPI YoY
- ▼ -194.97%
- Current HPI
- 229.6022
- Rent YoY
- ▲ 1.36%
- Metro
- Odessa, TX
- State GDP YoY
- ▲ 3.95%
- F500 in state
- 110
Industry mix (Fortune 500 HQ in TX)
| Industry | F500 HQs | Revenue |
|---|---|---|
| Energy | 16 | $1,198B |
|
||
| Technology | 5 | $198B |
|
||
| Engineering / Construction | 4 | $72B |
|
||
| Energy Services | 3 | $60B |
|
||
| Utilities | 3 | $41B |
|
||
| Healthcare | 2 | $330B |
|
||
Price history
+52.6% since first listed9 events — show timeline
- 2026-05-30 Listed $235,000 ODMLS
- 2025-11-07 Price Changed $261,000 ODMLS
- 2014-11-24 Sold (Public Records) — Public Records
- 2014-11-20 Sold (MLS) — ODMLS
- 2014-10-08 Listed $179,900 ODMLS
- 2012-09-19 Sold (Public Records) — Public Records
- 2012-09-18 Sold (MLS) — ODMLS
- 2012-07-31 Listed $154,000 ODMLS
- 2004-07-02 Sold (Public Records) — Public Records
Property tax history
-2.7%/yrLatest (2025): $2,449 · -31.6% YoY. Source: county tax records.
Cash-flow waterfall
monthlySold comps — $/sqft
last 12 mo · ≤1 miLoading sold comps…