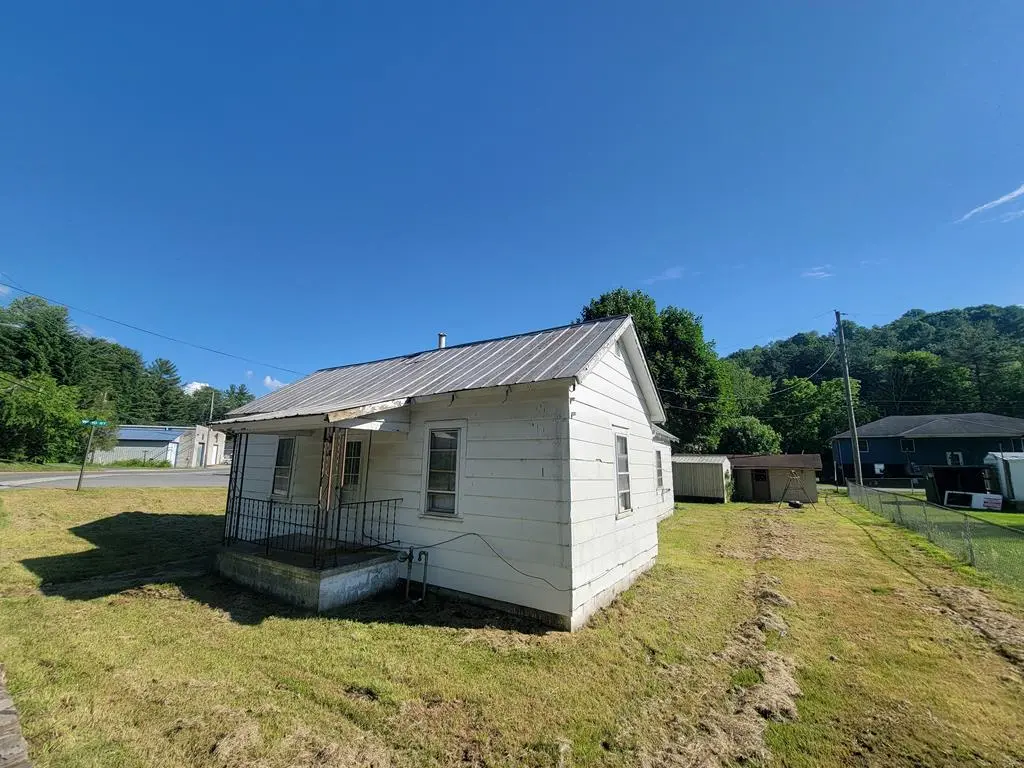
601 Whitestick St · Mabscott, WV
Flood risk 7/10 · Major
- FEMA flood zone
- AE
- Chance of flooding over 30 yrs
- 0.77%
- Est. flood insurance / yr
- $1,737 – $8,500
Fire risk 4/10 · Minor
- Est. fire insurance / yr
- $787 – $1,461
Heat risk 3/10 · Minor
- Hot days now (above 91°F)
- 7 days/yr
- Hot days in 30 yrs
- 21 days/yr
Wind risk 1/10 · Minimal
- Chance of severe wind over 30 yrs
- —
Air-quality risk 1/10 · Minimal
- Unhealthy air days now
- 0 days/yr
- Unhealthy air days in 30 yrs
- 0 days/yr
Risk factors via First Street. Map © Google.
Why this score? — see what drove the B+ grade
The composite is a weighted blend of 9 inputs, each scored 0–100. Each bar is that input's sub-score; the figure is the points it added to the 100-point composite (weight × sub-score).
- Cash flow +30.0/30.0
- ARV discount +15.0/15.0
- 1% rule +10.0/10.0
- DSCR +10.0/10.0
- Rent growth +3.6/5.0
- Schools +3.0/10.0
- Livability +3.0/5.0
- Condition / age +2.5/5.0
- Appreciation +0.0/10.0
$55,000
🖨 Deal sheet 📄 Offer letter ✓ Due diligence
Listing remarks
Country charm at a great price! Check out this home with one level living, spacious rooms, & newer vinyl throughout. Once an investment property, but would make a great starter home, or home to downsize to as well. Outdoors you will find a relatively level yard, garage, storage building, & mature foliage. It's located close to grocery stores, restaurants, gas stations, & Interstates 77 & 64.
Key facts
- Level yard
- Mature foliage
- Storage building
Tags
Property features AI
Exterior
- Parking: 1 covered parking space; Has a 1-car garage (total 1 parking space)
- Utilities: Public water; Public sewer
- Home design: Residential property
- Construction: Metal roof; Other construction materials
- Exterior features: Garden; Covered patio/porch; Shed(s); Level lot; Has a view
Interior
- Kitchen: Cooktop; Refrigerator
- Bedrooms: 3 main-level bedrooms
- Flooring: Vinyl
- Bathrooms: 1 full bathroom
- Heating & cooling: Electric heating; No central air (ceiling fan(s) for cooling)
- Interior features: Ceiling fan(s); 6 total rooms; No basement
- Laundry & utility: Main-level laundry; Electric water heater
Neighborhood map
What this means for you Summary
Snapshot
- This is a 3-bed/1.0-bath single-family listed at $55k.
Deal economics
- At list price, monthly cash flow is $275 ($3k/yr) — positive.
- The deal already cash-flows at list — no discount required.
- Meets the 1% rule at list price ($1k rent vs $55k).
Location & tenants
- Location reads 60/100 on livability (#212 in WV) — a middle-class / working-renter tenant base. Strengths: crime A+, cost of living A+; Watch: amenities F, commute F, employment F.
- Raleigh County Schools (rural): math 29% / reading 42% proficiency, ranked #14 of 55 in WV (top 26%) — families likely to look elsewhere, expect single-tenant / working-renter base with shorter leases.
- Zoned schools: Mabscott Elementary (math 22% / reading 27%, grade F, #287 of 377 statewide, top 85%, 222 students, 0% FRL); Park Middle School (math 40% / reading 49%, grade D, #10 of 109 statewide, top 8%, 394 students, 0% FRL); Woodrow Wilson High School (math 24% / reading 56%, grade F, #20 of 110 statewide, top 17%, 1,330 students, 0% FRL) — zoned schools average 0% FRL vs 46% district-wide (46 pts lower); this property's tenant base skews higher-income than the district average.
- Market conditions: Rents rising fast (+4.2%/yr); 112 active listings in the ZIP; 41 units permitted in Raleigh County in 2024 (0 in 5+ unit buildings).
Forward outlook
- Local home prices are declining (-3.0%/yr); year-one equity from $380 of loan paydown is wiped out by about $2k of value loss. Plan a longer hold.
- Raleigh County population projected at -16% by 2050 — secular population decline; favor cash flow + early exit over multi-decade hold.
- At projected returns (-3.0% appreciation + 4.2% rent growth), your $15k cash investment doubles in ~6 years — after that, you're playing with house money.
Negotiation context
- Only 7 days on market — expect competitive offers; lowballing is unlikely to land.
- 3 sale attempts with the ask held roughly flat each time — persistent listings suggest the price (not the market) is what's stuck; bring a comps-based counter.
Risks & watch-outs
- Watch-outs: flood insurance adds $427/mo; built in 1920 — expect roof / HVAC / electrical / plumbing capex.
- Climate carrying-cost: in FEMA flood zone AE (mandatory federal flood insurance) — expect insurance premiums to compound above CPI over the hold.
Questions for the listing agent
- Built in 1920 — when were the roof, HVAC, electrical panel, plumbing, and water heater last replaced?
- What's the actual annual flood-insurance premium (NFIP or private), and is the property in a SFHA with mandatory coverage?
- Is there a deadline driving the sale (1031 exchange, divorce, estate, relocation)? That informs how much negotiation room exists.
- What's the average days-on-market for RENTAL listings here right now (not sales)? A rising rental-DOM trend means longer vacancies and softer asking-rent achievability than the comps imply.
- What's the recent tenant-quality profile in this submarket — average credit score on applications, eviction rate, late-payment / NSF rate, and stable-employment percentage? A property-management company in the area should have these aggregated.
- How much new for-sale + rental construction is in the pipeline within 1–3 miles? Heavy new supply typically softens prices + rents 12–24 months out; constrained supply supports both.
Investment metrics
- 1% rule
- 2.40% ✓
- Cap rate
- 21.61%
- Cash-on-cash
- 54.69%
- DSCR
- 3.43
- GRM
- 3.5
CMA / ARV
- ARV (on-the-fly)
- $97,504
- Comps found
- 6
Show comp detail 6 sales within ~0.75 mi
| Address | Dist | Beds/Ba | Sqft | Sold | Price | $/sf | Match |
|---|---|---|---|---|---|---|---|
| 317 Quarry St | 0.36mi | 2/1.0 (-1) | 1,074 (-3%) | 9mo | $40,000 | $37 | 66 |
| 205 Loflin St | 0.21mi | 2/2.0 (-1) | 1,008 (-9%) | 8mo | $25,000 | $25 | 60 |
| 112 Wilkes Ave | 0.51mi | 2/1.0 (-1) | 1,008 (-9%) | 2mo | $125,000 | $124 | 55 |
| 116 Pershing Ave | 0.44mi | 2/2.0 (-1) | 1,143 (+3%) | 22mo | $142,000 | $124 | 47 |
| 209 Joseph St | 0.52mi | 2/1.0 (-1) | 1,244 (+12%) | 11mo | $109,000 | $88 | 41 |
| 118 Sparacino St | 0.66mi | 2/1.0 (-1) | 952 (-14%) | 23mo | $7,000 | $7 | 22 |
Match score weights: distance 35% · size 25% · config 20% · recency 20%. Top-matched comps best support the ARV.
Projected returns pro-forma
-3.0% appreciation · 4.25% rent growth · sell at horizon
- IRR
- 16.6%
- Equity multiple
- 1.69×
- Total profit
- $10,564
- Equity at exit
- $8,201
- IRR
- 26.7%
- Equity multiple
- 3.59×
- Total profit
- $39,917
- Equity at exit
- $4,755
Cash invested: $15,400 (down + closing). Projections, not guarantees.
Landlord ↔ Tenant lean methodology
- Overall (STATE)
- 83 Strongly Landlord-Friendly
- State West Virginia
- 83 Strongly Landlord-Friendly · R+22
- County
- — inherits STATE
- City
- — inherits STATE
ZIP-level market 25801
- Home prices YoY
- -17.8%
- Rents YoY
- 4.2%
- Active inventory
- 112
- Price-to-rent
- 3.5×
Monthly cashflow live
- Estimated rent
- $1,322 medium interval (Pro) →
- Mortgage (P&I)
- −$288
- Tax from tax record
- −$32 /mo · $379/yr
- Insurance
- −$23
- Flood insurance flood zone
- −$427 /mo · $5,118/yr
- HOA
- −$0
- Vacancy / Maint / Mgmt
- −$278
- Net cashflow
- $275
Break-even live
UW: 25.0% down · 7.5% · 30yr · 1.5% tax · 5.0% vac · 8.0% maint · 8.0% mgmt
Financing live
Cash to close
- Down payment
- $13,750
- Closing costs
- $1,650
- Reserves months
- —
- Total cash needed
- —
Loan-product check · same deal, 3 products live
Conventional
25% down · 7.5% · 30yr
- Down + closing
- —
- Monthly P&I
- —
- Monthly cashflow
- —
- DSCR
- —
- Eligible?
- —
Personal DTI + credit; lowest rate.
DSCR
20% down · 8.5% · 30yr
- Down + closing
- —
- Monthly P&I
- —
- Monthly cashflow
- —
- DSCR
- —
- Eligible?
- —
No personal income docs; deal must DSCR.
Hard money
10% down · 12.0% · 12mo
- Down + closing
- —
- Monthly P&I
- —
- Monthly cashflow
- —
- DSCR
- —
- Eligible?
- —
Short-term bridge; refi at stabilization.
Listing history 8 events
-
2026-06-19days on market $55,000 Active 7 DOM
-
2026-06-18days on market $55,000 Active 6 DOM
-
2026-06-17days on market $55,000 Active 5 DOM
-
2026-06-16days on market $55,000 Active 4 DOM
-
2026-06-15days on market $55,000 Active 3 DOM
-
2026-06-14remarks 400-char remark
-
2026-06-13remarks 392-char remark
-
2026-06-13$55,000 Active 1 DOM
ⓘ Source: listings_history table (triggers on properties + properties_extension) + one-shot
backfill from property_details.listing_events for pre-trigger history.
Tax reassessment forecast WV · Resets to sale price
- Current annual tax
- $379 · $32/mo
- Projected year-2 tax
- $379 · $32/mo
- Expected delta
- $0/yr ($0/mo · 0.0%)
ⓘ Screening estimate from a state-policy table — verify with the county assessor before closing.
Climate risk First Street
- Flood 7/10 Severe FEMA zone AE · 77% chance over 30 yrs
- Wildfire 4/10 Moderate
- Heat 3/10 Moderate 7 d/yr ≥91°F today · 21 d/yr by 30 yrs out
- Wind 1/10 Low
- Air quality 1/10 Low 0 unhealthy d/yr today · 0 by 30 yrs out
Nearby sold comps map
Loading sold comps map…
Walkable amenities ~0.75 mi
Loading nearby amenities…
Taxation est. · year 1
- Rental income
- $15,870
- − Mortgage interest
- −$3,081
- − Property taxes
- −$379
- − Insurance
- −$5,394
- − Repairs & maintenance
- −$1,270
- − Management
- −$1,270
- − Depreciation
- −$1,600
- Taxable income
- $2,877
- Est. tax owed @ 24.0%
- −$691
- After-tax cash flow
- $2,613/yr
For passive investors: Depreciation is non-cash, so a rental often shows a tax loss while cash-flowing — sheltering income. Rental losses are passive: they offset passive income freely, and up to $25,000/yr can offset ordinary (W-2) income if you actively participate and your MAGI is under $100k (phasing out to $0 by $150k); unused losses carry forward. On sale, claimed depreciation is recaptured at up to 25%, and gains may owe capital-gains tax (a 1031 exchange can defer both). Figures are a year-1 estimate at your 24.0% rate — not tax advice; consult a CPA.
Schools (NCES district)
- District
- Raleigh County Schools
- NCES district ID
- 5401230
- Math proficiency
- 29% ▼ -8.00%
- Reading proficiency
- 42% ▼ -3.00%
- Median HH income
- $39,828
- Composite
- 29.74/100
- National rank
- #6445
- State rank
- #14 of 55 in WV
Livability — Mabscott
- Score
- 60/100
- State rank
- #212
- US rank
- #18521
Category grades
Schools grade is shown separately in the Schools card above.
Census & demographics
- Census place
- Mabscott, WV
- County
- Raleigh County · 31,128 people
- City population
- 934
- Metro
- Beckley, WV
- Population (ZIP)
- 31,128
- Household income
- $56,836
- Rent vs Own
- Severe rent burden
- 1384.0
Population outlook (Raleigh County) Hauer SSP2
- Today (2025)
- 73,505 people
- By 2030
- 70,954 · -3.5%
- By 2040
- 66,038 · -10.2%
- By 2050
- 61,919 · -15.8%
- By 2075
- 51,954 · -29.3%
- By 2100
- 39,724 · -46.0%
Race, ethnicity, and origin ACS 2023
- Neighborhood character
- Predominantly White (81%)
- Race & ethnicity
- White 81% Black 10% Two or more races 7% Hispanic / Latino 2% Asian 2%
- Common ancestry
- Slovak 2% Italian 1% Lithuanian 1%
- Foreign-born
- 2% · Canada
- Languages at home
- 96% English-only · Spanish 2% Other Indo-European 1%
Political lean MEDSL · Raleigh
- 2024 margin
- Solid R (+54.3) · D 22.0% · R 76.3% · Other 1.6%
- 2008→2024 swing
- -28.5pp toward R · 2008: -25.9pp · 2024: -54.3pp
- All cycles
- 2024: R+54.3 2020: R+50.4 2016: R+52.8 2012: R+44.6 2008: R+25.9
Not yet ingested
- Civics
- —
Market trends
- HPI YoY
- ▼ -45.60%
- Current HPI
- 210.0114
- Rent YoY
- ▲ 4.25%
- Metro
- Beckley, WV
- State GDP YoY
- —
- F500 in state
- 0
Price history
-6.8% since first listed6 events — show timeline
- 2026-06-12 Listed $55,000 BBOR
- 2025-11-20 Listed $45,000 KVBOR
- 2025-11-11 Price Changed $47,500 KVBOR
- 2025-11-01 Price Changed $49,000 KVBOR
- 2025-10-10 Price Changed $55,000 KVBOR
- 2025-10-03 Listed $59,000 KVBOR
Property tax history
-2.2%/yrLatest (2025): $379 · +3.9% YoY. Source: county tax records.
Cash-flow waterfall
monthlySold comps — $/sqft
last 12 mo · ≤1 miLoading sold comps…