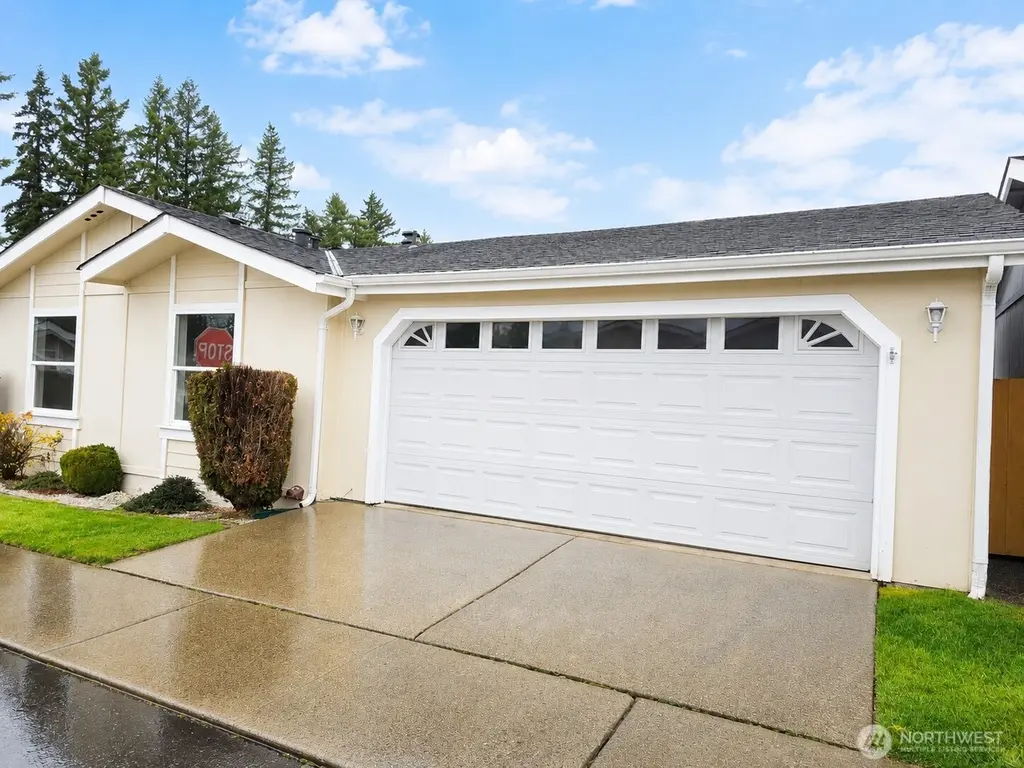
24006 222nd Ave SE #16 · Maple Valley, WA
Flood risk 1/10 · Minimal
- FEMA flood zone
- X (unshaded)
- Chance of flooding over 30 yrs
- 0.0%
- Est. flood insurance / yr
- $507 – $1,088
Fire risk 3/10 · Minor
- Est. fire insurance / yr
- $604 – $1,122
Heat risk 3/10 · Minor
- Hot days now (above 87°F)
- 8 days/yr
- Hot days in 30 yrs
- 17 days/yr
Wind risk 1/10 · Minimal
- Chance of severe wind over 30 yrs
- —
Air-quality risk 7/10 · Major
- Unhealthy air days now
- 11 days/yr
- Unhealthy air days in 30 yrs
- 16 days/yr
Risk factors via First Street. Map © Google.
Why this score? — see what drove the C- grade
The composite is a weighted blend of 9 inputs, each scored 0–100. Each bar is that input's sub-score; the figure is the points it added to the 100-point composite (weight × sub-score).
- Cash flow +19.9/30.0
- ARV discount +7.0/15.0
- Schools +6.6/10.0
- DSCR +6.3/10.0
- 1% rule +4.2/10.0
- Livability +4.2/5.0
- Rent growth +3.2/5.0
- Condition / age +2.5/5.0
- Appreciation +0.0/10.0
$498,990
🖨 Deal sheet 📄 Offer letter ✓ Due diligence
Listing remarks
Welcome to Lake Wilderness Villa, a premier 55+ gated community in Maple Valley. This beautifully maintained neighborhood offers an exceptional blend of comfort, style, and an active social lifestyle, with convenient access to local shopping, the Lake Wilderness trails and much more. We are pleased to present this updated and bright three-bedroom, two-bathroom home. The interior features an open great room concept with cathedral ceilings, skylights, and a dedicated dining area. The spacious, bright kitchen is equipped with a breakfast bar, ample counter space, and all necessary appliances. In the primary suite, you will find a walk-in closet, double vanities, a Jacuzzi jetted soaking tub, a
Key facts
- Cathedral ceilings
- 55 gated community
- Skylights
Tags
Neighborhood map
What this means for you Summary
Snapshot
- This is a 3-bed/2.0-bath condo listed at $499k.
Deal economics
- At list price, monthly cash flow is $606 ($7k/yr) — positive.
- The deal already cash-flows at list — no discount required.
- To meet the 1% rule (rent ≥ 1% of price), the offer needs to be $460k (7.9% below list).
- Recommended offer: $454k (9.0% below list) — sets the bar for market timing.
- Cap rate 7.7% vs local median 3.2% in Maple Valley — top-decile yield for the area; either an underpriced asset or a hidden risk that comps aren't pricing in. Stress-test before assuming the spread holds.
Location & tenants
- Location reads 85/100 on livability (#24 in WA, #461 nationally) — a professional / high-income tenant draw. Strengths: schools A+, employment A+, housing A+; Watch: cost of living F.
- Tahoma School District (suburban): math 68% / reading 76% proficiency, ranked #10 of 291 in WA (top 3%) — strong family-tenant draw, lease renewals of 3-5y typical; only 11% free/reduced lunch — higher-income household profile.
- Market conditions: Rents rising (+2.8%/yr); 221 active listings in the ZIP; 4 comparable units currently listed for rent nearby; rentals lingering (median 44d on market — plan ~5-8 weeks vacancy on turnover, expect pricing pressure); 50% of comp listings sitting > 30 days — soft ceiling on asking rent; high-income renter base; 10,555 units permitted in King County in 2024 (7,119 in 5+ unit buildings).
- This rent runs 36% of the median local income ($152k/yr) — at the standard rent-burdened threshold; future hikes will face affordability resistance.
Forward outlook
- Local home prices are declining (-3.0%/yr); year-one equity from $3k of loan paydown is wiped out by about $15k of value loss. Plan a longer hold.
- King County population projected at +44% by 2050 — long-run rental-demand tailwind backs the buy-and-hold thesis.
Negotiation context
- It's been on market 101 days — a 9% lower offer ($454k) is reasonable based on typical stale-listing flexibility.
Questions for the listing agent
- It's been on market 101 days. Have you received any prior offers? Is the seller open to a 9% concession, seller financing, or rate buy-down credit?
- What does the HOA fee cover, when was the last increase, and are there any pending special assessments or reserve-fund shortfalls?
- Any open or pending special assessments — roof, HVAC, plumbing, elevator, façade? What's the per-unit balance and payoff schedule, and is the seller paying it off at close or rolling it to the buyer?
- Why hasn't it sold? Are there any deal-killer items the seller is aware of (foundation, flood, title, zoning, code violations)?
- Is there a deadline driving the sale (1031 exchange, divorce, estate, relocation)? That informs how much negotiation room exists.
- Schools are A-rated — typically a magnet for longer-tenancy family renters. What's the average tenant stay here, and is there a school-zone premium baked into asking?
- What's the average days-on-market for RENTAL listings here right now (not sales)? A rising rental-DOM trend means longer vacancies and softer asking-rent achievability than the comps imply.
- What's the recent tenant-quality profile in this submarket — average credit score on applications, eviction rate, late-payment / NSF rate, and stable-employment percentage? A property-management company in the area should have these aggregated.
- How much new apartment / multifamily construction is in the pipeline within 1–3 miles? Heavy new supply (>2% of stock underway) typically softens rents 12–24 months out; light construction supports rent growth.
Investment metrics
- 1% rule
- 0.92% ✗
- Cap rate
- 7.75%
- Cash-on-cash
- 5.20%
- DSCR
- 1.23
- GRM
- 9.0
CMA / ARV
- ARV (median comp)
- $493,376
- List price
- $498,990
- Delta
- 1.14%
- Verdict
- FAIR
- Comps
- 20 within 1.0 mi
Projected returns pro-forma
-3.0% appreciation · 2.76% rent growth · sell at horizon
- IRR
- -8.5%
- Equity multiple
- 0.69×
- Total profit
- $-43,585
- Equity at exit
- $74,401
- IRR
- 0.7%
- Equity multiple
- 1.05×
- Total profit
- $6,418
- Equity at exit
- $43,144
Cash invested: $139,717 (down + closing). Projections, not guarantees.
Landlord ↔ Tenant lean methodology
- Overall (STATE)
- 28 Tenant-Leaning
- State Washington
- 28 Tenant-Leaning · D+8
- County
- — inherits STATE
- City
- — inherits STATE
ZIP-level market 98038
- Rents YoY
- 2.8%
- Active inventory
- 221
- Price-to-rent
- 9.0×
Monthly cashflow live
- Estimated rent
- $4,597 medium interval (Pro) →
- Mortgage (P&I)
- −$2,617
- Tax from tax record
- −$83 /mo · $1,000/yr
- Insurance
- −$208
- HOA
- −$118
- Vacancy / Maint / Mgmt
- −$965
- Net cashflow
- $606
Break-even live
UW: 25.0% down · 7.5% · 30yr · 1.5% tax · 5.0% vac · 8.0% maint · 8.0% mgmt
Financing live
Cash to close
- Down payment
- $124,748
- Closing costs
- $14,970
- Reserves months
- —
- Total cash needed
- —
Loan-product check · same deal, 3 products live
Conventional
25% down · 7.5% · 30yr
- Down + closing
- —
- Monthly P&I
- —
- Monthly cashflow
- —
- DSCR
- —
- Eligible?
- —
Personal DTI + credit; lowest rate.
DSCR
20% down · 8.5% · 30yr
- Down + closing
- —
- Monthly P&I
- —
- Monthly cashflow
- —
- DSCR
- —
- Eligible?
- —
No personal income docs; deal must DSCR.
Hard money
10% down · 12.0% · 12mo
- Down + closing
- —
- Monthly P&I
- —
- Monthly cashflow
- —
- DSCR
- —
- Eligible?
- —
Short-term bridge; refi at stabilization.
Rent comps 4 comps
| Address | Beds | Baths | Sqft | Rent | $/sqft | DOM | Units | Dist |
|---|---|---|---|---|---|---|---|---|
| 24212 224th Ave SE Unit 4 Maple Valley, WA | 2.0 | 2.0 | 1320 | $5,400 | $4.09 | 43d | 1 | 0.13mi |
| 24202 224th Ave SE Unit 3 Maple Valley, WA | 2.0 | 2.0 | 1320 | $5,400 | $4.09 | 43d | 1 | 0.13mi |
| 22435 SE 240th St Maple Valley, WA | 1.0–3.0 | 1.0–2.0 | 1004 | $2,725 | $2.71 | 1d | 5 | 0.24mi |
| 24116 235th Ave SE Maple Valley, WA | 3.0 | 3.0 | 1680 | $3,272 | $1.95 | 24d | 1 | 0.80mi |
HOA detail condo
- Monthly dues
- $118 · $1,416/yr
- Likely covers
- security
- Assessments
- None detected in remarks — confirm with the listing agent.
Listing history 15 events
-
2026-06-18days on market $498,990 Active 101 DOM
-
2026-06-17days on market $498,990 Active 100 DOM
-
2026-06-16days on market $498,990 Active 99 DOM
-
2026-06-15days on market $498,990 Active 98 DOM
-
2026-06-13statusdays on market $498,990 Active 96 DOM
-
2026-06-10status $498,990 Pending 93 DOM
-
2026-06-07status $498,990 Pending - Backup Offer Requested 93 DOM
-
2026-06-04days on market $498,990 Active 93 DOM
-
2026-06-03days on market $498,990 Active 92 DOM
-
2026-06-02days on market $498,990 Active 91 DOM
-
2026-06-01days on market $498,990 Active 90 DOM
-
2026-05-31days on market $498,990 Active 89 DOM
-
2026-05-14price $498,990
-
2026-04-13price $504,950
-
2026-03-03$515,000 Active
ⓘ Source: listings_history table (triggers on properties + properties_extension) + one-shot
backfill from property_details.listing_events for pre-trigger history.
Tax reassessment forecast WA · Resets to sale price
- Current annual tax
- $1,000 · $83/mo
- Projected year-2 tax
- $4,890 · $408/mo
- Expected delta
- +$3,890/yr (+$324/mo · 389.0%)
ⓘ Screening estimate from a state-policy table — verify with the county assessor before closing.
Climate risk First Street
- Flood 1/10 Low FEMA zone X (unshaded) · 0% chance over 30 yrs
- Wildfire 3/10 Moderate
- Heat 3/10 Moderate 8 d/yr ≥87°F today · 17 d/yr by 30 yrs out
- Wind 1/10 Low
- Air quality 7/10 Severe 11 unhealthy d/yr today · 16 by 30 yrs out
Nearby sold comps map
Loading sold comps map…
Walkable amenities ~0.75 mi
Loading nearby amenities…
Taxation est. · year 1
- Rental income
- $55,164
- − Mortgage interest
- −$27,951
- − Property taxes
- −$1,000
- − Insurance
- −$2,495
- − Repairs & maintenance
- −$4,413
- − Management
- −$4,413
- − HOA
- −$1,416
- − Depreciation
- −$14,516
- Taxable loss
- −$1,041
- Est. tax savings @ 24.0%
- +$250
- After-tax cash flow
- $7,517/yr
For passive investors: Depreciation is non-cash, so a rental often shows a tax loss while cash-flowing — sheltering income. Rental losses are passive: they offset passive income freely, and up to $25,000/yr can offset ordinary (W-2) income if you actively participate and your MAGI is under $100k (phasing out to $0 by $150k); unused losses carry forward. On sale, claimed depreciation is recaptured at up to 25%, and gains may owe capital-gains tax (a 1031 exchange can defer both). Figures are a year-1 estimate at your 24.0% rate — not tax advice; consult a CPA.
Schools (NCES district)
- District
- Tahoma School District
- NCES district ID
- 5308760
- Math proficiency
- 68% ▬ 0.00%
- Reading proficiency
- 76% ▬ 0.00%
- Median HH income
- $94,834
- Composite
- 66.41/100
- National rank
- #925
- State rank
- #10 of 291 in WA
Livability — Maple Valley
- Score
- 85/100
- State rank
- #24
- US rank
- #461
Category grades
Schools grade is shown separately in the Schools card above.
Census & demographics
- Census place
- Maple Valley, WA
- County
- King County · 2,251,916 people
- City population
- 37,324
- Metro
- Seattle-Tacoma-Bellevue, WA
- Population (ZIP)
- 37,324
- Household income
- $152,261
- Rent vs Own
- Severe rent burden
- 580.0
Population outlook (King County) Hauer SSP2
- Today (2025)
- 2,576,485 people
- By 2030
- 2,803,316 · +8.8%
- By 2040
- 3,255,921 · +26.4%
- By 2050
- 3,706,444 · +43.9%
- By 2075
- 4,746,063 · +84.2%
- By 2100
- 5,407,730 · +109.9%
Race, ethnicity, and origin ACS 2023
- Neighborhood character
- Predominantly White (73%)
- Race & ethnicity
- White 73% Asian 10% Two or more races 9% Hispanic / Latino 6% Black 2%
- Hispanic origin (detail)
- Mexican 3%
- Common ancestry
- Portuguese 5% Italian 4% Romanian 3%
- Foreign-born
- 13% · Canada, China, South Korea
- Languages at home
- 86% English-only · Other Asian/Pacific 4% Russian/Polish/Slavic 3% Other Indo-European 2%
Political lean MEDSL · King
- 2024 margin
- Solid D (+51.7) · D 74.2% · R 22.5% · Other 3.4%
- 2008→2024 swing
- +9.6pp toward D · 2008: 42.1pp · 2024: 51.7pp
- All cycles
- 2024: D+51.7 2020: D+52.7 2016: D+50.4 2012: D+39.9 2008: D+42.1
Not yet ingested
- Civics
- —
Market trends
- HPI YoY
- ▼ -588.79%
- Current HPI
- 310.7428
- Rent YoY
- ▲ 2.76%
- Metro
- Seattle-Tacoma-Bellevue, WA
- State GDP YoY
- ▲ 4.65%
- F500 in state
- 22
Industry mix (Fortune 500 HQ in WA)
| Industry | F500 HQs | Revenue |
|---|---|---|
| Retail | 2 | $269B |
|
||
| Technology / Retail | 1 | $638B |
|
||
| Technology | 1 | $245B |
|
||
| Telecommunications | 1 | $38B |
|
||
| Food / Beverage | 1 | $36B |
|
||
| Automotive / Trucks | 1 | $34B |
|
||
Price history
-3.1% since first listed3 events — show timeline
- 2026-05-14 Price Changed $498,990 NWMLS as Distributed by MLS Grid
- 2026-04-13 Price Changed $504,950 NWMLS as Distributed by MLS Grid
- 2026-03-03 Listed $515,000 NWMLS as Distributed by MLS Grid
Property tax history
-4.9%/yrLatest (2025): $1,000 · -0.8% YoY. Source: county tax records.
Cash-flow waterfall
monthlySold comps — $/sqft
last 12 mo · ≤1 miLoading sold comps…