7601 Simmerly Rd · Laytonville, CA
Flood risk No data
- FEMA flood zone
- —
- Chance of flooding over 30 yrs
- —
- Est. flood insurance / yr
- —
Fire risk No data
- Est. fire insurance / yr
- —
Heat risk No data
- Hot days now (above threshold)
- —
- Hot days in 30 yrs
- —
Wind risk No data
- Chance of severe wind over 30 yrs
- —
Air-quality risk No data
- Unhealthy air days now
- —
- Unhealthy air days in 30 yrs
- —
Risk factors via First Street. Map © Google.
Why this score? — see what drove the D grade
The composite is a weighted blend of 9 inputs, each scored 0–100. Each bar is that input's sub-score; the figure is the points it added to the 100-point composite (weight × sub-score).
- ARV discount +15.0/15.0
- Cash flow +7.1/30.0
- Appreciation +4.7/10.0
- Schools +2.8/10.0
- Rent growth +2.5/5.0
- Condition / age +2.5/5.0
- Livability +2.2/5.0
- 1% rule +2.0/10.0
- DSCR +1.3/10.0
$149,000
🖨 Deal sheet (PDF) 📄 Offer letter ✓ Due diligence
Listing remarks
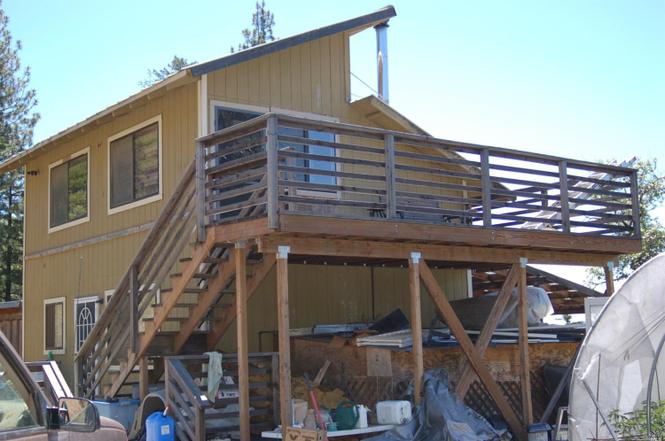
Make this mountain home shine again. Enjoy the solitude living on Simmerly ridge only 35 minutes away from the town of Laytonville. The property consists of two adjoining parcels, with multiple outbuildings. Water is provided by a permitted well. Heat is provided by a wood stove and a propane heater. Endless views from the adjoining parcel across the street would make a great secondary building spot, or a great place to stay while remodeling the house. Seller is motivated. 2nd adjoining parcel included with sale APN# 032-224-08 has an additional 10 acres. Motivated Seller! Owner will Carry.
Key facts
- Wood stove
- Propane heater
- Endless views
Tags
Property features AI
Finance
- HOA & community: No HOA; Not a senior community
Exterior
- Security: Security gate
- Utilities: Off-grid solar (seller owned photovoltaic system); Diesel generator power; Propane with leased tank; Septic system; Internet available
- Home design: Single family residence; Two-story
- Construction: No basement
- Exterior features: Back porch; Wood fencing; Private, secluded lot; Shed(s) on property
Interior
- Kitchen: Freestanding refrigerator
- Bedrooms: 1 bedroom (upper level)
- Flooring: Laminate flooring
- Bathrooms: 1 full bathroom (upper level)
- Heating & cooling: Propane heating; Fireplace heating; No central cooling
- Interior features: Wood stove fireplace; Security gate
- Laundry & utility: Washer/dryer hookups only
Neighborhood map
What this means for you Summary
Snapshot
- This is a 1-bed/1.0-bath single-family listed at $149k.
Deal economics
- At list price, monthly cash flow is $-211 ($-3k/yr) — negative.
- To cash-flow at today's rent, offer at most $118k (20.5% below list).
- To meet the 1% rule (rent ≥ 1% of price), the offer needs to be $104k (30.5% below list).
- Recommended offer: $104k (30.5% below list) — sets the bar for 1% rule.
- Cap rate 4.6% vs local median 2.5% in Laytonville — top-decile yield for the area; either an underpriced asset or a hidden risk that comps aren't pricing in. Stress-test before assuming the spread holds.
Location & tenants
- Location reads 45/100 on livability (#1,291 in CA) — a working-class tenant base; expect higher turnover. Watch: health & safety D+, schools F, crime F.
- Laytonville Unified (rural): math 25% / reading 35% proficiency, ranked #1,059 of 1,400 in CA (top 76%) — families likely to look elsewhere, expect single-tenant / working-renter base with shorter leases.
- Market conditions: 54 active listings in the ZIP; 8 units permitted in Mendocino County in 2024 (0 in 5+ unit buildings).
Forward outlook
- In year one you build about $70 of equity ($1k loan paydown + $-960 appreciation (-0.6% local appreciation)).
- Mendocino County population projected at -15% by 2050 — secular population decline; favor cash flow + early exit over multi-decade hold.
Negotiation context
- Only 2 days on market — expect competitive offers; lowballing is unlikely to land.
- 13 sale attempts since 13y ago with the ask held roughly flat each time — persistent listings suggest the price (not the market) is what's stuck; bring a comps-based counter.
Questions for the listing agent
- What do current leases actually rent for vs. the listed asking? Can we see a recent rent roll and the last 12 months of T-12 income?
- Is there a deadline driving the sale (1031 exchange, divorce, estate, relocation)? That informs how much negotiation room exists.
- Schools are F-rated, which usually means shorter tenancies and higher turnover. Who's the typical renter profile here, and what's been the actual vacancy rate?
- Crime grade is F in this area — have there been break-ins, vandalism, or insurance claims at this property in the last 3 years? What carrier currently insures it and at what premium?
- The area grade is low — what's the realistic commute time and amenity access for the typical tenant pool here? Any planned neighborhood developments (good or bad) we should know about?
- What's the average days-on-market for RENTAL listings here right now (not sales)? A rising rental-DOM trend means longer vacancies and softer asking-rent achievability than the comps imply.
- What's the recent tenant-quality profile in this submarket — average credit score on applications, eviction rate, late-payment / NSF rate, and stable-employment percentage? A property-management company in the area should have these aggregated.
- How much new for-sale + rental construction is in the pipeline within 1–3 miles? Heavy new supply typically softens prices + rents 12–24 months out; constrained supply supports both.
Investment metrics
- 1% rule
- 0.70% ✗
- Cap rate
- 4.59%
- Cash-on-cash
- -6.08%
- DSCR
- 0.73
- GRM
- 12.0
CMA / ARV
- ARV (median comp)
- $248,464
- List price
- $149,000
- Delta
- -40.03%
- Verdict
- UNDERPRICED
- Comps
- 4 within 1.0 mi
Show comp detail 2 sales within ~0.75 mi
| Address | Dist | Beds/Ba | Sqft | Sold | Price | $/sf | Match |
|---|---|---|---|---|---|---|---|
| 20001 Woodman Creek Rd | 0.00mi | 2/1.0 (+1) | 1,024 (+2%) | 2mo | $220,000 | $215 | 89 |
| 44550 Willis Ave | 0.44mi | 1/1.0 | 960 (-4%) | 11mo | $370,000 | $385 | 64 |
Match score weights: distance 35% · size 25% · config 20% · recency 20%. Top-matched comps best support the ARV.
Projected returns pro-forma
-0.64% appreciation · 3.0% rent growth · sell at horizon
- IRR
- -12.1%
- Equity multiple
- 0.47×
- Total profit
- $-22,265
- Equity at exit
- $38,526
- IRR
- -5.5%
- Equity multiple
- 0.47×
- Total profit
- $-22,006
- Equity at exit
- $42,680
Cash invested: $41,720 (down + closing). Projections, not guarantees.
Landlord ↔ Tenant lean methodology
- Overall (STATE)
- 18 Strongly Tenant-Friendly
- State California
- 18 Strongly Tenant-Friendly · D+13
- County
- — inherits STATE
- City
- — inherits STATE
ZIP-level market 95454
- Home prices YoY
- -0.5%
- Active inventory
- 54
- Price-to-rent
- 12.0×
Monthly cashflow live
- Estimated rent
- $1,036 medium interval (Pro) →
- Mortgage (P&I)
- −$781
- Tax est. 1.5%
- −$186 /mo · $2,235/yr
- Insurance
- −$62
- HOA
- −$0
- Vacancy / Maint / Mgmt
- −$218
- Net cashflow
- $-211
Break-even live
Sensitivity live
| Price | -10% $-108 | -5% $-160 | +0% $-211 | +5% $-263 | +10% $-314 |
|---|---|---|---|---|---|
| Rent | -10% $-293 | -5% $-252 | +0% $-211 | +5% $-171 | +10% $-130 |
| Rate | -1.0pp $-136 | -0.5pp $-174 | base $-211 | +0.5pp $-250 | +1.0pp $-289 |
UW: 25.0% down · 7.5% · 30yr · 1.5% tax · 5.0% vac · 8.0% maint · 8.0% mgmt
Financing live
Cash to close
- Down payment
- $37,250
- Closing costs
- $4,470
- Reserves months
- —
- Total cash needed
- —
Loan-product check · same deal, 3 products live
Conventional
25% down · 7.5% · 30yr
- Down + closing
- —
- Monthly P&I
- —
- Monthly cashflow
- —
- DSCR
- —
- Eligible?
- —
Personal DTI + credit; lowest rate.
DSCR
20% down · 8.5% · 30yr
- Down + closing
- —
- Monthly P&I
- —
- Monthly cashflow
- —
- DSCR
- —
- Eligible?
- —
No personal income docs; deal must DSCR.
Hard money
10% down · 12.0% · 12mo
- Down + closing
- —
- Monthly P&I
- —
- Monthly cashflow
- —
- DSCR
- —
- Eligible?
- —
Short-term bridge; refi at stabilization.
Listing history 17 events
-
2026-06-19days on market $149,000 Active 2 DOM
-
2026-06-17statusdays on market $149,000 Active 1 DOM
-
2026-04-08status Active
-
2025-11-04$149,000 Active
-
2025-09-29status Active
-
2025-06-23status Active
-
2025-06-23price $169,000
-
2025-05-09price $179,000
-
2024-12-19$199,000 Active
-
2023-07-01$325,000 Active
-
2022-03-01$349,500 Active
-
2020-09-23$349,500
-
2019-04-08soldstatus $275,000
-
2018-10-31$299,000
-
2018-04-23$299,000
-
2014-01-10$450,000
-
2013-06-01$575,000
ⓘ Source: listings_history table (triggers on properties + properties_extension) + one-shot
backfill from property_details.listing_events for pre-trigger history.
Nearby sold comps map
Loading sold comps map…
Walkable amenities ~0.75 mi
Loading nearby amenities…
Taxation est. · year 1
- Rental income
- $12,429
- − Mortgage interest
- −$8,346
- − Property taxes
- −$2,235
- − Insurance
- −$745
- − Repairs & maintenance
- −$994
- − Management
- −$994
- − Depreciation
- −$4,335
- Taxable loss
- −$5,220
- Est. tax savings @ 24.0%
- +$1,253
- After-tax cash flow
- $-1,284/yr
For passive investors: Depreciation is non-cash, so a rental often shows a tax loss while cash-flowing — sheltering income. Rental losses are passive: they offset passive income freely, and up to $25,000/yr can offset ordinary (W-2) income if you actively participate and your MAGI is under $100k (phasing out to $0 by $150k); unused losses carry forward. On sale, claimed depreciation is recaptured at up to 25%, and gains may owe capital-gains tax (a 1031 exchange can defer both). Figures are a year-1 estimate at your 24.0% rate — not tax advice; consult a CPA.
Schools (NCES district)
- District
- Laytonville Unified
- NCES district ID
- 0642580
- Math proficiency
- 25% ▬ 0.00%
- Reading proficiency
- 35% ▲ 5.00%
- Median HH income
- $40,913
- Composite
- 28.15/100
- National rank
- #12198
- State rank
- #1059 of 1400 in CA
Livability — Laytonville
- Score
- 45/100
- State rank
- #1291
- US rank
- #26554
Category grades
Schools grade is shown separately in the Schools card above.
Census & demographics
- Census place
- Laytonville, CA
- Population (ZIP)
- 1,676
Population outlook (Mendocino County) Hauer SSP2
- Today (2025)
- 84,643 people
- By 2030
- 82,138 · -3.0%
- By 2040
- 76,402 · -9.7%
- By 2050
- 71,759 · -15.2%
- By 2075
- 61,454 · -27.4%
- By 2100
- 50,130 · -40.8%
Race, ethnicity, and origin ACS 2023
- Neighborhood character
- Diverse neighborhood (Simpson 0.61)
- Race & ethnicity
- White 61% Two or more races 14% Hispanic / Latino 10% Native American 9% Asian 2% Black 1%
- Hispanic origin (detail)
- Mexican 8%
- Common ancestry
- Scotch-Irish 8% Russian 7% Italian 7%
- Foreign-born
- 2% · Canada
- Languages at home
- 94% English-only · Spanish 5%
Political lean MEDSL · Mendocino
- 2024 margin
- Strong D (+26.8) · D 61.3% · R 34.5% · Other 4.2%
- 2008→2024 swing
- -16.0pp toward R · 2008: 42.8pp · 2024: 26.8pp
- All cycles
- 2024: D+26.8 2020: D+35.8 2016: D+29.1 2012: D+37.6 2008: D+42.8
Not yet ingested
- Civics
- —
Market trends
- HPI YoY
- ▼ -0.64%
- Current HPI
- 134.7591
- Rent YoY
- —
- Metro
- —
- State GDP YoY
- ▲ 3.21%
- F500 in state
- 116
Industry mix (Fortune 500 HQ in CA)
| Industry | F500 HQs | Revenue |
|---|---|---|
| Technology | 27 | $1,492B |
|
||
| Financial Services | 3 | $174B |
|
||
| Retail | 3 | $44B |
|
||
| Insurance | 3 | $26B |
|
||
| Media / Entertainment | 2 | $115B |
|
||
| Pharmaceuticals / Biotech | 2 | $62B |
|
||
Price history
-74.1% since first listed16 events — show timeline
- 2026-06-17 Listed $149,000 BAREIS
- 2026-04-08 Relisted — BAREIS
- 2025-11-04 Listed $149,000 BAREIS
- 2025-09-29 Relisted — BAREIS
- 2025-06-23 Relisted — BAREIS
- 2025-06-23 Price Changed $169,000 BAREIS
- 2025-05-09 Price Changed $179,000 BAREIS
- 2024-12-19 Listed $199,000 BAREIS
- 2023-07-01 Listed $325,000 BAREIS
- 2022-03-01 Listed $349,500 BAREIS
- 2020-09-23 Listed $349,500 BAREIS
- 2019-04-08 Sold (MLS) $275,000 BAREIS
- 2018-10-31 Listed $299,000 BAREIS
- 2018-04-23 Listed $299,000 BAREIS
- 2014-01-10 Listed $450,000 BAREIS
- 2013-06-01 Listed $575,000 BAREIS
Cash-flow waterfall
monthlySold comps — $/sqft
last 12 mo · ≤1 miLoading sold comps…