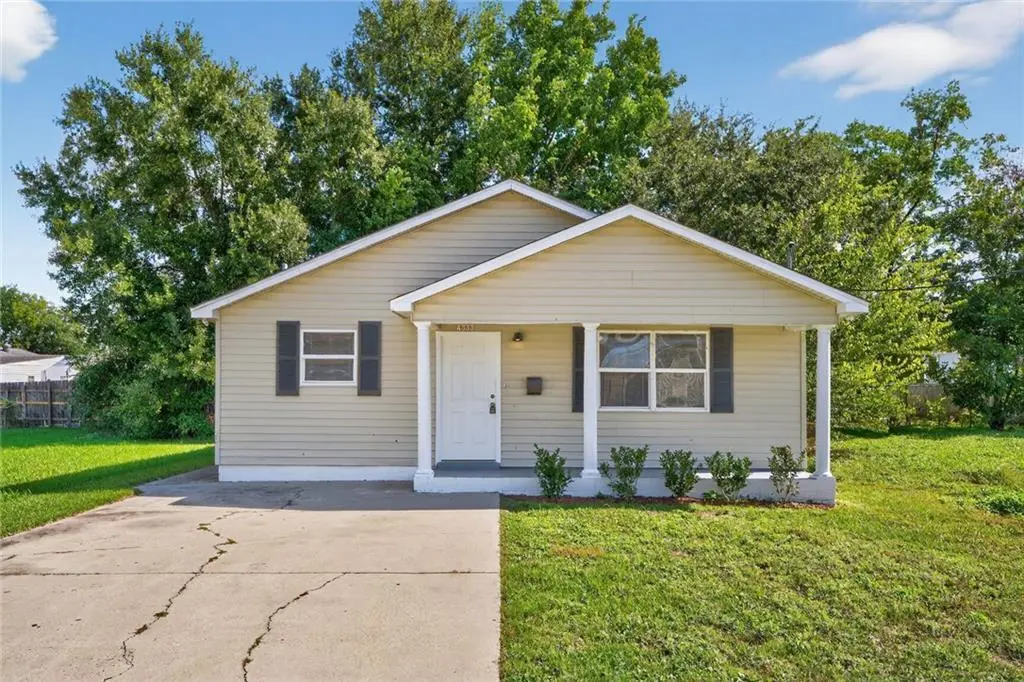
4333 Randolph Ave · New Orleans, LA
Flood risk 8/10 · Major
- FEMA flood zone
- X (shaded)
- Chance of flooding over 30 yrs
- 0.6%
- Est. flood insurance / yr
- $507 – $1,088
Fire risk 1/10 · Minimal
- Est. fire insurance / yr
- $1,269 – $2,357
Heat risk 10/10 · Severe
- Hot days now (above 108°F)
- 7 days/yr
- Hot days in 30 yrs
- 21 days/yr
Wind risk 10/10 · Severe
- Chance of severe wind over 30 yrs
- 99.0%
Air-quality risk 4/10 · Minor
- Unhealthy air days now
- 4 days/yr
- Unhealthy air days in 30 yrs
- 4 days/yr
Risk factors via First Street. Map © Google.
Why this score? — see what drove the C- grade
The composite is a weighted blend of 9 inputs, each scored 0–100. Each bar is that input's sub-score; the figure is the points it added to the 100-point composite (weight × sub-score).
- Cash flow +16.6/30.0
- ARV discount +15.0/15.0
- DSCR +5.2/10.0
- 1% rule +4.1/10.0
- Livability +4.0/5.0
- Condition / age +2.5/5.0
- Rent growth +2.3/5.0
- Schools +1.6/10.0
- Appreciation +0.0/10.0
$225,000
🖨 Deal sheet (PDF) 📄 Offer letter ✓ Due diligence
Listing remarks MLS
This Charming cottage-style home in the highly sought-after Gentility Area is move in ready very warm and inviting atmosphere ! Offers 4 bedrooms 2 full bath , spacious living room , large kitchen with plenty of cabinets great for storage , lots of natural light throughout out the home , central & heat , super cute covered front porch area to sip on your morning coffee or tea. Primary Suite is spacious in size with a on-suite bathroom with a large bathroom with tub/shower combo, Ample off-street parking a must see to appreciate ! This home is has easy access to I-10, Fairgrounds, Downtown, City Park, Bayou St John, LSU Dentistry and just a 9 min ride to the lake and 14 min ride to downtown plus you will be just a few steps away from Mirabeau water garden. Located in a X Flood zone.
Key facts
- Covered front porch
- Easy access to i-10
- 2 parking spots
Tags
Neighborhood map
What this means for you Summary
Snapshot
- This is a 4-bed/2.0-bath single-family listed at $225k.
Deal economics
- At list price, monthly cash flow is $71 ($857/yr) — positive.
- The deal already cash-flows at list — no discount required.
- To meet the 1% rule (rent ≥ 1% of price), the offer needs to be $204k (9.3% below list).
- Recommended offer: $198k (12.0% below list) — sets the bar for market timing.
- Cap rate 7.0% vs local median 4.4% in New Orleans — top-decile yield for the area; either an underpriced asset or a hidden risk that comps aren't pricing in. Stress-test before assuming the spread holds.
Location & tenants
- Location reads 81/100 on livability (#3 in LA, #1,383 nationally) — a professional / high-income tenant draw. Strengths: amenities A+, commute A+, health & safety A+; Watch: crime C-, employment D.
- Orleans Parish (urban): math 11% / reading 27% proficiency, ranked #69 of 98 in LA (top 70%) — low school quality limits family demand, transient renter base, plan for 1-2y turnover; 68% free/reduced lunch — lower-income household profile, screen leases tightly.
- Zoned schools: Benjamin Franklin Elem. Math And Science (math 12% / reading 23%, grade F, #479 of 646 statewide, top 75%, 747 students, 98% FRL, charter) — zoned schools average 98% FRL vs 68% district-wide (30 pts higher); higher-poverty schools than district average — tighter screening recommended.
- Market conditions: Rents soft (-0.6%/yr); 336 active listings in the ZIP; 36 comparable units currently listed for rent nearby; rentals at typical pace (median 19d on market — plan ~3-4 weeks tenant-placement turnaround); 710 units permitted in Orleans Parish in 2024 (244 in 5+ unit buildings).
- At $2,042/mo this rent would consume 50% of the median local household income ($49k/yr) (locally 2150% of renters already pay >50% of income on rent) — very limited rent-growth headroom before tenants either downsize or default.
Forward outlook
- Local home prices are declining (-3.0%/yr); year-one equity from $2k of loan paydown is wiped out by about $7k of value loss. Plan a longer hold.
- Orleans County population projected at +61% by 2050 — long-run rental-demand tailwind backs the buy-and-hold thesis.
Negotiation context
- It's been on market 228 days — a 12% lower offer ($198k) is reasonable based on typical stale-listing flexibility.
- 4 sale attempts since 23y ago with the ask held roughly flat each time — persistent listings suggest the price (not the market) is what's stuck; bring a comps-based counter.
- Current owner paid $15k; list at $225k implies a 1400% gain — meaningful room to come down on a strong offer.
Risks & watch-outs
- Watch-outs: flood insurance adds $66/mo.
- Climate carrying-cost: severe flood risk; severe wind risk, 99% chance of damaging wind over 30y; extreme-heat days projected 7→21/yr by 2055 (HVAC capex compounding) — expect insurance premiums to compound above CPI over the hold.
Questions for the listing agent
- It's been on market 228 days. Have you received any prior offers? Is the seller open to a 12% concession, seller financing, or rate buy-down credit?
- What's the actual annual flood-insurance premium (NFIP or private), and is the property in a SFHA with mandatory coverage?
- Why hasn't it sold? Are there any deal-killer items the seller is aware of (foundation, flood, title, zoning, code violations)?
- Is there a deadline driving the sale (1031 exchange, divorce, estate, relocation)? That informs how much negotiation room exists.
- What's the average days-on-market for RENTAL listings here right now (not sales)? A rising rental-DOM trend means longer vacancies and softer asking-rent achievability than the comps imply.
- What's the recent tenant-quality profile in this submarket — average credit score on applications, eviction rate, late-payment / NSF rate, and stable-employment percentage? A property-management company in the area should have these aggregated.
- How much new for-sale + rental construction is in the pipeline within 1–3 miles? Heavy new supply typically softens prices + rents 12–24 months out; constrained supply supports both.
Investment metrics
- 1% rule
- 0.91% ✗
- Cap rate
- 7.03%
- Cash-on-cash
- 2.63%
- DSCR
- 1.12
- GRM
- 9.2
CMA / ARV
- ARV (median comp)
- $281,145
- List price
- $225,000
- Delta
- -19.97%
- Verdict
- UNDERPRICED
- Comps
- 20 within 1.0 mi
Show comp detail 12 sales within ~0.75 mi
| Address | Dist | Beds/Ba | Sqft | Sold | Price | $/sf | Match |
|---|---|---|---|---|---|---|---|
| 4517 Jeanne Marie Pl | 0.21mi | 3/2.0 (-1) | 1,266 (-3%) | 5mo | $180,000 | $142 | 77 |
| 4301 Jeanne Marie Pl | 0.17mi | 4/2.0 | 1,447 (+11%) | 1mo | $235,000 | $162 | 73 |
| 4417 Duplessis St | 0.12mi | 3/2.0 (-1) | 1,436 (+10%) | 3mo | $205,000 | $143 | 70 |
| 4305 St Bernard Ave | 0.16mi | 3/2.0 (-1) | 1,409 (+8%) | 5mo | $152,000 | $108 | 70 |
| 1319 Granada Dr | 0.43mi | 3/2.0 (-1) | 1,262 (-3%) | 1mo | $225,000 | $178 | 69 |
| 1247 Foy St | 0.39mi | 3/2.0 (-1) | 1,244 (-4%) | 0mo | $40,000 | $32 | 69 |
| 1535 Harrison Ave | 0.26mi | 3/2.0 (-1) | 1,225 (-6%) | 11mo | $204,000 | $167 | 64 |
| 1520 Virginia Marie St | 0.24mi | 4/2.0 | 1,472 (+13%) | 5mo | $160,000 | $109 | 63 |
| 1336 Sere St | 0.59mi | 3/1.0 (-1) | 1,311 (+1%) | 2mo | $90,000 | $69 | 61 |
| 1509 Harcourt Dr | 0.21mi | 3/2.0 (-1) | 1,443 (+11%) | 8mo | $220,000 | $152 | 60 |
| 1486 Mithra St | 0.71mi | 3/2.0 (-1) | 1,293 (-1%) | 11mo | $270,000 | $209 | 52 |
| 1277 Sere St | 0.57mi | 3/2.0 (-1) | 1,487 (+14%) | 7mo | $230,000 | $155 | 39 |
Match score weights: distance 35% · size 25% · config 20% · recency 20%. Top-matched comps best support the ARV.
Projected returns pro-forma
-3.0% appreciation · 0.0% rent growth · sell at horizon
- IRR
- -17.5%
- Equity multiple
- 0.40×
- Total profit
- $-37,872
- Equity at exit
- $33,548
- IRR
- -16.5%
- Equity multiple
- 0.20×
- Total profit
- $-50,153
- Equity at exit
- $19,454
Cash invested: $63,000 (down + closing). Projections, not guarantees.
Landlord ↔ Tenant lean methodology
- Overall (STATE)
- 90 Strongly Landlord-Friendly
- State Louisiana
- 90 Strongly Landlord-Friendly · R+12
- County
- — inherits STATE
- City
- — inherits STATE
ZIP-level market 70122
- Rents YoY
- -0.6%
- Active inventory
- 336
- Price-to-rent
- 9.2×
Monthly cashflow live
- Estimated rent
- $2,042 high interval (Pro) →
- Mortgage (P&I)
- −$1,180
- Tax from tax record
- −$201 /mo · $2,417/yr
- Insurance
- −$94
- Flood insurance flood zone
- −$66 /mo · $798/yr
- HOA
- −$0
- Vacancy / Maint / Mgmt
- −$429
- Net cashflow
- $71
Break-even live
Sensitivity live
| Price | -10% $199 | -5% $135 | +0% $71 | +5% $8 | +10% $-56 |
|---|---|---|---|---|---|
| Rent | -10% $-90 | -5% $-9 | +0% $71 | +5% $152 | +10% $233 |
| Rate | -1.0pp $185 | -0.5pp $129 | base $71 | +0.5pp $13 | +1.0pp $-46 |
UW: 25.0% down · 7.5% · 30yr · 1.5% tax · 5.0% vac · 8.0% maint · 8.0% mgmt
Financing live
Cash to close
- Down payment
- $56,250
- Closing costs
- $6,750
- Reserves months
- —
- Total cash needed
- —
Loan-product check · same deal, 3 products live
Conventional
25% down · 7.5% · 30yr
- Down + closing
- —
- Monthly P&I
- —
- Monthly cashflow
- —
- DSCR
- —
- Eligible?
- —
Personal DTI + credit; lowest rate.
DSCR
20% down · 8.5% · 30yr
- Down + closing
- —
- Monthly P&I
- —
- Monthly cashflow
- —
- DSCR
- —
- Eligible?
- —
No personal income docs; deal must DSCR.
Hard money
10% down · 12.0% · 12mo
- Down + closing
- —
- Monthly P&I
- —
- Monthly cashflow
- —
- DSCR
- —
- Eligible?
- —
Short-term bridge; refi at stabilization.
Rent comps 36 comps
| Address | Beds | Baths | Sqft | Rent | $/sqft | DOM | Units | Dist |
|---|---|---|---|---|---|---|---|---|
| 4229 Buchanan St New Orleans, LA | 3.0 | 2.0 | 1235 | $2,250 | $1.82 | 25d | 1 | 0.15mi |
| 1486 Mandolin St New Orleans, LA | 3.0 | 2.0 | 1497 | $1,900 | $1.27 | 5d | 1 | 0.18mi |
| 4111 Jumonville St New Orleans, LA | 3.0 | 2.5 | 1543 | $2,300 | $1.49 | 12d | 1 | 0.20mi |
| 3622 Buchanan St Unit 3622 New Orleans, LA | 3.0 | 1.0 | 950 | $1,525 | $1.61 | 25d | 1 | 0.56mi |
| 4815 Warrington Dr New Orleans, LA | 3.0 | 2.0 | 1652 | $2,150 | $1.30 | 17d | 1 | 0.72mi |
| 3624 Havana St New Orleans, LA | 3.0 | 1.0 | 1388 | $1,875 | $1.35 | 17d | 1 | 0.73mi |
| 3607 Havana St New Orleans, LA | 3.0 | 2.0 | 1693 | $1,488 | $0.88 | 18d | 1 | 0.77mi |
| 4736 Saint Anthony Ave New Orleans, LA | 3.0 | 1.0 | 1100 | $1,800 | $1.64 | 17d | 1 | 0.90mi |
| 3702 Trafalgar St New Orleans, LA | 3.0 | 2.0 | 1428 | $2,350 | $1.65 | 17d | 1 | 1.01mi |
| 3023 Bruxelles St New Orleans, LA | 3.0 | 1.0 | 960 | $2,200 | $2.29 | 16d | 1 | 1.03mi |
| 3021 Republic St New Orleans, LA | 4.0 | 2.0 | 1125 | $2,200 | $1.96 | 25d | 1 | 1.05mi |
| 5151 Saint Anthony Ave New Orleans, LA | 3.0 | 2.0 | 1200 | $1,795 | $1.50 | 17d | 1 | 1.07mi |
| 3515 Saint Anthony Ave New Orleans, LA | 3.0 | 2.0 | 1366 | $2,500 | $1.83 | 25d | 1 | 1.09mi |
| 2910 Bruxelles St New Orleans, LA | 3.0 | 2.0 | 1074 | $1,600 | $1.49 | 5d | 1 | 1.10mi |
| 5900 Chatham Dr New Orleans, LA | 3.0 | 2.0 | 1864 | $2,500 | $1.34 | 5d | 1 | 1.14mi |
| 2817 Paris Ave New Orleans, LA | 3.0 | 1.0 | 1018 | $1,700 | $1.67 | 22d | 1 | 1.14mi |
| 5322 Saint Anthony Ave New Orleans, LA | 3.0 | 2.0 | 1192 | $2,000 | $1.68 | 17d | 1 | 1.15mi |
| 5716 Warrington Dr New Orleans, LA | 4.0 | 3.0 | 1560 | $2,000 | $1.28 | 18d | 1 | 1.16mi |
| 3907 Elysian Fields Ave New Orleans, LA | 3.0 | 2.0 | 1652 | $3,000 | $1.82 | 25d | 1 | 1.24mi |
| 4618 Marigny St New Orleans, LA | 3.0 | 1.0 | 1320 | $1,900 | $1.44 | 25d | 1 | 1.26mi |
| 2338 40 Annette St New Orleans, LA | 3.0 | 1.0 | 1150 | $1,385 | $1.20 | 22d | 1 | 1.31mi |
| 1818 Paul Morphy St Unit B New Orleans, LA | 3.0 | 2.0 | 1065 | $1,800 | $1.69 | 25d | 1 | 1.33mi |
| 5546 Pasteur Blvd Unit A New Orleans, LA | 3.0 | 1.0 | 1200 | $1,400 | $1.17 | 25d | 1 | 1.35mi |
| 2632 Oreilly St New Orleans, LA | 3.0 | 1.5 | 950 | $1,450 | $1.53 | 25d | 1 | 1.36mi |
| 2310 George Nick Connor Dr New Orleans, LA | 3.0 | 2.0 | 1050 | $1,600 | $1.52 | 25d | 1 | 1.37mi |
| 1933 Industry St New Orleans, LA | 3.0 | 2.0 | 1400 | $1,595 | $1.14 | 17d | 1 | 1.37mi |
| 3327 Elysian Fields Ave New Orleans, LA | 3.0 | 1.0 | 1200 | $1,300 | $1.08 | 25d | 1 | 1.40mi |
| 3443 Esplanade Ave New Orleans, LA | 3.0 | 1.0–2.0 | 997 | $2,500 | $2.51 | 4d | 30 | 1.41mi |
| 2817 Annette St New Orleans, LA | 3.0 | 1.0 | 1100 | $1,350 | $1.23 | 25d | 1 | 1.42mi |
| 5723 Pasteur Blvd New Orleans, LA | 3.0 | 2.0 | 1150 | $1,700 | $1.48 | 18d | 1 | 1.45mi |
| 1903 Rosary Dr New Orleans, LA | 3.0 | 2.0 | 1500 | $1,800 | $1.20 | 25d | 1 | 1.46mi |
| 5718 Vermillion Blvd Unit A New Orleans, LA | 3.0 | 1.0 | 1300 | $2,000 | $1.54 | 25d | 1 | 1.46mi |
| 1996 Hope St New Orleans, LA | 3.0 | 1.0 | 910 | $1,550 | $1.70 | 5d | 1 | 1.48mi |
| 6838 Orleans Ave New Orleans, LA | 3.0 | 2.0 | 1568 | $2,400 | $1.53 | 25d | 1 | 1.49mi |
| 2152 Abundance St Unit 2152 New Orleans, LA | 3.0 | 2.0 | 1100 | $1,599 | $1.45 | 5d | 1 | 1.50mi |
| 6431 Marshal Foch St New Orleans, LA | 3.0 | 2.0 | 1600 | $2,100 | $1.31 | 4d | 1 | 1.50mi |
Listing history 21 events
-
2026-06-21days on market $225,000 Active 228 DOM
-
2026-06-18days on market $225,000 Active 225 DOM
-
2026-06-17days on market $225,000 Active 224 DOM
-
2026-06-16days on market $225,000 Active 223 DOM
-
2026-06-15days on market $225,000 Active 222 DOM
-
2026-06-13days on market $225,000 Active 220 DOM
-
2026-06-10days on market $225,000 Active 217 DOM
-
2026-06-09days on market $225,000 Active 216 DOM
-
2026-06-08days on market $225,000 Active 215 DOM
-
2026-06-07days on market $225,000 Active 214 DOM
-
2026-06-05days on market $225,000 Active 211 DOM
-
2026-06-03days on market $225,000 Active 210 DOM
-
2026-06-02days on market $225,000 Active 209 DOM
-
2026-06-01days on market $225,000 Active 208 DOM
-
2026-05-31days on market $225,000 Active 207 DOM
-
2025-11-04$225,000 Active 801-char remark
Show marketing remark (796 chars)
This Charming cottage-style home in the highly sought-after Gentility Area is move in ready very warm and inviting atmosphere ! Offers 4 bedrooms 2 full bath , spacious living room , large kitchen with plenty of cabinets great for storage , lots of natural light throughout out the home , central & heat , super cute covered front porch area to sip on your morning coffee or tea. Primary Suite is spacious in size with a on-suite bathroom with a large bathroom with tub/shower combo, Ample off-street parking a must see to appreciate ! This home is has easy access to I-10, Fairgrounds, Downtown, City Park, Bayou St John, LSU Dentistry and just a 9 min ride to the lake and 14 min ride to downtown plus you will be just a few steps away from Mirabeau water garden. Located in a X Flood zone.
-
2025-11-04$225,000 Active 796-char remark
Show marketing remark (796 chars)
This Charming cottage-style home in the highly sought-after Gentility Area is move in ready very warm and inviting atmosphere ! Offers 4 bedrooms 2 full bath , spacious living room , large kitchen with plenty of cabinets great for storage , lots of natural light throughout out the home , central & heat , super cute covered front porch area to sip on your morning coffee or tea. Primary Suite is spacious in size with a on-suite bathroom with a large bathroom with tub/shower combo, Ample off-street parking a must see to appreciate ! This home is has easy access to I-10, Fairgrounds, Downtown, City Park, Bayou St John, LSU Dentistry and just a 9 min ride to the lake and 14 min ride to downtown plus you will be just a few steps away from Mirabeau water garden. Located in a X Flood zone.
-
2008-07-28soldstatus $15,000
-
2003-07-22soldstatus $72,000
-
2003-06-06$83,500
-
2003-06-06$83,500
ⓘ Source: listings_history table (triggers on properties + properties_extension) + one-shot
backfill from property_details.listing_events for pre-trigger history.
Tax reassessment forecast LA · Resets to sale price
- Current annual tax
- $2,417 · $201/mo
- Projected year-2 tax
- $2,417 · $201/mo
- Expected delta
- $0/yr ($0/mo · 0.0%)
ⓘ Screening estimate from a state-policy table — verify with the county assessor before closing.
Climate risk First Street
- Flood 8/10 Severe FEMA zone X (shaded) · 60% chance over 30 yrs
- Wildfire 1/10 Low
- Heat 10/10 Extreme 7 d/yr ≥108°F today · 21 d/yr by 30 yrs out
- Wind 10/10 Extreme 99% chance of damaging wind over 30 yrs
- Air quality 4/10 Moderate 4 unhealthy d/yr today · 4 by 30 yrs out
Nearby sold comps map
Loading sold comps map…
Walkable amenities ~0.75 mi
Loading nearby amenities…
Taxation est. · year 1
- Rental income
- $24,501
- − Mortgage interest
- −$12,603
- − Property taxes
- −$2,417
- − Insurance
- −$1,922
- − Repairs & maintenance
- −$1,960
- − Management
- −$1,960
- − Depreciation
- −$6,545
- Taxable loss
- −$2,908
- Est. tax savings @ 24.0%
- +$698
- After-tax cash flow
- $1,555/yr
For passive investors: Depreciation is non-cash, so a rental often shows a tax loss while cash-flowing — sheltering income. Rental losses are passive: they offset passive income freely, and up to $25,000/yr can offset ordinary (W-2) income if you actively participate and your MAGI is under $100k (phasing out to $0 by $150k); unused losses carry forward. On sale, claimed depreciation is recaptured at up to 25%, and gains may owe capital-gains tax (a 1031 exchange can defer both). Figures are a year-1 estimate at your 24.0% rate — not tax advice; consult a CPA.
Schools (NCES district)
- District
- Orleans Parish
- NCES district ID
- 2201170
- Math proficiency
- 11% ▼ -52.00%
- Reading proficiency
- 27% ▼ -46.00%
- Median HH income
- $37,011
- Composite
- 15.78/100
- National rank
- #9271
- State rank
- #69 of 98 in LA
Livability — New Orleans
- Score
- 81/100
- State rank
- #3
- US rank
- #1383
Category grades
Schools grade is shown separately in the Schools card above.
Census & demographics
- Census place
- New Orleans, LA
- County
- Orleans Parish · 338,817 people
- City population
- 338,817
- Metro
- New Orleans-Metairie, LA
- Population (ZIP)
- 35,253
- Household income
- $49,455
- Rent vs Own
- Severe rent burden
- 2150.0
Population outlook (Orleans County) Hauer SSP2
- Today (2025)
- 513,025 people
- By 2030
- 575,781 · +12.2%
- By 2040
- 700,174 · +36.5%
- By 2050
- 826,541 · +61.1%
- By 2075
- 1,123,374 · +119.0%
- By 2100
- 1,355,609 · +164.2%
Race, ethnicity, and origin ACS 2023
- Neighborhood character
- Predominantly Black (69%)
- Race & ethnicity
- Black 69% White 18% Two or more races 7% Hispanic / Latino 6% Asian 1%
- Hispanic origin (detail)
- Mexican 1%
- Common ancestry
- Lithuanian 4% Italian 2% Slovak 1%
- Foreign-born
- 4% · Canada, China
- Languages at home
- 92% English-only · Spanish 5% Chinese 1% French/Haitian/Cajun 1%
Political lean MEDSL · Orleans
- 2024 margin
- Solid D (+67.0) · D 82.2% · R 15.2% · Other 2.7%
- 2008→2024 swing
- +6.7pp toward D · 2008: 60.3pp · 2024: 67.0pp
- All cycles
- 2024: D+67.0 2020: D+68.2 2016: D+66.2 2012: D+62.5 2008: D+60.3
Not yet ingested
- Civics
- —
Market trends
- HPI YoY
- ▼ -222.37%
- Current HPI
- 231.9921
- Rent YoY
- ▼ -0.61%
- Metro
- New Orleans-Metairie, LA
- State GDP YoY
- ▲ 3.29%
- F500 in state
- 10
Industry mix (Fortune 500 HQ in LA)
| Industry | F500 HQs | Revenue |
|---|---|---|
| Telecommunications | 2 | $23B |
|
||
| Utilities | 1 | $12B |
|
||
| Wholesale / Distribution | 1 | $5B |
|
||
| Advertising | 1 | $2B |
|
||
Price history
+169.5% since first listed6 events — show timeline
- 2025-11-04 Listed $225,000 AcadianaMLS
- 2025-11-04 Listed $225,000 GSREIN
- 2008-07-28 Sold (Public Records) $15,000 Public Records
- 2003-07-22 Sold (MLS) $72,000 GSREIN
- 2003-06-06 Listed $83,500 AcadianaMLS
- 2003-06-06 Listed $83,500 GSREIN
Property tax history
+3.4%/yrLatest (2026): $2,417 · +1.1% YoY. Source: county tax records.
Cash-flow waterfall
monthlySold comps — $/sqft
last 12 mo · ≤1 miLoading sold comps…