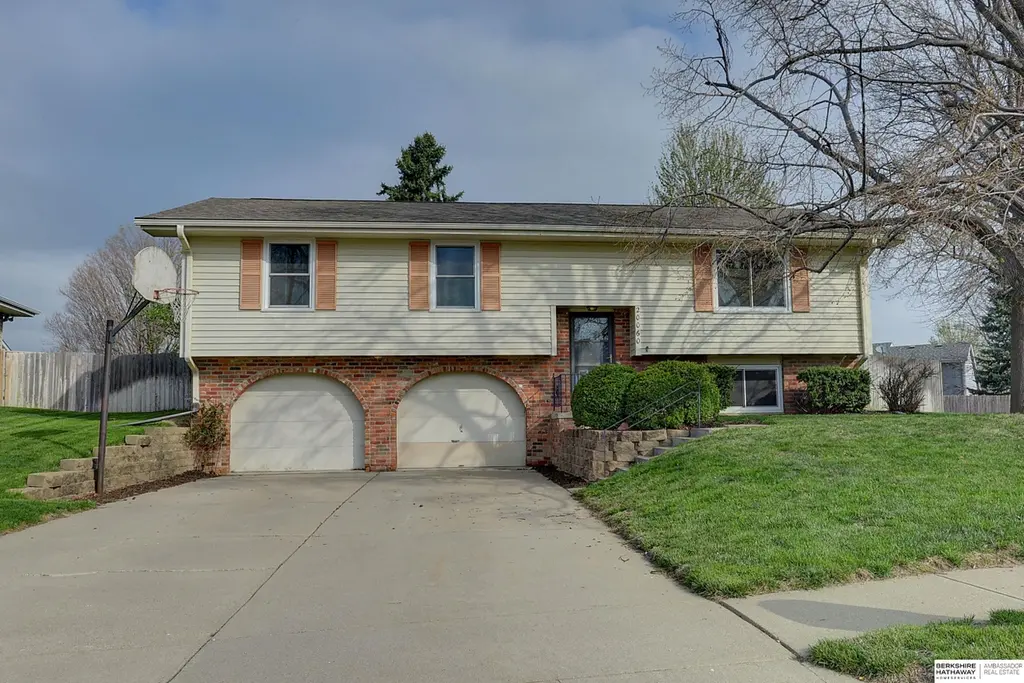
20060 Wirt St · Omaha, NE
Flood risk 1/10 · Minimal
- FEMA flood zone
- X (unshaded)
- Chance of flooding over 30 yrs
- 0.0%
- Est. flood insurance / yr
- $473 – $860
Fire risk 1/10 · Minimal
- Est. fire insurance / yr
- $1,161 – $2,155
Heat risk 3/10 · Minor
- Hot days now (above 103°F)
- 7 days/yr
- Hot days in 30 yrs
- 16 days/yr
Wind risk 2/10 · Minimal
- Chance of severe wind over 30 yrs
- —
Air-quality risk 1/10 · Minimal
- Unhealthy air days now
- 0 days/yr
- Unhealthy air days in 30 yrs
- 0 days/yr
Risk factors via First Street. Map © Google.
Why this score? — see what drove the D grade
The composite is a weighted blend of 9 inputs, each scored 0–100. Each bar is that input's sub-score; the figure is the points it added to the 100-point composite (weight × sub-score).
- Cash flow +9.9/30.0
- ARV discount +7.5/15.0
- Schools +6.9/10.0
- Livability +4.2/5.0
- Rent growth +3.6/5.0
- 1% rule +2.8/10.0
- DSCR +2.8/10.0
- Condition / age +2.5/5.0
- Appreciation +0.0/10.0
$299,999
🖨 Deal sheet (PDF) 📄 Offer letter ✓ Due diligence
Listing remarks MLS
Freshly painted & updated. Wonderful home 2 blocks from elementary school. Many updates. Huge eat in kitchen. Mature landscaping. Large bedrooms & easy occupancy. Seller flexable.
Key facts
- Large eat in kitchen
- Newer vinyl windows
- Fully fenced in yard
Tags
Neighborhood map
What this means for you Summary
Snapshot
- This is a 3-bed/2.5-bath other listed at $300k.
Deal economics
- At list price, monthly cash flow is $-185 ($-2k/yr) — negative.
- To cash-flow at today's rent, offer at most $267k (10.9% below list).
- To meet the 1% rule (rent ≥ 1% of price), the offer needs to be $233k (22.4% below list).
- Recommended offer: $233k (22.4% below list) — sets the bar for 1% rule.
- Cap rate 5.6% vs local median 3.6% in Omaha — top-decile yield for the area; either an underpriced asset or a hidden risk that comps aren't pricing in. Stress-test before assuming the spread holds.
Location & tenants
- Location reads 84/100 on livability (#7 in NE, #663 nationally) — a professional / high-income tenant draw. Strengths: amenities A+, commute A+, cost of living A+; Watch: crime F.
- Elkhorn Public Schools (urban): math 77% / reading 76% proficiency, ranked #1 of 111 in NE (top 1%) — strong family-tenant draw, lease renewals of 3-5y typical; only 5% free/reduced lunch — higher-income household profile.
- Zoned schools: Hillrise Elementary School (math 67% / reading 77%, grade A-, #27 of 502 statewide, top 7%, 341 students, 23% FRL); Elkhorn Middle School (math 68% / reading 61%, grade A-, #10 of 128 statewide, top 8%, 607 students, 20% FRL); Elkhorn High School (math 77% / reading 72%, grade B+, #10 of 261 statewide, top 4%, 741 students, 16% FRL).
- Market conditions: Rents rising fast (+4.2%/yr); 793 active listings in the ZIP; 10 comparable units currently listed for rent nearby; rentals leasing fast (median 3d on market — plan ~1-2 weeks tenant-placement turnaround); high-income renter base; 4,539 units permitted in Douglas County in 2024 (2,583 in 5+ unit buildings).
Forward outlook
- Local home prices are declining (-3.0%/yr); year-one equity from $2k of loan paydown is wiped out by about $9k of value loss. Plan a longer hold.
- Douglas County population projected at +28% by 2050 — long-run rental-demand tailwind backs the buy-and-hold thesis.
Negotiation context
- Only 10 days on market — expect competitive offers; lowballing is unlikely to land.
- 2 sale attempts since 13y ago with the ask held roughly flat each time — persistent listings suggest the price (not the market) is what's stuck; bring a comps-based counter.
- Current owner paid $142k; list at $300k implies a 111% gain — meaningful room to come down on a strong offer.
Questions for the listing agent
- What do current leases actually rent for vs. the listed asking? Can we see a recent rent roll and the last 12 months of T-12 income?
- Built in 1975 — when were the roof, HVAC, electrical panel, plumbing, and water heater last replaced?
- Is there a deadline driving the sale (1031 exchange, divorce, estate, relocation)? That informs how much negotiation room exists.
- Crime grade is F in this area — have there been break-ins, vandalism, or insurance claims at this property in the last 3 years? What carrier currently insures it and at what premium?
- The area grade is low — what's the realistic commute time and amenity access for the typical tenant pool here? Any planned neighborhood developments (good or bad) we should know about?
- What's the average days-on-market for RENTAL listings here right now (not sales)? A rising rental-DOM trend means longer vacancies and softer asking-rent achievability than the comps imply.
- What's the recent tenant-quality profile in this submarket — average credit score on applications, eviction rate, late-payment / NSF rate, and stable-employment percentage? A property-management company in the area should have these aggregated.
- How much new for-sale + rental construction is in the pipeline within 1–3 miles? Heavy new supply typically softens prices + rents 12–24 months out; constrained supply supports both.
Investment metrics
- 1% rule
- 0.78% ✗
- Cap rate
- 5.55%
- Cash-on-cash
- -2.65%
- DSCR
- 0.88
- GRM
- 10.7
CMA / ARV
No comps found within radius.
Projected returns pro-forma
-3.0% appreciation · 4.25% rent growth · sell at horizon
- IRR
- -19.4%
- Equity multiple
- 0.32×
- Total profit
- $-57,444
- Equity at exit
- $44,731
- IRR
- -9.7%
- Equity multiple
- 0.37×
- Total profit
- $-52,725
- Equity at exit
- $25,938
Cash invested: $84,000 (down + closing). Projections, not guarantees.
Landlord ↔ Tenant lean methodology
- Overall (STATE)
- 83 Strongly Landlord-Friendly
- State Nebraska
- 83 Strongly Landlord-Friendly · R+13
- County
- — inherits STATE
- City
- — inherits STATE
ZIP-level market 68022
- Home prices YoY
- -33.9%
- Rents YoY
- 4.2%
- Active inventory
- 793
- Price-to-rent
- 10.7×
Monthly cashflow live
- Estimated rent
- $2,327 high interval (Pro) →
- Mortgage (P&I)
- −$1,573
- Tax from tax record
- −$325 /mo · $3,900/yr
- Insurance
- −$125
- HOA
- −$0
- Vacancy / Maint / Mgmt
- −$489
- Net cashflow
- $-185
Break-even live
Sensitivity live
| Price | -10% $-15 | -5% $-100 | +0% $-185 | +5% $-270 | +10% $-355 |
|---|---|---|---|---|---|
| Rent | -10% $-369 | -5% $-277 | +0% $-185 | +5% $-93 | +10% $-1 |
| Rate | -1.0pp $-34 | -0.5pp $-109 | base $-185 | +0.5pp $-263 | +1.0pp $-342 |
UW: 25.0% down · 7.5% · 30yr · 1.5% tax · 5.0% vac · 8.0% maint · 8.0% mgmt
Financing live
Cash to close
- Down payment
- $75,000
- Closing costs
- $9,000
- Reserves months
- —
- Total cash needed
- —
Loan-product check · same deal, 3 products live
Conventional
25% down · 7.5% · 30yr
- Down + closing
- —
- Monthly P&I
- —
- Monthly cashflow
- —
- DSCR
- —
- Eligible?
- —
Personal DTI + credit; lowest rate.
DSCR
20% down · 8.5% · 30yr
- Down + closing
- —
- Monthly P&I
- —
- Monthly cashflow
- —
- DSCR
- —
- Eligible?
- —
No personal income docs; deal must DSCR.
Hard money
10% down · 12.0% · 12mo
- Down + closing
- —
- Monthly P&I
- —
- Monthly cashflow
- —
- DSCR
- —
- Eligible?
- —
Short-term bridge; refi at stabilization.
Rent comps 10 comps
| Address | Beds | Baths | Sqft | Rent | $/sqft | DOM | Units | Dist |
|---|---|---|---|---|---|---|---|---|
| 19910 Lake Plz Elkhorn, NE | 1.0–3.0 | 1.0–2.5 | 1401 | $2,693 | $1.92 | 3d | 13 | 0.25mi |
| 17551 Pinkney St Omaha, NE | 1.0–3.0 | 1.0–2.0 | 1024 | $2,010 | $1.96 | 3d | 23 | 0.27mi |
| 1999 Veterans Dr Elkhorn, NE | 1.0–3.0 | 1.0–2.0 | 1015 | $2,950 | $2.90 | 3d | 9 | 0.74mi |
| 1702 N 205th St Elkhorn, NE | 3.0 | 2.5 | 1452 | $2,028 | $1.40 | 3d | 8 | 0.94mi |
| 3333 N 212th Avenue Plz Elkhorn, NE | 3.0 | 1.0–2.0 | 1113 | $2,926 | $2.63 | 3d | 13 | 0.98mi |
| 4115 N 213th Cir Elkhorn, NE | 3.0 | 1.0 | 1628 | $1,900 | $1.17 | 4d | 1 | 1.24mi |
| 19111 Grand Ave Elkhorn, NE | 4.0–5.0 | 2.0–3.5 | 1882 | $2,424 | $1.29 | 3d | 1 | 1.29mi |
| 1011 N 192nd Ct Apt 115 Elkhorn, NE | 3.0 | 2.0 | 1469 | $1,995 | $1.36 | 25d | 1 | 1.37mi |
| 1011 N 192nd Ct Apt 103 Elkhorn, NE | 3.0 | 2.0 | 1469 | $1,895 | $1.29 | 25d | 1 | 1.37mi |
| 1010 N 192nd St Elkhorn, NE | 3.0 | 1.0–2.5 | 1135 | $2,195 | $1.93 | 4d | 19 | 1.39mi |
Listing history 7 events
-
2026-04-27status Pending
-
2026-04-21price $299,999
-
2026-04-17$315,000 New
-
2013-08-07soldstatus $142,000
-
2013-08-02soldstatus $142,000 187-char remark
Show marketing remark (187 chars)
Freshly painted & updated. Wonderful home 2 blocks from elementary school. Many updates. Huge eat in kitchen. Mature landscaping. Large bedrooms & easy occupancy. Seller flexable.
-
2013-05-30historical 187-char remark
Show marketing remark (187 chars)
Freshly painted & updated. Wonderful home 2 blocks from elementary school. Many updates. Huge eat in kitchen. Mature landscaping. Large bedrooms & easy occupancy. Seller flexable.
-
2013-05-23$149,900 187-char remark
Show marketing remark (187 chars)
Freshly painted & updated. Wonderful home 2 blocks from elementary school. Many updates. Huge eat in kitchen. Mature landscaping. Large bedrooms & easy occupancy. Seller flexable.
ⓘ Source: listings_history table (triggers on properties + properties_extension) + one-shot
backfill from property_details.listing_events for pre-trigger history.
Tax reassessment forecast NE · Resets to sale price
- Current annual tax
- $3,900 · $325/mo
- Projected year-2 tax
- $5,190 · $432/mo
- Expected delta
- +$1,290/yr (+$107/mo · 33.1%)
ⓘ Screening estimate from a state-policy table — verify with the county assessor before closing.
Climate risk First Street
- Flood 1/10 Low FEMA zone X (unshaded) · 0% chance over 30 yrs
- Wildfire 1/10 Low
- Heat 3/10 Moderate 7 d/yr ≥103°F today · 16 d/yr by 30 yrs out
- Wind 2/10 Low
- Air quality 1/10 Low 0 unhealthy d/yr today · 0 by 30 yrs out
Nearby sold comps map
Loading sold comps map…
Walkable amenities ~0.75 mi
Loading nearby amenities…
Taxation est. · year 1
- Rental income
- $27,919
- − Mortgage interest
- −$16,805
- − Property taxes
- −$3,900
- − Insurance
- −$1,500
- − Repairs & maintenance
- −$2,234
- − Management
- −$2,234
- − Depreciation
- −$8,727
- Taxable loss
- −$7,480
- Est. tax savings @ 24.0%
- +$1,795
- After-tax cash flow
- $-428/yr
For passive investors: Depreciation is non-cash, so a rental often shows a tax loss while cash-flowing — sheltering income. Rental losses are passive: they offset passive income freely, and up to $25,000/yr can offset ordinary (W-2) income if you actively participate and your MAGI is under $100k (phasing out to $0 by $150k); unused losses carry forward. On sale, claimed depreciation is recaptured at up to 25%, and gains may owe capital-gains tax (a 1031 exchange can defer both). Figures are a year-1 estimate at your 24.0% rate — not tax advice; consult a CPA.
Schools (NCES district)
- District
- Elkhorn Public Schools
- NCES district ID
- 3170110
- Math proficiency
- 77% ▼ -7.00%
- Reading proficiency
- 76% ▼ -6.00%
- Median HH income
- $96,478
- Composite
- 69.21/100
- National rank
- #318
- State rank
- #1 of 111 in NE
Livability — Omaha
- Score
- 84/100
- State rank
- #7
- US rank
- #663
Category grades
Schools grade is shown separately in the Schools card above.
Census & demographics
- Census place
- Omaha, NE
- County
- Douglas County · 538,646 people
- City population
- 552,986
- Metro
- Omaha-Council Bluffs, NE-IA
- Population (ZIP)
- 36,538
- Household income
- $148,111
- Rent vs Own
- Severe rent burden
- 651.0
Population outlook (Douglas County) Hauer SSP2
- Today (2025)
- 625,245 people
- By 2030
- 661,613 · +5.8%
- By 2040
- 732,395 · +17.1%
- By 2050
- 801,988 · +28.3%
- By 2075
- 968,637 · +54.9%
- By 2100
- 1,101,871 · +76.2%
Race, ethnicity, and origin ACS 2023
- Neighborhood character
- Predominantly White (87%)
- Race & ethnicity
- White 87% Two or more races 6% Asian 4% Hispanic / Latino 4% Black 1%
- Common ancestry
- Portuguese 3% Romanian 3% Iranian 2%
- Foreign-born
- 5% · Canada, China
- Languages at home
- 94% English-only · Other Indo-European 1% Other Asian/Pacific 1% Spanish 1%
Political lean MEDSL · Douglas
- 2024 margin
- D (+10.2) · D 54.4% · R 44.2% · Other 1.4%
- 2008→2024 swing
- +5.5pp toward D · 2008: 4.6pp · 2024: 10.2pp
- All cycles
- 2024: D+10.2 2020: D+11.3 2016: D+1.4 2012: R+4.3 2008: D+4.6
Not yet ingested
- Civics
- —
Market trends
- HPI YoY
- ▼ -102.67%
- Current HPI
- 200.1245
- Rent YoY
- ▲ 4.25%
- Metro
- Omaha-Council Bluffs, NE-IA
- State GDP YoY
- ▲ 0.68%
- F500 in state
- 2
Industry mix (Fortune 500 HQ in NE)
| Industry | F500 HQs | Revenue |
|---|---|---|
| Conglomerate | 1 | $371B |
|
||
Price history
+100.1% since first listed7 events — show timeline
- 2026-04-27 Pending — GPRMLS
- 2026-04-21 Price Changed $299,999 GPRMLS
- 2026-04-17 Listed $315,000 GPRMLS
- 2013-08-07 Sold (Public Records) $142,000 Public Records
- 2013-08-02 Sold (MLS) $142,000 GPRMLS
- 2013-05-30 Listing Removed — GPRMLS
- 2013-05-23 Listed $149,900 GPRMLS
Property tax history
+2.8%/yrLatest (2025): $3,900 · +10.3% YoY. Source: county tax records.
Cash-flow waterfall
monthlySold comps — $/sqft
last 12 mo · ≤1 miLoading sold comps…