2703 38th St SW · Lehigh Acres, FL
Flood risk 1/10 · Minimal
- FEMA flood zone
- X (unshaded)
- Chance of flooding over 30 yrs
- 0.0%
- Est. flood insurance / yr
- $507 – $1,088
Fire risk 4/10 · Minor
- Est. fire insurance / yr
- $947 – $1,759
Heat risk 10/10 · Severe
- Hot days now (above 107°F)
- 7 days/yr
- Hot days in 30 yrs
- 29 days/yr
Wind risk 10/10 · Severe
- Chance of severe wind over 30 yrs
- 99.0%
Air-quality risk 2/10 · Minimal
- Unhealthy air days now
- 1 days/yr
- Unhealthy air days in 30 yrs
- 1 days/yr
Risk factors via First Street. Map © Google.
Why this score? — see what drove the C+ grade
The composite is a weighted blend of 9 inputs, each scored 0–100. Each bar is that input's sub-score; the figure is the points it added to the 100-point composite (weight × sub-score).
- Cash flow +15.4/30.0
- ARV discount +15.0/15.0
- Appreciation +10.0/10.0
- DSCR +4.7/10.0
- Schools +4.1/10.0
- 1% rule +4.0/10.0
- Livability +3.0/5.0
- Condition / age +2.5/5.0
- Rent growth +2.1/5.0
$239,900
🖨 Deal sheet (PDF) 📄 Offer letter ✓ Due diligence
Listing remarks MLS
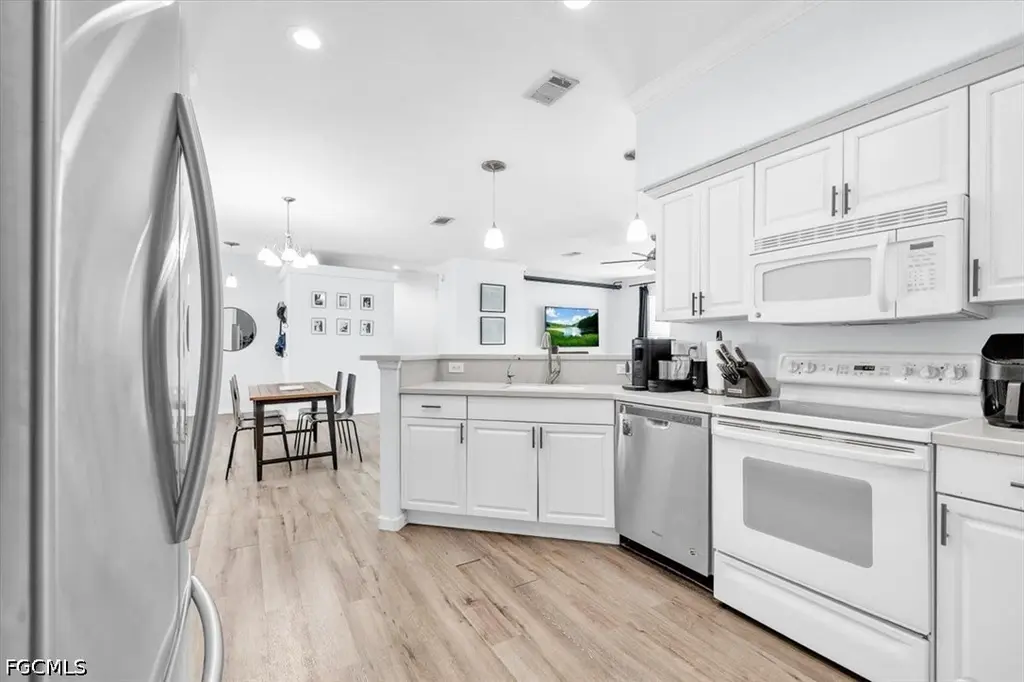
Take a look at this great 3/2 split plan home with a fully fenced yard, large 2 car garage, and a fabulous liveable SHED!! The open concept living room, dining area, and kitchen feels so much larger with the high ceilings with crown molding and 8 ft. doors leading to the other rooms. Home sits at the end of the street, so traffic is non-existent. The 10’ by 16’ climate controlled SHED is already set up with electric, lighting, windows, a/c unit and ceiling fans. It is ready for your craft room, wood shop, in law quarters, or perfect private get away. The garage has 12 foot ceiling heights to accompany extra storage or a vehicle lift. In residence laundry. Roof shingled-2018, Water heater-2013, A/C-2012, Water system and R/O-2011. Plenty of room for a pool.
Key facts
- Private gym
- Split-plan home
- Fully fenced yard
Tags
Property features AI
Finance
- Other: Zoned RS-1; Rectangular lot (approx. 0.25 acre, 80 x 135 x 80 x 135); Publicly maintained paved road
- Financial info: Pets allowed
- HOA & community: Non-gated community; No association fee listed
Exterior
- Parking: Attached 2-car garage with garage door opener; 2 covered parking spaces
- Security: Smoke detectors
- Utilities: Well water; Septic tank; High-speed internet available; Cable not available
- Home design: Single-story home; Resale property; North-facing front; South exposure
- Construction: Vinyl siding with wood frame construction; Shingle roof; Built on standard foundation
- Exterior features: Fenced yard; Room for a pool; Outbuilding
Interior
- Kitchen: Electric cooktop; Dishwasher; Refrigerator; Freezer; Breakfast bar; Eat-in kitchen; Reverse osmosis system
- Bedrooms: Main level primary; Additional bedroom(s) on main level
- Flooring: Vinyl flooring
- Bathrooms: 2 full bathrooms; Separate shower(s); Shower-only configuration in at least one bathroom; Dual sinks
- Heating & cooling: Central electric heating; Central electric air conditioning
- Interior features: Breakfast bar; Eat-in kitchen; Family/Dining room; Living/Dining room; Main-level primary bedroom; Bedroom on main level; Dual sinks; Separate shower (shower only); Split bedroom layout; Single-hung windows; Unfurnished; Vinyl flooring; Reverse osmosis system
- Laundry & utility: Washer; Dryer; Indoor laundry
Neighborhood map
What this means for you Summary
Snapshot
- This is a 3-bed/2.0-bath single-family listed at $240k.
Deal economics
- At list price, monthly cash flow is $92 ($1k/yr) — positive.
- The deal already cash-flows at list — no discount required.
- To meet the 1% rule (rent ≥ 1% of price), the offer needs to be $215k (10.3% below list).
- Recommended offer: $215k (10.3% below list) — sets the bar for 1% rule.
- Cap rate 6.8% vs local median 4.7% in Lehigh Acres — top-decile yield for the area; either an underpriced asset or a hidden risk that comps aren't pricing in. Stress-test before assuming the spread holds.
Location & tenants
- Location reads 59/100 on livability (#826 in FL) — a working-class tenant base; expect higher turnover. Strengths: cost of living A+, housing A+; Watch: crime C-, employment D+, schools D-.
- Lee (suburban): math 47% / reading 50% proficiency, ranked #42 of 73 in FL (top 58%) — families likely to look elsewhere, expect single-tenant / working-renter base with shorter leases.
- Market conditions: Rents soft (-1.5%/yr); 788 active listings in the ZIP; 40 comparable units currently listed for rent nearby; rentals at typical pace (median 18d on market — plan ~3-4 weeks tenant-placement turnaround); 15,411 units permitted in Lee County in 2024 (4,686 in 5+ unit buildings).
- This rent runs 36% of the median local income ($73k/yr) — at the standard rent-burdened threshold; future hikes will face affordability resistance.
Forward outlook
- In year one you build about $26k of equity ($2k loan paydown + $24k appreciation (10.0% local appreciation)).
- Lee County population projected at +44% by 2050 — long-run rental-demand tailwind backs the buy-and-hold thesis.
- At projected returns (10.0% appreciation + 0.0% rent growth), your $67k cash investment doubles in ~3 years — after that, you're playing with house money.
- By year 2, paydown + projected appreciation supports a ~$41k cash-out refi (75% LTV) — recoverable capital for the next deal without selling this one.
Negotiation context
- It's been on market 16 days — a 2% lower offer ($236k) is reasonable based on typical stale-listing flexibility.
- 3 sale attempts since 7y ago with the ask held roughly flat each time — persistent listings suggest the price (not the market) is what's stuck; bring a comps-based counter.
Risks & watch-outs
- Climate carrying-cost: severe wind risk, 99% chance of damaging wind over 30y; extreme-heat days projected 7→29/yr by 2055 (HVAC capex compounding) — expect insurance premiums to compound above CPI over the hold.
Questions for the listing agent
- Is there a deadline driving the sale (1031 exchange, divorce, estate, relocation)? That informs how much negotiation room exists.
- Schools are D-rated, which usually means shorter tenancies and higher turnover. Who's the typical renter profile here, and what's been the actual vacancy rate?
- What's the average days-on-market for RENTAL listings here right now (not sales)? A rising rental-DOM trend means longer vacancies and softer asking-rent achievability than the comps imply.
- What's the recent tenant-quality profile in this submarket — average credit score on applications, eviction rate, late-payment / NSF rate, and stable-employment percentage? A property-management company in the area should have these aggregated.
- How much new for-sale + rental construction is in the pipeline within 1–3 miles? Heavy new supply typically softens prices + rents 12–24 months out; constrained supply supports both.
Investment metrics
- 1% rule
- 0.90% ✗
- Cap rate
- 6.75%
- Cash-on-cash
- 1.65%
- DSCR
- 1.07
- GRM
- 9.3
CMA / ARV
- ARV (on-the-fly)
- $310,440
- Comps found
- 12
Show comp detail 12 sales within ~0.75 mi
| Address | Dist | Beds/Ba | Sqft | Sold | Price | $/sf | Match |
|---|---|---|---|---|---|---|---|
| 2600 38th St SW | 0.15mi | 3/2.0 | 1,629 (+2%) | 0mo | $350,000 | $215 | 89 |
| 2515 29th St SW | 0.63mi | 3/2.0 | 1,630 (+2%) | 1mo | $315,000 | $193 | 66 |
| 339 Pyramid Ave | 0.64mi | 3/2.0 | 1,637 (+3%) | 3mo | $320,000 | $195 | 63 |
| 341 Pyramid Ave | 0.65mi | 3/2.0 | 1,637 (+3%) | 4mo | $315,000 | $192 | 62 |
| 2906 29th St SW | 0.71mi | 3/2.0 | 1,538 (-3%) | 2mo | $335,000 | $218 | 59 |
| 20529 Hazelnut Ct S | 0.71mi | 2/2.0 (-1) | 1,564 (-2%) | 1mo | $202,000 | $129 | 58 |
| 20531 Hazelnut Ct S | 0.71mi | 2/2.0 (-1) | 1,564 (-2%) | 1mo | $202,000 | $129 | 58 |
| 117 Paxton St | 0.51mi | 3/2.0 | 1,421 (-11%) | 2mo | $275,000 | $194 | 57 |
| 2907 48th St SW | 0.74mi | 3/2.0 | 1,503 (-6%) | 9mo | $293,000 | $195 | 49 |
| 4602 Beth Ave S | 0.56mi | 4/2.0 (+1) | 1,757 (+10%) | 4mo | $274,500 | $156 | 48 |
| 4609 Inez Ave S | 0.68mi | 3/2.0 | 1,785 (+12%) | 2mo | $480,000 | $269 | 47 |
| 3010 44th St SW | 0.65mi | 3/2.0 | 1,354 (-15%) | 7mo | $305,000 | $225 | 39 |
Match score weights: distance 35% · size 25% · config 20% · recency 20%. Top-matched comps best support the ARV.
Projected returns pro-forma
10.0% appreciation · 0.0% rent growth · sell at horizon
- IRR
- 24.5%
- Equity multiple
- 2.94×
- Total profit
- $130,223
- Equity at exit
- $216,121
- IRR
- 20.9%
- Equity multiple
- 6.47×
- Total profit
- $367,580
- Equity at exit
- $466,073
Cash invested: $67,172 (down + closing). Projections, not guarantees.
Landlord ↔ Tenant lean methodology
- Overall (STATE)
- 87 Strongly Landlord-Friendly
- State Florida
- 87 Strongly Landlord-Friendly · R+3
- County
- — inherits STATE
- City
- — inherits STATE
ZIP-level market 33976
- Home prices YoY
- 6.8%
- Rents YoY
- -1.5%
- Active inventory
- 788
- Price-to-rent
- 9.3×
Monthly cashflow live
- Estimated rent
- $2,152 high interval (Pro) →
- Mortgage (P&I)
- −$1,258
- Tax from tax record
- −$250 /mo · $2,997/yr
- Insurance
- −$100
- HOA
- −$0
- Vacancy / Maint / Mgmt
- −$452
- Net cashflow
- $92
Break-even live
Sensitivity live
| Price | -10% $228 | -5% $160 | +0% $92 | +5% $24 | +10% $-44 |
|---|---|---|---|---|---|
| Rent | -10% $-78 | -5% $7 | +0% $92 | +5% $177 | +10% $262 |
| Rate | -1.0pp $213 | -0.5pp $153 | base $92 | +0.5pp $30 | +1.0pp $-33 |
UW: 25.0% down · 7.5% · 30yr · 1.5% tax · 5.0% vac · 8.0% maint · 8.0% mgmt
Financing live
Cash to close
- Down payment
- $59,975
- Closing costs
- $7,197
- Reserves months
- —
- Total cash needed
- —
Loan-product check · same deal, 3 products live
Conventional
25% down · 7.5% · 30yr
- Down + closing
- —
- Monthly P&I
- —
- Monthly cashflow
- —
- DSCR
- —
- Eligible?
- —
Personal DTI + credit; lowest rate.
DSCR
20% down · 8.5% · 30yr
- Down + closing
- —
- Monthly P&I
- —
- Monthly cashflow
- —
- DSCR
- —
- Eligible?
- —
No personal income docs; deal must DSCR.
Hard money
10% down · 12.0% · 12mo
- Down + closing
- —
- Monthly P&I
- —
- Monthly cashflow
- —
- DSCR
- —
- Eligible?
- —
Short-term bridge; refi at stabilization.
Rent comps 40 comps
| Address | Beds | Baths | Sqft | Rent | $/sqft | DOM | Units | Dist |
|---|---|---|---|---|---|---|---|---|
| 3001 37th St SW Lehigh Acres, FL | 3.0 | 2.5 | 1235 | $1,705 | $1.38 | 25d | 1 | 0.36mi |
| 2916 42nd St SW Lehigh Acres, FL | 3.0 | 2.0 | 1399 | $1,960 | $1.40 | 4d | 1 | 0.45mi |
| 2916 42nd St SW Lehigh Acres, FL | 3.0 | 2.0 | 1399 | $1,930 | $1.38 | 3d | 1 | 0.45mi |
| 3012 40th St SW Lehigh Acres, FL | 3.0 | 2.0 | 1427 | $1,950 | $1.37 | 25d | 1 | 0.54mi |
| 2612 31st St Lehigh Acres, FL | 4.0 | 2.0 | 1389 | $1,799 | $1.30 | 17d | 1 | 0.54mi |
| 2612 31st St Lehigh Acres, FL | 4.0 | 2.0 | 1365 | $1,799 | $1.32 | 15d | 1 | 0.54mi |
| 813 Alabama Rd S Lehigh Acres, FL | 3.0 | 2.0 | 1200 | $1,495 | $1.25 | 25d | 1 | 0.60mi |
| 4701 Connie Ave S Lehigh Acres, FL | 3.0 | 2.0 | 1314 | $1,900 | $1.45 | 15d | 1 | 0.62mi |
| 397 Pennfield Ave Lehigh Acres, FL | 4.0 | 2.0 | 1780 | $2,100 | $1.18 | 25d | 1 | 0.66mi |
| 3102 39th St SW Lehigh Acres, FL | 3.0 | 2.0 | 1097 | $1,630 | $1.49 | 22d | 1 | 0.67mi |
| 2513 48th St SW Lehigh Acres, FL | 3.0 | 2.0 | 1423 | $1,750 | $1.23 | 17d | 1 | 0.68mi |
| 2710 28th St SW Lehigh Acres, FL | 4.0 | 2.0 | 1742 | $2,450 | $1.41 | 25d | 1 | 0.71mi |
| 2911 48th St SW Lehigh Acres, FL | 3.0 | 2.0 | 1723 | $2,200 | $1.28 | 11d | 1 | 0.72mi |
| 20517 Hazelnut Ct S Lehigh Acres, FL | 2.0 | 2.0 | 1564 | $2,050 | $1.31 | 25d | 1 | 0.73mi |
| 20483 Copperhead Dr Unit 20483 Lehigh Acres, FL | 3.0 | 3.0 | 1849 | $2,300 | $1.24 | 11d | 1 | 0.76mi |
| 3114 39th St SW Lehigh Acres, FL | 3.0 | 2.0 | 1493 | $2,100 | $1.41 | 17d | 1 | 0.76mi |
| 3114 39th St SW Lehigh Acres, FL | 3.0 | 2.0 | 1493 | $2,100 | $1.41 | 4d | 1 | 0.76mi |
| 2708 27th St SW Lehigh Acres, FL | 4.0 | 2.0 | 1698 | $2,280 | $1.34 | 4d | 1 | 0.77mi |
| 749 Alabama Rd S Unit 749 Lehigh Acres, FL | 3.0 | 2.0 | 1275 | $1,800 | $1.41 | 3d | 1 | 0.79mi |
| 4704 Karen Ave S Lehigh Acres, FL | 4.0 | 3.0 | 1916 | $2,500 | $1.30 | 4d | 1 | 0.79mi |
| 20559 Hazelnut Ct S Lehigh Acres, FL | 2.0 | 2.0 | 1564 | $1,750 | $1.12 | 25d | 1 | 0.80mi |
| 3201 42nd St SW Lehigh Acres, FL | 3.0 | 2.0 | 1571 | $2,195 | $1.40 | 4d | 1 | 0.82mi |
| 3201 42nd St SW Lehigh Acres, FL | 3.0 | 2.0 | 1571 | $2,195 | $1.40 | 4d | 1 | 0.82mi |
| 4702 Loraine Ave S Lehigh Acres, FL | 3.0 | 2.0 | 1354 | $2,000 | $1.48 | 16d | 1 | 0.83mi |
| 325 Paulcrest Ave Lehigh Acres, FL | 4.0 | 2.0 | 1619 | $2,300 | $1.42 | 25d | 1 | 0.84mi |
| 177 Pennfield St Lehigh Acres, FL | 3.0 | 2.0 | 1250 | $1,850 | $1.48 | 25d | 1 | 0.84mi |
| 2819 51st St SW Lehigh Acres, FL | 4.0 | 2.0 | 1472 | $2,250 | $1.53 | 25d | 1 | 0.85mi |
| 2908 51st St SW Lehigh Acres, FL | 3.0 | 2.0 | 1401 | $1,796 | $1.28 | 4d | 1 | 0.85mi |
| 20555 Copperhead Dr Lehigh Acres, FL | 4.0 | 3.0 | 2032 | $2,490 | $1.23 | 4d | 1 | 0.85mi |
| 20550 Copperhead Dr Lehigh Acres, FL | 4.0 | 3.0 | 2002 | $3,500 | $1.75 | 25d | 1 | 0.87mi |
| 2811 25th St SW Unit NA Lehigh Acres, FL | 3.0 | 2.0 | 1430 | $1,990 | $1.39 | 25d | 1 | 0.88mi |
| 20673 Hazelnut Ct Lehigh Acres, FL | 2.0 | 2.0 | 1564 | $2,099 | $1.34 | 25d | 1 | 0.96mi |
| 2602 24th St SW Lehigh Acres, FL | 3.0 | 2.0 | 1358 | $1,800 | $1.33 | 4d | 1 | 0.97mi |
| 2507 53rd St SW Lehigh Acres, FL | 3.0 | 2.0 | 1714 | $1,950 | $1.14 | 4d | 1 | 0.98mi |
| 2512 54th St SW Lehigh Acres, FL | 4.0 | 2.0 | 1833 | $1,750 | $0.95 | 4d | 1 | 1.00mi |
| 18451 Copperhead Dr #522 Lehigh Acres, FL | 2.0 | 2.0 | 1120 | $1,895 | $1.69 | 25d | 1 | 1.00mi |
| 20699 Hazelnut Ct Lehigh Acres, FL | 2.0 | 2.0 | 1564 | $2,351 | $1.50 | 25d | 1 | 1.00mi |
| 507 Peerless Cir Lehigh Acres, FL | 3.0 | 2.0 | 1408 | $2,100 | $1.49 | 25d | 1 | 1.01mi |
| 507 Peerless Cir Lehigh Acres, FL | 3.0 | 2.0 | 1408 | $2,000 | $1.42 | 4d | 1 | 1.01mi |
| 3008 25th St SW Lehigh Acres, FL | 4.0 | 2.0 | 1565 | $1,711 | $1.09 | 22d | 1 | 1.02mi |
Listing history 9 events
-
2026-06-13statusdays on market $239,900 Pending 16 DOM
-
2026-06-10days on market $239,900 Active 14 DOM
-
2026-06-09days on market $239,900 Active 13 DOM
-
2026-06-08days on market $239,900 Active 12 DOM
-
2026-06-07days on market $239,900 Active 11 DOM
-
2026-06-03days on market $239,900 Active 7 DOM
-
2026-06-02pricedays on market $239,900 Active 6 DOM
-
2026-06-01days on market $249,900 Active 5 DOM
-
2026-05-31days on market $249,900 Active 4 DOM
ⓘ Source: listings_history table (triggers on properties + properties_extension) + one-shot
backfill from property_details.listing_events for pre-trigger history.
Tax reassessment forecast FL · Resets to sale price
- Current annual tax
- $2,997 · $250/mo
- Projected year-2 tax
- $2,997 · $250/mo
- Expected delta
- $0/yr ($0/mo · 0.0%)
ⓘ Screening estimate from a state-policy table — verify with the county assessor before closing.
Climate risk First Street
- Flood 1/10 Low FEMA zone X (unshaded) · 0% chance over 30 yrs
- Wildfire 4/10 Moderate
- Heat 10/10 Extreme 7 d/yr ≥107°F today · 29 d/yr by 30 yrs out
- Wind 10/10 Extreme 99% chance of damaging wind over 30 yrs
- Air quality 2/10 Low 1 unhealthy d/yr today · 1 by 30 yrs out
Nearby sold comps map
Loading sold comps map…
Walkable amenities ~0.75 mi
Loading nearby amenities…
Taxation est. · year 1
- Rental income
- $25,822
- − Mortgage interest
- −$13,438
- − Property taxes
- −$2,997
- − Insurance
- −$1,200
- − Repairs & maintenance
- −$2,066
- − Management
- −$2,066
- − Depreciation
- −$6,979
- Taxable loss
- −$2,923
- Est. tax savings @ 24.0%
- +$701
- After-tax cash flow
- $1,808/yr
For passive investors: Depreciation is non-cash, so a rental often shows a tax loss while cash-flowing — sheltering income. Rental losses are passive: they offset passive income freely, and up to $25,000/yr can offset ordinary (W-2) income if you actively participate and your MAGI is under $100k (phasing out to $0 by $150k); unused losses carry forward. On sale, claimed depreciation is recaptured at up to 25%, and gains may owe capital-gains tax (a 1031 exchange can defer both). Figures are a year-1 estimate at your 24.0% rate — not tax advice; consult a CPA.
Schools (NCES district)
- District
- Lee
- NCES district ID
- 1201080
- Math proficiency
- 47% ▼ -11.00%
- Reading proficiency
- 50% ▼ -4.00%
- Median HH income
- $49,518
- Composite
- 41.49/100
- National rank
- #3458
- State rank
- #42 of 73 in FL
Livability — Lehigh Acres
- Score
- 59/100
- State rank
- #826
- US rank
- #20055
Category grades
Schools grade is shown separately in the Schools card above.
Census & demographics
- Census place
- Lehigh Acres, FL
- County
- Lee County · 788,662 people
- City population
- 130,638
- Metro
- Cape Coral-Fort Myers, FL
- Population (ZIP)
- 20,277
- Household income
- $72,679
- Rent vs Own
- Severe rent burden
- 574.0
Population outlook (Lee County) Hauer SSP2
- Today (2025)
- 871,946 people
- By 2030
- 955,468 · +9.6%
- By 2040
- 1,113,587 · +27.7%
- By 2050
- 1,256,891 · +44.1%
- By 2075
- 1,560,270 · +78.9%
- By 2100
- 1,726,848 · +98.0%
Race, ethnicity, and origin ACS 2023
- Neighborhood character
- Diverse neighborhood (Simpson 0.65)
- Race & ethnicity
- Hispanic / Latino 50% Two or more races 30% White 24% Black 20% Asian 3%
- Hispanic origin (detail)
- Mexican 8% Puerto Rican 8% Cuban 18% Dominican 4%
- Common ancestry
- Hispanic 8% Slovak 1% Lithuanian 1%
- Foreign-born
- 35% · Canada, Jamaica, Vietnam
- Languages at home
- 46% English-only · Spanish 43% French/Haitian/Cajun 8% Vietnamese 1%
Political lean MEDSL · Lee
- 2024 margin
- Strong R (+28.4) · D 35.5% · R 63.9%
- 2008→2024 swing
- -18.0pp toward R · 2008: -10.4pp · 2024: -28.4pp
- All cycles
- 2024: R+28.4 2020: R+19.2 2016: R+20.4 2012: R+16.6 2008: R+10.4
Not yet ingested
- Civics
- —
Market trends
- HPI YoY
- ▲ 21.77%
- Current HPI
- 340.4255
- Rent YoY
- ▼ -1.54%
- Metro
- Cape Coral-Fort Myers, FL
- State GDP YoY
- ▲ 3.28%
- F500 in state
- 36
Industry mix (Fortune 500 HQ in FL)
| Industry | F500 HQs | Revenue |
|---|---|---|
| Industrial Technology | 2 | $29B |
|
||
| Insurance | 2 | $17B |
|
||
| Retail | 1 | $60B |
|
||
| Technology Distribution | 1 | $58B |
|
||
| Homebuilding | 1 | $35B |
|
||
| Technology Manufacturing | 1 | $35B |
|
||
Price history
+2399.0% since first listed12 events — show timeline
- 2026-05-27 Listed $249,900 FORTMLS
- 2021-10-14 Sold (Public Records) $240,000 Public Records
- 2021-10-12 Sold (MLS) $240,000 FORTMLS
- 2021-09-13 Pending — FORTMLS
- 2021-08-11 Price Changed $243,000 FORTMLS
- 2021-07-16 Listed $249,900 FORTMLS
- 2019-06-03 Sold (Public Records) $175,000 Public Records
- 2019-05-31 Sold (MLS) $175,000 FORTMLS
- 2019-03-16 Pending — FORTMLS
- 2019-02-27 Listed $179,000 FORTMLS
- 2005-05-06 Sold (MLS) $202,000 FORTMLS
- 2004-05-14 Sold (Public Records) $10,000 Public Records
Property tax history
+6.2%/yrLatest (2025): $2,997 · +3.9% YoY. Source: county tax records.
Cash-flow waterfall
monthlySold comps — $/sqft
last 12 mo · ≤1 miLoading sold comps…