145 Hillrise Dr · Telford, TN
Flood risk 1/10 · Minimal
- FEMA flood zone
- X (unshaded)
- Chance of flooding over 30 yrs
- 0.0%
- Est. flood insurance / yr
- $507 – $1,088
Fire risk 5/10 · Moderate
- Est. fire insurance / yr
- $949 – $1,763
Heat risk 4/10 · Minor
- Hot days now (above 98°F)
- 8 days/yr
- Hot days in 30 yrs
- 23 days/yr
Wind risk 2/10 · Minimal
- Chance of severe wind over 30 yrs
- —
Air-quality risk 2/10 · Minimal
- Unhealthy air days now
- 1 days/yr
- Unhealthy air days in 30 yrs
- 1 days/yr
Risk factors via First Street. Map © Google.
Why this score? — see what drove the D grade
The composite is a weighted blend of 9 inputs, each scored 0–100. Each bar is that input's sub-score; the figure is the points it added to the 100-point composite (weight × sub-score).
- Cash flow +15.0/30.0
- ARV discount +7.5/15.0
- 1% rule +5.0/10.0
- DSCR +5.0/10.0
- Schools +2.6/10.0
- Rent growth +2.5/5.0
- Condition / age +2.5/5.0
- Livability +2.4/5.0
- Appreciation +0.0/10.0
$10,000
🖨 Deal sheet 📄 Offer letter ✓ Due diligence
Listing remarks
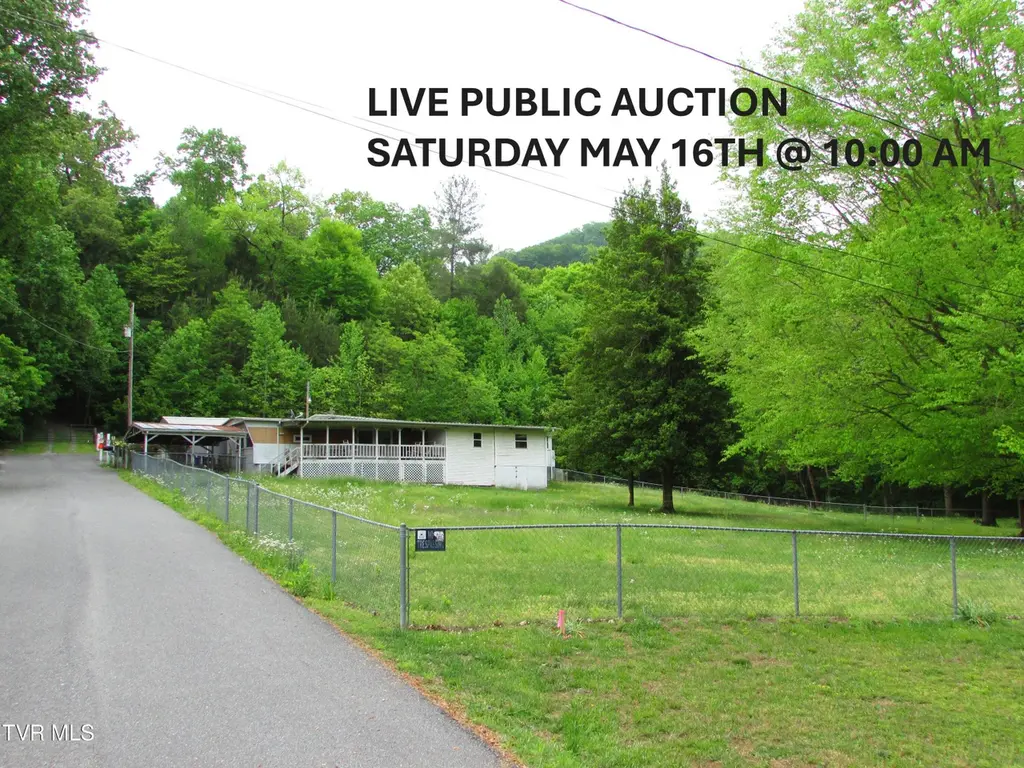
PRICE GIVEN BY NO MEANS REFLECTS THE ASKING PRICE, LISINTG PRICE, STARTING BID OR THE FINAL ONTRACT PRICE. PRICE GIVEN TO BE ABLE TO POPULATE TO THIRD PARTY WEBSITE PROVIDERS. LIVE CHANCERY COURT AUCTION SELLING TO SETTLE AN ESTATE SATURDAY, MAY 16th @ 10:00 A. M. SINGLEWIDE HOME, DETACH GARAGE, OUTBUILDING ON A 1.8 + OR - ACRE LOT. Nestled in the rolling hills of Washington County, this charming 3-bedroom, 2-bath singlewide mobile home sits on a gorgeous 1.8+/- acre lot surrounded by mature hardwoods and lush greenery. The property offers a peaceful, private setting while still enjoying the convenience of public water and electric service. Inside, you'll find a spacious layout featuring
Key facts
- 1.8 acre lot
- Outbuilding
- Cleared level area
Tags
Property features AI
Exterior
- Parking: Concrete parking; 1-car garage
- Utilities: Public water; Septic tank sewer
- Home design: Manufactured house (single wide); Residential single family residence
- Construction: Metal siding; Metal roof
- Exterior features: Front porch; Rear porch; Front and back yard fencing; Level, part wooded, and sloped topography; Has view; Shed(s); Workshop
Interior
- Kitchen: Range; Refrigerator
- Bathrooms: 2 full bathrooms
- Heating & cooling: Heat pump heating; Heat pump cooling
- Interior features: Range; Refrigerator; Total of 5 rooms
Neighborhood map
What this means for you Summary
Snapshot
- This is a 3-bed/2.0-bath manufactured listed at $10k.
Deal economics
- At list price, monthly cash flow is $1k ($12k/yr) — positive.
- The deal already cash-flows at list — no discount required.
- Meets the 1% rule at list price ($1k rent vs $10k).
- Recommended offer: $10k (1.5% below list) — sets the bar for market timing.
- Cap rate 130.7% vs local median 2.7% in Telford — top-decile yield for the area; either an underpriced asset or a hidden risk that comps aren't pricing in. Stress-test before assuming the spread holds.
Location & tenants
- Location reads 47/100 on livability (#422 in TN) — a working-class tenant base; expect higher turnover. Strengths: cost of living A+, crime A; Watch: amenities F, commute F, employment F.
- Washington County (suburban): math 26% / reading 34% proficiency, ranked #54 of 139 in TN (top 39%) — families likely to look elsewhere, expect single-tenant / working-renter base with shorter leases.
- Zoned schools: South Central Elementary (math 17% / reading 27%, grade F, #601 of 952 statewide, top 66%, 176 students, 0% FRL); David Crockett High School (math 25% / reading 39%, grade F, #56 of 332 statewide, top 20%, 1,181 students, 0% FRL) — zoned schools average 0% FRL vs 41% district-wide (41 pts lower); this property's tenant base skews higher-income than the district average.
- Market conditions: 312 active listings in the ZIP; 1,155 units permitted in Washington County in 2024 (437 in 5+ unit buildings).
Forward outlook
- Local home prices are declining (-3.0%/yr); year-one equity from $69 of loan paydown is wiped out by about $300 of value loss. Plan a longer hold.
- Washington County population projected at +9% by 2050 — modest demand growth; plan on rents tracking national, not racing it.
- At projected returns (-3.0% appreciation + 3.0% rent growth), your $3k cash investment doubles in ~1 year — after that, you're playing with house money.
Negotiation context
- It's been on market 18 days — a 2% lower offer ($10k) is reasonable based on typical stale-listing flexibility.
Risks & watch-outs
- Climate carrying-cost: moderate wildfire risk — expect insurance premiums to compound above CPI over the hold.
Questions for the listing agent
- Is there a deadline driving the sale (1031 exchange, divorce, estate, relocation)? That informs how much negotiation room exists.
- Schools are F-rated, which usually means shorter tenancies and higher turnover. Who's the typical renter profile here, and what's been the actual vacancy rate?
- The area grade is low — what's the realistic commute time and amenity access for the typical tenant pool here? Any planned neighborhood developments (good or bad) we should know about?
- What's the average days-on-market for RENTAL listings here right now (not sales)? A rising rental-DOM trend means longer vacancies and softer asking-rent achievability than the comps imply.
- What's the recent tenant-quality profile in this submarket — average credit score on applications, eviction rate, late-payment / NSF rate, and stable-employment percentage? A property-management company in the area should have these aggregated.
- How much new for-sale + rental construction is in the pipeline within 1–3 miles? Heavy new supply typically softens prices + rents 12–24 months out; constrained supply supports both.
Investment metrics
- 1% rule
- 14.10% ✓
- Cap rate
- 130.66%
- Cash-on-cash
- 444.16%
- DSCR
- 20.76
- GRM
- 0.6
CMA / ARV
No comps found within radius.
Projected returns pro-forma
-3.0% appreciation · 3.0% rent growth · sell at horizon
- IRR
- —
- Equity multiple
- 24.00×
- Total profit
- $64,412
- Equity at exit
- $1,491
- IRR
- —
- Equity multiple
- 51.43×
- Total profit
- $141,190
- Equity at exit
- $865
Cash invested: $2,800 (down + closing). Projections, not guarantees.
Landlord ↔ Tenant lean methodology
- Overall (STATE)
- 87 Strongly Landlord-Friendly
- State Tennessee
- 87 Strongly Landlord-Friendly · R+13
- County
- — inherits STATE
- City
- — inherits STATE
ZIP-level market 37659
- Home prices YoY
- -19.7%
- Active inventory
- 312
- Price-to-rent
- 0.6×
Monthly cashflow live
- Estimated rent
- $1,410 medium interval (Pro) →
- Mortgage (P&I)
- −$52
- Tax from tax record
- −$21 /mo · $248/yr
- Insurance
- −$4
- HOA
- −$0
- Vacancy / Maint / Mgmt
- −$296
- Net cashflow
- $1,036
Break-even live
UW: 25.0% down · 7.5% · 30yr · 1.5% tax · 5.0% vac · 8.0% maint · 8.0% mgmt
Financing live
Cash to close
- Down payment
- $2,500
- Closing costs
- $300
- Reserves months
- —
- Total cash needed
- —
Loan-product check · same deal, 3 products live
Conventional
25% down · 7.5% · 30yr
- Down + closing
- —
- Monthly P&I
- —
- Monthly cashflow
- —
- DSCR
- —
- Eligible?
- —
Personal DTI + credit; lowest rate.
DSCR
20% down · 8.5% · 30yr
- Down + closing
- —
- Monthly P&I
- —
- Monthly cashflow
- —
- DSCR
- —
- Eligible?
- —
No personal income docs; deal must DSCR.
Hard money
10% down · 12.0% · 12mo
- Down + closing
- —
- Monthly P&I
- —
- Monthly cashflow
- —
- DSCR
- —
- Eligible?
- —
Short-term bridge; refi at stabilization.
Listing history 3 events
-
2026-05-17status Pending
-
2026-04-29$10,000 Active
-
1993-06-25soldstatus $48,500
ⓘ Source: listings_history table (triggers on properties + properties_extension) + one-shot
backfill from property_details.listing_events for pre-trigger history.
Tax reassessment forecast TN · Resets to sale price
- Current annual tax
- $248 · $21/mo
- Projected year-2 tax
- $248 · $21/mo
- Expected delta
- $0/yr ($0/mo · 0.0%)
ⓘ Screening estimate from a state-policy table — verify with the county assessor before closing.
Climate risk First Street
- Flood 1/10 Low FEMA zone X (unshaded) · 0% chance over 30 yrs
- Wildfire 5/10 Major
- Heat 4/10 Moderate 8 d/yr ≥98°F today · 23 d/yr by 30 yrs out
- Wind 2/10 Low
- Air quality 2/10 Low 1 unhealthy d/yr today · 1 by 30 yrs out
Nearby sold comps map
Loading sold comps map…
Walkable amenities ~0.75 mi
Loading nearby amenities…
Taxation est. · year 1
- Rental income
- $16,916
- − Mortgage interest
- −$560
- − Property taxes
- −$248
- − Insurance
- −$50
- − Repairs & maintenance
- −$1,353
- − Management
- −$1,353
- − Depreciation
- −$291
- Taxable income
- $13,060
- Est. tax owed @ 24.0%
- −$3,134
- After-tax cash flow
- $9,302/yr
For passive investors: Depreciation is non-cash, so a rental often shows a tax loss while cash-flowing — sheltering income. Rental losses are passive: they offset passive income freely, and up to $25,000/yr can offset ordinary (W-2) income if you actively participate and your MAGI is under $100k (phasing out to $0 by $150k); unused losses carry forward. On sale, claimed depreciation is recaptured at up to 25%, and gains may owe capital-gains tax (a 1031 exchange can defer both). Figures are a year-1 estimate at your 24.0% rate — not tax advice; consult a CPA.
Schools (NCES district)
- District
- Washington County
- NCES district ID
- 4704380
- Math proficiency
- 26% ▼ -21.00%
- Reading proficiency
- 34% ▼ -11.00%
- Median HH income
- $46,542
- Composite
- 25.85/100
- National rank
- #7350
- State rank
- #54 of 139 in TN
Livability — Telford
- Score
- 47/100
- State rank
- #422
- US rank
- #26284
Category grades
Schools grade is shown separately in the Schools card above.
Census & demographics
- County
- Washington County · 129,006 people
- City population
- 4,720
- Metro
- Johnson City, TN
- Population (ZIP)
- 29,080
- Household income
- $71,110
- Rent vs Own
- Severe rent burden
- 310.0
Population outlook (Washington County) Hauer SSP2
- Today (2025)
- 132,816 people
- By 2030
- 135,823 · +2.3%
- By 2040
- 140,897 · +6.1%
- By 2050
- 145,073 · +9.2%
- By 2075
- 156,386 · +17.7%
- By 2100
- 159,893 · +20.4%
Race, ethnicity, and origin ACS 2023
- Neighborhood character
- Predominantly White (91%)
- Race & ethnicity
- White 91% Two or more races 5% Hispanic / Latino 3% Asian 2% Black 1%
- Common ancestry
- Italian 3% Serbian 3% Slovak 2%
- Foreign-born
- 3% · South Korea, Canada
- Languages at home
- 96% English-only · Spanish 1% Korean 1% Other Asian/Pacific 1%
Political lean MEDSL · Washington
- 2024 margin
- Solid R (+39.5) · D 29.6% · R 69.1% · Other 1.3%
- 2008→2024 swing
- -6.0pp toward R · 2008: -33.5pp · 2024: -39.5pp
- All cycles
- 2024: R+39.5 2020: R+36.2 2016: R+42.9 2012: R+38.5 2008: R+33.5
Not yet ingested
- Civics
- —
Market trends
- HPI YoY
- ▼ -73.31%
- Current HPI
- 298.6464
- Rent YoY
- —
- Metro
- Johnson City, TN
- State GDP YoY
- ▲ 2.78%
- F500 in state
- 22
Industry mix (Fortune 500 HQ in TN)
| Industry | F500 HQs | Revenue |
|---|---|---|
| Healthcare | 3 | $91B |
|
||
| Retail | 3 | $72B |
|
||
| Transportation / Logistics | 1 | $88B |
|
||
| Paper / Packaging | 1 | $19B |
|
||
| Insurance | 1 | $13B |
|
||
| Energy | 1 | $12B |
|
||
Price history
-79.4% since first listed3 events — show timeline
- 2026-05-17 Pending — TVRMLS
- 2026-04-29 Listed $10,000 TVRMLS
- 1993-06-25 Sold (Public Records) $48,500 Public Records
Property tax history
+2.3%/yrLatest (2025): $248 · +0.0% YoY. Source: county tax records.
Cash-flow waterfall
monthlySold comps — $/sqft
last 12 mo · ≤1 miLoading sold comps…