 Triplex
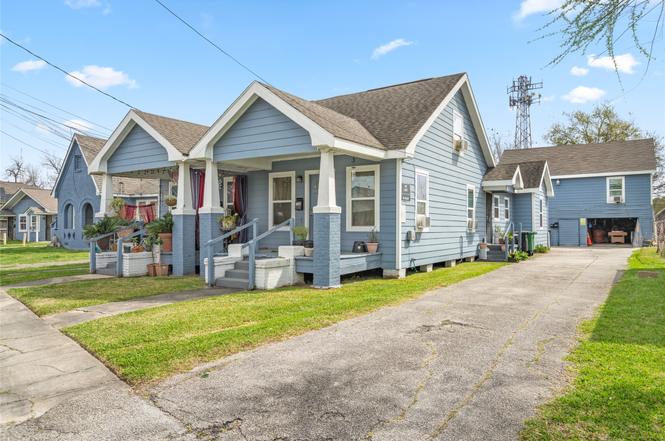
118 N Hagerman St · Houston, TX
Flood risk 4/10 · Minor
- FEMA flood zone
- X (unshaded)
- Chance of flooding over 30 yrs
- 0.22%
- Est. flood insurance / yr
- $507 – $1,088
Fire risk 1/10 · Minimal
- Est. fire insurance / yr
- $1,222 – $2,270
Heat risk 9/10 · Severe
- Hot days now (above 109°F)
- 7 days/yr
- Hot days in 30 yrs
- 25 days/yr
Wind risk 9/10 · Severe
- Chance of severe wind over 30 yrs
- 99.0%
Air-quality risk 2/10 · Minimal
- Unhealthy air days now
- 2 days/yr
- Unhealthy air days in 30 yrs
- 2 days/yr
Risk factors via First Street. Map © Google.
Why this score? — see what drove the B+ grade
The composite is a weighted blend of 9 inputs, each scored 0–100. Each bar is that input's sub-score; the figure is the points it added to the 100-point composite (weight × sub-score).
- Cash flow +30.0/30.0
- 1% rule +10.0/10.0
- DSCR +10.0/10.0
- Appreciation +10.0/10.0
- ARV discount +7.6/15.0
- Livability +3.7/5.0
- Schools +2.7/10.0
- Condition / age +2.5/5.0
- Rent growth +1.8/5.0
$450,000
🖨 Deal sheet 📄 Offer letter ✓ Due diligence
Multi-family units
County records classify this as Multi-Family (2-4 Unit). Listing-text estimate: 3 units. confirmed
Listing remarks
Investment Opportunity in the Rapidly Growing Eastwood Area! Discover this spacious and unique four-plex located in one of Houston’s most exciting and fast-developing neighborhoods. The property features three units in the front and a large garage apartment in the back, offering a flexible layout that is perfect for investors or owner-occupants looking to house hack while generating rental income. With 100% occupancy and all tenants currently on month-to-month leases, this property provides excellent flexibility for future plans and rental adjustments. Situated just minutes from University of Houston, the Texas Medical Center, Downtown Houston, and Daikin Park, you'll also be investin
Key facts
- 100 occupancy
- Flexible layout
- Texas medical center
Tags
Neighborhood map
What this means for you Summary
Snapshot
- This is a 3 × 5-bed/3.0-bath units multifamily listed at $450k.
Deal economics
- At list price, monthly cash flow is $3k ($40k/yr) — positive. Per door: $1k/mo.
- The deal already cash-flows at list — no discount required.
- Meets the 1% rule at list price ($8k rent vs $450k).
- Recommended offer: $443k (1.5% below list) — sets the bar for market timing.
- Cap rate 15.2% vs local median 3.2% in Houston — top-decile yield for the area; either an underpriced asset or a hidden risk that comps aren't pricing in. Stress-test before assuming the spread holds.
Location & tenants
- Location reads 74/100 on livability (#184 in TX, #4,771 nationally) — a middle-class / working-renter tenant base. Strengths: amenities A+, cost of living A+, housing A+; Watch: crime F.
- Houston ISD (urban): math 27% / reading 35% proficiency, ranked #593 of 826 in TX (top 72%) — families likely to look elsewhere, expect single-tenant / working-renter base with shorter leases; 71% free/reduced lunch — lower-income household profile, screen leases tightly.
- Zoned schools: Navarro Middle (math 8% / reading 13%, grade F, #1,639 of 1,662 statewide, top 99%, 547 students, 98% FRL); Austin H S (math 9% / reading 18%, grade F, #1,530 of 1,632 statewide, top 94%, 1,448 students, 97% FRL) — zoned schools average 98% FRL vs 71% district-wide (27 pts higher); higher-poverty schools than district average — tighter screening recommended.
- Zoned-school proficiency averages 12% at this address vs 31% district-wide (-19 pts) — the specific schools serving this property underperform the Houston ISD average; the district grade overstates school quality for this exact location.
- Market conditions: Rents soft (-2.9%/yr); 161 active listings in the ZIP; 19 comparable units currently listed for rent nearby; rentals at typical pace (median 17d on market — plan ~3-4 weeks tenant-placement turnaround); 29,883 units permitted in Harris County in 2024 (8,621 in 5+ unit buildings).
Forward outlook
- In year one you build about $48k of equity ($3k loan paydown + $45k appreciation (10.0% local appreciation)).
- Harris County population projected at +47% by 2050 — long-run rental-demand tailwind backs the buy-and-hold thesis.
- At projected returns (10.0% appreciation + 0.0% rent growth), your $126k cash investment doubles in ~2 years — after that, you're playing with house money.
- By year 2, paydown + projected appreciation supports a ~$77k cash-out refi (75% LTV) — recoverable capital for the next deal without selling this one.
Negotiation context
- It's been on market 26 days — a 2% lower offer ($443k) is reasonable based on typical stale-listing flexibility.
Risks & watch-outs
- Watch-outs: built in 1945 — expect roof / HVAC / electrical / plumbing capex.
- Climate carrying-cost: severe wind risk, 99% chance of damaging wind over 30y; extreme-heat days projected 7→25/yr by 2055 (HVAC capex compounding) — expect insurance premiums to compound above CPI over the hold.
Questions for the listing agent
- Can we see the unit-by-unit rent roll, current vacancy, and any below-market leases? What's the average tenancy length?
- What capital expenditures (roof, boiler, parking lot, exteriors) have been made in the last 5 years, and what's planned in the next 2?
- Built in 1945 — when were the roof, HVAC, electrical panel, plumbing, and water heater last replaced?
- Is there a deadline driving the sale (1031 exchange, divorce, estate, relocation)? That informs how much negotiation room exists.
- Schools are D-rated, which usually means shorter tenancies and higher turnover. Who's the typical renter profile here, and what's been the actual vacancy rate?
- Crime grade is F in this area — have there been break-ins, vandalism, or insurance claims at this property in the last 3 years? What carrier currently insures it and at what premium?
- What's the average days-on-market for RENTAL listings here right now (not sales)? A rising rental-DOM trend means longer vacancies and softer asking-rent achievability than the comps imply.
- What's the recent tenant-quality profile in this submarket — average credit score on applications, eviction rate, late-payment / NSF rate, and stable-employment percentage? A property-management company in the area should have these aggregated.
- How much new apartment / multifamily construction is in the pipeline within 1–3 miles? Heavy new supply (>2% of stock underway) typically softens rents 12–24 months out; light construction supports rent growth.
Investment metrics
- 1% rule
- 1.85% ✓
- Cap rate
- 15.18%
- Cash-on-cash
- 31.72%
- DSCR
- 2.41
- GRM
- 4.5
CMA / ARV
- ARV (on-the-fly)
- $450,901
- Comps found
- 1
Show comp detail 1 sale within ~0.75 mi
| Address | Dist | Beds/Ba | Sqft | Sold | Price | $/sf | Match |
|---|---|---|---|---|---|---|---|
| 118 N Hagerman St | 0.00mi | 5/3.0 (+1) | 2,519 (0%) | 1mo | $450,000 | $179 | 90 |
Match score weights: distance 35% · size 25% · config 20% · recency 20%. Top-matched comps best support the ARV.
Projected returns pro-forma
10.0% appreciation · 0.0% rent growth · sell at horizon
- IRR
- 46.6%
- Equity multiple
- 4.44×
- Total profit
- $433,009
- Equity at exit
- $405,396
- IRR
- 39.2%
- Equity multiple
- 9.45×
- Total profit
- $1,064,966
- Equity at exit
- $874,251
Cash invested: $126,000 (down + closing). Projections, not guarantees.
Landlord ↔ Tenant lean methodology
- Overall (STATE)
- 87 Strongly Landlord-Friendly
- State Texas
- 87 Strongly Landlord-Friendly · R+5
- County
- — inherits STATE
- City
- — inherits STATE
ZIP-level market 77011
- Home prices YoY
- 30.1%
- Rents YoY
- -2.9%
- Active inventory
- 161
- Price-to-rent
- 13.5×
Monthly cashflow live
- Estimated rent
- $8,341 medium interval (Pro) →
- Mortgage (P&I)
- −$2,360
- Tax from tax record
- −$711 /mo · $8,532/yr
- Insurance
- −$188
- HOA
- −$0
- Vacancy / Maint / Mgmt
- −$1,752
- Net cashflow
- $3,331
Break-even live
3-unit breakdown (identical units grouped — click to expand)
| Units | Beds | Baths | Est. rent |
|---|---|---|---|
| 3× units | 5 | 3 | $8,340 |
| #1 | 5 | 3 | $2,780 |
| #2 | 5 | 3 | $2,780 |
| #3 | 5 | 3 | $2,780 |
| Total (3 units) | $8,341 | ||
UW: 25.0% down · 7.5% · 30yr · 1.5% tax · 5.0% vac · 8.0% maint · 8.0% mgmt
Financing live
Cash to close
- Down payment
- $112,500
- Closing costs
- $13,500
- Reserves months
- —
- Total cash needed
- —
Loan-product check · same deal, 3 products live
Conventional
25% down · 7.5% · 30yr
- Down + closing
- —
- Monthly P&I
- —
- Monthly cashflow
- —
- DSCR
- —
- Eligible?
- —
Personal DTI + credit; lowest rate.
DSCR
20% down · 8.5% · 30yr
- Down + closing
- —
- Monthly P&I
- —
- Monthly cashflow
- —
- DSCR
- —
- Eligible?
- —
No personal income docs; deal must DSCR.
Hard money
10% down · 12.0% · 12mo
- Down + closing
- —
- Monthly P&I
- —
- Monthly cashflow
- —
- DSCR
- —
- Eligible?
- —
Short-term bridge; refi at stabilization.
Rent comps 19 comps
| Address | Beds | Baths | Sqft | Rent | $/sqft | DOM | Units | Dist |
|---|---|---|---|---|---|---|---|---|
| 207 Edgewood St Houston, TX | 3.0 | 4.0 | 2577 | $3,250 | $1.26 | 44d | 1 | 0.49mi |
| 5502 Texas St Unit 1514806P Houston, TX | 3.0 | 2.5 | 1808 | $7,216 | $3.99 | 8d | 1 | 0.72mi |
| 5504 Texas St Unit 1514810P Houston, TX | 3.0 | 2.5 | 1808 | $7,026 | $3.89 | 3d | 1 | 0.72mi |
| 4535 Polk St Houston, TX | 5.0 | 4.0 | 3364 | $10,000 | $2.97 | 17d | 1 | 0.79mi |
| 4001 Dallas St Unit 1029264P Houston, TX | 3.0 | 3.0 | 2174 | $5,077 | $2.34 | 5d | 1 | 0.87mi |
| 3226 McKinney St Houston, TX | 3.0 | 3.0 | 2274 | $2,500 | $1.10 | 44d | 1 | 1.10mi |
| 6403 Avenue C Unit 1019625P Houston, TX | 2.0–8.0 | 1.0–4.0 | 1232 | $4,453 | $3.61 | 3d | 2 | 1.14mi |
| 2816 Rusk St Houston, TX | 3.0 | 3.5 | 2107 | $2,800 | $1.33 | 44d | 1 | 1.20mi |
| 2414 East Dr Unit Canal St unit Houston, TX | 3.0 | 3.5 | 2063 | $2,950 | $1.43 | 8d | 1 | 1.21mi |
| 1907 Cullen Blvd Houston, TX | 5.0 | 5.0 | 1990 | $999 | $0.50 | 24d | 1 | 1.33mi |
| 3419 Gillespie St Houston, TX | 3.0 | 3.5 | 2168 | $2,300 | $1.06 | 44d | 1 | 1.34mi |
| 3410 Baer St Houston, TX | 3.0 | 4.0 | 2040 | $3,500 | $1.72 | 44d | 1 | 1.36mi |
| 3131 Leeland St Houston, TX | 3.0 | 3.5 | 1966 | $2,850 | $1.45 | 24d | 1 | 1.38mi |
| 2115 Runnels St Unit 3174 Houston, TX | 3.0 | 2.0 | 1839 | $3,056 | $1.66 | 12d | 1 | 1.41mi |
| 2115 Runnels St Unit 3187 Houston, TX | 3.0 | 2.0 | 1839 | $3,013 | $1.64 | 3d | 1 | 1.41mi |
| 2115 Runnels St Unit 2148 Houston, TX | 3.0 | 2.0 | 1839 | $3,045 | $1.66 | 11d | 1 | 1.41mi |
| 4109 Hare St Unit 1019559P Houston, TX | 4.0 | 2.5 | 1905 | $6,852 | $3.60 | 8d | 1 | 1.42mi |
| 4109 Hare St Unit A Houston, TX | 4.0 | 2.5 | 1913 | $6,950 | $3.63 | 44d | 1 | 1.42mi |
| 611 Sydnor St Houston, TX | 3.0 | 4.0 | 2157 | $2,400 | $1.11 | 44d | 1 | 1.43mi |
Listing history 6 events
-
2026-04-19status Pending
-
2026-04-18status Pending
-
2026-04-03status Pending
-
2026-03-27status Pending
-
2026-03-07$450,000 Active
-
1988-01-02soldstatus
ⓘ Source: listings_history table (triggers on properties + properties_extension) + one-shot
backfill from property_details.listing_events for pre-trigger history.
Tax reassessment forecast TX · Resets to sale price
- Current annual tax
- $8,532 · $711/mo
- Projected year-2 tax
- $8,532 · $711/mo
- Expected delta
- $0/yr ($0/mo · 0.0%)
ⓘ Screening estimate from a state-policy table — verify with the county assessor before closing.
Climate risk First Street
- Flood 4/10 Moderate FEMA zone X (unshaded) · 22% chance over 30 yrs
- Wildfire 1/10 Low
- Heat 9/10 Extreme 7 d/yr ≥109°F today · 25 d/yr by 30 yrs out
- Wind 9/10 Extreme 99% chance of damaging wind over 30 yrs
- Air quality 2/10 Low 2 unhealthy d/yr today · 2 by 30 yrs out
Nearby sold comps map
Loading sold comps map…
Walkable amenities ~0.75 mi
Loading nearby amenities…
Taxation est. · year 1
- Rental income
- $100,092
- − Mortgage interest
- −$25,207
- − Property taxes
- −$8,532
- − Insurance
- −$2,250
- − Repairs & maintenance
- −$8,007
- − Management
- −$8,007
- − Depreciation
- −$13,091
- Taxable income
- $34,997
- Est. tax owed @ 24.0%
- −$8,399
- After-tax cash flow
- $31,573/yr
For passive investors: Depreciation is non-cash, so a rental often shows a tax loss while cash-flowing — sheltering income. Rental losses are passive: they offset passive income freely, and up to $25,000/yr can offset ordinary (W-2) income if you actively participate and your MAGI is under $100k (phasing out to $0 by $150k); unused losses carry forward. On sale, claimed depreciation is recaptured at up to 25%, and gains may owe capital-gains tax (a 1031 exchange can defer both). Figures are a year-1 estimate at your 24.0% rate — not tax advice; consult a CPA.
Schools (NCES district)
- District
- Houston ISD
- NCES district ID
- 4823640
- Math proficiency
- 27% ▼ -18.00%
- Reading proficiency
- 35% ▼ -6.00%
- Median HH income
- $46,054
- Composite
- 26.63/100
- National rank
- #7173
- State rank
- #593 of 826 in TX
Livability — Houston
- Score
- 74/100
- State rank
- #184
- US rank
- #4771
Category grades
Schools grade is shown separately in the Schools card above.
Census & demographics
- Census place
- Houston, TX
- County
- Harris County · 4,702,590 people
- City population
- 3,226,434
- Metro
- Houston-The Woodlands-Sugar Land, TX
- Population (ZIP)
- 14,940
- Household income
- $50,133
- Rent vs Own
- Severe rent burden
- 655.0
Population outlook (Harris County) Hauer SSP2
- Today (2025)
- 5,571,493 people
- By 2030
- 6,089,821 · +9.3%
- By 2040
- 7,142,806 · +28.2%
- By 2050
- 8,185,864 · +46.9%
- By 2075
- 10,574,329 · +89.8%
- By 2100
- 12,109,958 · +117.4%
Race, ethnicity, and origin ACS 2023
- Neighborhood character
- Predominantly Hispanic (88%)
- Race & ethnicity
- Hispanic / Latino 88% Two or more races 29% White 7% Black 3%
- Hispanic origin (detail)
- Mexican 81%
- Foreign-born
- 33% · Canada
- Languages at home
- 24% English-only · Spanish 76%
Political lean MEDSL · Harris
- 2024 margin
- Lean D (+5.5) · D 52.0% · R 46.4% · Other 1.6%
- 2008→2024 swing
- +3.9pp toward D · 2008: 1.6pp · 2024: 5.5pp
- All cycles
- 2024: D+5.5 2020: D+13.3 2016: D+12.4 2012: D+0.1 2008: D+1.6
Not yet ingested
- Civics
- —
Market trends
- HPI YoY
- ▲ 68.18%
- Current HPI
- 295.1198
- Rent YoY
- ▼ -2.93%
- Metro
- Houston-The Woodlands-Sugar Land, TX
- State GDP YoY
- ▲ 3.95%
- F500 in state
- 110
Industry mix (Fortune 500 HQ in TX)
| Industry | F500 HQs | Revenue |
|---|---|---|
| Energy | 16 | $1,198B |
|
||
| Technology | 5 | $198B |
|
||
| Engineering / Construction | 4 | $72B |
|
||
| Energy Services | 3 | $60B |
|
||
| Utilities | 3 | $41B |
|
||
| Healthcare | 2 | $330B |
|
||
Price history
6 events — show timeline
- 2026-04-19 Pending — HARMLS
- 2026-04-18 Pending — HARMLS
- 2026-04-03 Pending — HARMLS
- 2026-03-27 Pending — HARMLS
- 2026-03-07 Listed $450,000 HARMLS
- 1988-01-02 Sold (Public Records) — Public Records
Property tax history
+9.9%/yrLatest (2025): $8,532 · +1.5% YoY. Source: county tax records.
Cash-flow waterfall
monthlySold comps — $/sqft
last 12 mo · ≤1 miLoading sold comps…