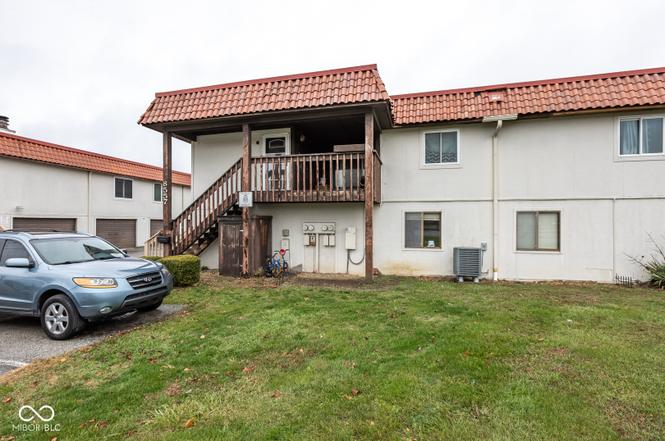
8557 La Corrida Ct · Indianapolis city (balance), IN
Flood risk 1/10 · Minimal
- FEMA flood zone
- X (unshaded)
- Chance of flooding over 30 yrs
- 0.0%
- Est. flood insurance / yr
- $507 – $1,088
Fire risk 1/10 · Minimal
- Est. fire insurance / yr
- $717 – $1,331
Heat risk 3/10 · Minor
- Hot days now (above 101°F)
- 7 days/yr
- Hot days in 30 yrs
- 19 days/yr
Wind risk 2/10 · Minimal
- Chance of severe wind over 30 yrs
- 1.0%
Air-quality risk 2/10 · Minimal
- Unhealthy air days now
- 2 days/yr
- Unhealthy air days in 30 yrs
- 2 days/yr
Risk factors via First Street. Map © Google.
Why this score? — see what drove the C- grade
The composite is a weighted blend of 9 inputs, each scored 0–100. Each bar is that input's sub-score; the figure is the points it added to the 100-point composite (weight × sub-score).
- Cash flow +18.0/30.0
- 1% rule +8.2/10.0
- ARV discount +7.5/15.0
- DSCR +5.6/10.0
- Schools +3.5/10.0
- Rent growth +3.1/5.0
- Livability +2.5/5.0
- Condition / age +2.5/5.0
- Appreciation +0.0/10.0
$125,000
🖨 Deal sheet 📄 Offer letter ✓ Due diligence
Listing remarks
Nestled at 8557 La Corrida CT, INDIANAPOLIS, IN, this condominium offers a unique opportunity to experience comfortable living in a desirable location. This home provides a canvas for creating a personalized haven. The thoughtful layout of this condominium provides distinct spaces for relaxation and rejuvenation, including three bedrooms designed to offer residents a private retreat. The one full bathroom is efficiently designed to meet daily needs. With 1554 square feet of living area, this condominium offers room to breathe and create lasting memories on the 871 square feet lot area. Built in 1980, this single-story home offers a blend of established charm and modern potential. This condo
Key facts
- $181 HOA
- Garage
- Built 1980
Property features AI
Finance
- Other: Ownership interest: Other/See Remarks
- Financial info: Monthly association fee of $181
- HOA & community: HOA with monthly fee
Exterior
- Parking: Attached garage (1 car)
- Utilities: Public water; Municipal sewer connection; Solid waste service
- Home design: Residential condominium; Attached property; Vertical condo, upper-level unit; One story
- Construction: Brick, vinyl siding, and stucco exterior; Poured concrete foundation
- Exterior features: End unit; Less than 1/4 acre
Interior
- Kitchen: Electric cooktop; Electric oven; Dishwasher
- Bedrooms: Primary bedroom with walk-in closet; Three main-level bedrooms
- Flooring: Single-floor residence
- Bathrooms: One full bathroom on the main level
- Heating & cooling: Forced air heating; Central air conditioning
- Interior features: Pantry; Dining room fireplace
- Laundry & utility: Main-level laundry
Neighborhood map
What this means for you Summary
Snapshot
- This is a 3-bed/1.0-bath condo listed at $125k.
Deal economics
- At list price, monthly cash flow is $108 ($1k/yr) — positive.
- The deal already cash-flows at list — no discount required.
- Meets the 1% rule at list price ($2k rent vs $125k).
- Recommended offer: $110k (12.0% below list) — sets the bar for market timing.
- Cap rate 7.3% vs local median 4.4% in Indianapolis city (balance) — top-decile yield for the area; either an underpriced asset or a hidden risk that comps aren't pricing in. Stress-test before assuming the spread holds.
Location & tenants
- Location reads: area grade C — affects rentability + tenant quality, not the cash-flow math above.
- Perry Township Schools (urban): math 36% / reading 45% proficiency, ranked #138 of 301 in IN (top 46%) — families likely to look elsewhere, expect single-tenant / working-renter base with shorter leases.
- Zoned schools: Winchester Village Elementary (math 28% / reading 26%, grade F, #737 of 994 statewide, top 76%, 619 students, 85% FRL); Southport High School (math 25% / reading 53%, grade F, #235 of 369 statewide, top 65%, 2,355 students, 70% FRL) — zoned schools average 77% FRL vs 54% district-wide (24 pts higher); higher-poverty schools than district average — tighter screening recommended.
- Market conditions: Rents rising (+2.5%/yr); 245 active listings in the ZIP; 21 comparable units currently listed for rent nearby; rentals leasing fast (median 11d on market — plan ~1-2 weeks tenant-placement turnaround); 1,906 units permitted in Marion County in 2024 (621 in 5+ unit buildings).
- This rent runs 37% of the median local income ($54k/yr) — at the standard rent-burdened threshold; future hikes will face affordability resistance.
Forward outlook
- Local home prices are declining (-3.0%/yr); year-one equity from $864 of loan paydown is wiped out by about $4k of value loss. Plan a longer hold.
- Marion County population projected at +18% by 2050 — long-run rental-demand tailwind backs the buy-and-hold thesis.
Negotiation context
- It's been on market 191 days — a 12% lower offer ($110k) is reasonable based on typical stale-listing flexibility.
Risks & watch-outs
- Watch-outs: property tax is 2.9% of price.
Questions for the listing agent
- It's been on market 191 days. Have you received any prior offers? Is the seller open to a 12% concession, seller financing, or rate buy-down credit?
- Property tax is high relative to price — has the assessment been appealed recently, and will the sale trigger a re-assessment?
- What does the HOA fee cover, when was the last increase, and are there any pending special assessments or reserve-fund shortfalls?
- Any open or pending special assessments — roof, HVAC, plumbing, elevator, façade? What's the per-unit balance and payoff schedule, and is the seller paying it off at close or rolling it to the buyer?
- Why hasn't it sold? Are there any deal-killer items the seller is aware of (foundation, flood, title, zoning, code violations)?
- Is there a deadline driving the sale (1031 exchange, divorce, estate, relocation)? That informs how much negotiation room exists.
- What's the average days-on-market for RENTAL listings here right now (not sales)? A rising rental-DOM trend means longer vacancies and softer asking-rent achievability than the comps imply.
- What's the recent tenant-quality profile in this submarket — average credit score on applications, eviction rate, late-payment / NSF rate, and stable-employment percentage? A property-management company in the area should have these aggregated.
- How much new apartment / multifamily construction is in the pipeline within 1–3 miles? Heavy new supply (>2% of stock underway) typically softens rents 12–24 months out; light construction supports rent growth.
Investment metrics
- 1% rule
- 1.32% ✓
- Cap rate
- 7.33%
- Cash-on-cash
- 3.70%
- DSCR
- 1.16
- GRM
- 6.3
CMA / ARV
No comps found within radius.
Projected returns pro-forma
-3.0% appreciation · 2.46% rent growth · sell at horizon
- IRR
- -11.1%
- Equity multiple
- 0.60×
- Total profit
- $-14,043
- Equity at exit
- $18,638
- IRR
- -2.6%
- Equity multiple
- 0.83×
- Total profit
- $-6,065
- Equity at exit
- $10,808
Cash invested: $35,000 (down + closing). Projections, not guarantees.
Landlord ↔ Tenant lean methodology
- Overall (STATE)
- 90 Strongly Landlord-Friendly
- State Indiana
- 90 Strongly Landlord-Friendly · R+11
- County
- — inherits STATE
- City
- — inherits STATE
ZIP-level market 46227
- Rents YoY
- 2.5%
- Active inventory
- 245
- Price-to-rent
- 6.3×
Monthly cashflow live
- Estimated rent
- $1,644 high interval (Pro) →
- Mortgage (P&I)
- −$656
- Tax from tax record
- −$302 /mo · $3,625/yr
- Insurance
- −$52
- HOA
- −$181
- Vacancy / Maint / Mgmt
- −$345
- Net cashflow
- $108
Break-even live
UW: 25.0% down · 7.5% · 30yr · 1.5% tax · 5.0% vac · 8.0% maint · 8.0% mgmt
Financing live
Cash to close
- Down payment
- $31,250
- Closing costs
- $3,750
- Reserves months
- —
- Total cash needed
- —
Loan-product check · same deal, 3 products live
Conventional
25% down · 7.5% · 30yr
- Down + closing
- —
- Monthly P&I
- —
- Monthly cashflow
- —
- DSCR
- —
- Eligible?
- —
Personal DTI + credit; lowest rate.
DSCR
20% down · 8.5% · 30yr
- Down + closing
- —
- Monthly P&I
- —
- Monthly cashflow
- —
- DSCR
- —
- Eligible?
- —
No personal income docs; deal must DSCR.
Hard money
10% down · 12.0% · 12mo
- Down + closing
- —
- Monthly P&I
- —
- Monthly cashflow
- —
- DSCR
- —
- Eligible?
- —
Short-term bridge; refi at stabilization.
Rent comps 21 comps
| Address | Beds | Baths | Sqft | Rent | $/sqft | DOM | Units | Dist |
|---|---|---|---|---|---|---|---|---|
| 8213 Zona Dr Indianapolis, IN | 1.0–3.0 | 1.0–1.5 | 935 | $1,480 | $1.58 | 1d | 16 | 0.36mi |
| 2816 E County Line Rd Indianapolis, IN | 2.0 | 1.0 | 1265 | $910 | $0.72 | 23d | 1 | 0.41mi |
| 8631 Pleasant Creek Ct Indianapolis, IN | 3.0 | 2.0 | 1120 | $1,706 | $1.52 | 7d | 1 | 0.46mi |
| 3503 Pleasant Lake Dr Indianapolis, IN | 3.0 | 1.0 | 1064 | $1,615 | $1.52 | 12d | 1 | 0.58mi |
| 1703 E 12 Rd Stop 12 Indianapolis, IN | 3.0 | 2.0 | 1840 | $1,899 | $1.03 | 10d | 1 | 0.58mi |
| 8126 Xenia Dr Indianapolis, IN | 3.0 | 2.0 | 1176 | $4,500 | $3.83 | 1d | 1 | 0.59mi |
| 7909 Southfield Dr Indianapolis, IN | 3.0 | 2.0 | 1056 | $1,445 | $1.37 | 7d | 1 | 0.60mi |
| 3624 Fredricksburg Dr Indianapolis, IN | 3.0 | 2.5 | 1904 | $1,776 | $0.93 | 1d | 1 | 0.65mi |
| 3717 Piermont Dr Indianapolis, IN | 1.0–3.0 | 1.0–2.0 | 1038 | $1,730 | $1.67 | 2d | 23 | 0.69mi |
| 1933 Lisa Walk Dr Indianapolis, IN | 3.0 | 2.0 | 1374 | $1,670 | $1.22 | 14d | 1 | 0.83mi |
| 14 Greenwood Trl N Greenwood, IN | 2.0 | 1.5 | 1088 | $1,275 | $1.17 | 14d | 1 | 0.90mi |
| 7913 Ella Dobbs Ln Indianapolis, IN | 1.0–3.0 | 1.0–2.0 | 1021 | $1,650 | $1.62 | 23d | 1 | 0.92mi |
| 968 Greenwood Trl W Greenwood, IN | 2.0 | 2.0 | 1088 | $1,475 | $1.36 | 12d | 1 | 0.93mi |
| 921 Parliament Pl Greenwood, IN | 1.0–3.0 | 1.0–2.0 | 994 | $1,525 | $1.53 | 2d | 30 | 0.95mi |
| 1542 Citrin Pl Unit 1538 Indianapolis, IN | 3.0 | 2.5 | 1299 | $1,755 | $1.35 | 16d | 1 | 1.10mi |
| 1542 Citrin Pl Indianapolis, IN | 3.0 | 2.5 | 1299 | $1,755 | $1.35 | 2d | 1 | 1.10mi |
| 745 Wood Dale Ter Greenwood, IN | 1.0–3.0 | 1.0–1.5 | 1032 | $1,659 | $1.61 | 2d | 10 | 1.22mi |
| 1043 Mikes Way Greenwood, IN | 3.0 | 2.0 | 1090 | $1,650 | $1.51 | 43d | 1 | 1.30mi |
| 1009 Lismore Ln Indianapolis, IN | 1.0–2.0 | 1.0–2.0 | 875 | $1,365 | $1.56 | 23d | 1 | 1.32mi |
| 614 Park Madison Dr Greenwood, IN | 2.0 | 2.0 | 1150 | $1,250 | $1.09 | 10d | 1 | 1.34mi |
| 4545 Scarlet Oak Way Indianapolis, IN | 1.0–3.0 | 1.0–2.0 | 1101 | $2,061 | $1.87 | 1d | 16 | 1.41mi |
HOA detail condo
- Monthly dues
- $181 · $2,172/yr
- Assessments
- None detected in remarks — confirm with the listing agent.
Listing history 13 events
-
2026-06-18days on market $125,000 Active 191 DOM
-
2026-06-17days on market $125,000 Active 190 DOM
-
2026-06-16days on market $125,000 Active 189 DOM
-
2026-06-15days on market $125,000 Active 188 DOM
-
2026-06-13days on market $125,000 Active 186 DOM
-
2026-06-09days on market $125,000 Active 182 DOM
-
2026-06-08days on market $125,000 Active 181 DOM
-
2026-06-07days on market $125,000 Active 180 DOM
-
2026-06-03days on market $125,000 Active 176 DOM
-
2026-06-02days on market $125,000 Active 175 DOM
-
2026-06-01days on market $125,000 Active 174 DOM
-
2026-05-31days on market $125,000 Active 173 DOM
-
2025-12-09$125,000 Active
ⓘ Source: listings_history table (triggers on properties + properties_extension) + one-shot
backfill from property_details.listing_events for pre-trigger history.
Tax reassessment forecast IN · Partial reset (capped growth)
- Current annual tax
- $3,625 · $302/mo
- Projected year-2 tax
- $3,625 · $302/mo
- Expected delta
- $0/yr ($0/mo · 0.0%)
ⓘ Screening estimate from a state-policy table — verify with the county assessor before closing.
Climate risk First Street
- Flood 1/10 Low FEMA zone X (unshaded) · 0% chance over 30 yrs
- Wildfire 1/10 Low
- Heat 3/10 Moderate 7 d/yr ≥101°F today · 19 d/yr by 30 yrs out
- Wind 2/10 Low 100% chance of damaging wind over 30 yrs
- Air quality 2/10 Low 2 unhealthy d/yr today · 2 by 30 yrs out
Nearby sold comps map
Loading sold comps map…
Walkable amenities ~0.75 mi
Loading nearby amenities…
Taxation est. · year 1
- Rental income
- $19,726
- − Mortgage interest
- −$7,002
- − Property taxes
- −$3,625
- − Insurance
- −$625
- − Repairs & maintenance
- −$1,578
- − Management
- −$1,578
- − HOA
- −$2,172
- − Depreciation
- −$3,636
- Taxable loss
- −$491
- Est. tax savings @ 24.0%
- +$118
- After-tax cash flow
- $1,413/yr
For passive investors: Depreciation is non-cash, so a rental often shows a tax loss while cash-flowing — sheltering income. Rental losses are passive: they offset passive income freely, and up to $25,000/yr can offset ordinary (W-2) income if you actively participate and your MAGI is under $100k (phasing out to $0 by $150k); unused losses carry forward. On sale, claimed depreciation is recaptured at up to 25%, and gains may owe capital-gains tax (a 1031 exchange can defer both). Figures are a year-1 estimate at your 24.0% rate — not tax advice; consult a CPA.
Schools (NCES district)
- District
- Perry Township Schools
- NCES district ID
- 1808820
- Math proficiency
- 36% ▼ -13.00%
- Reading proficiency
- 45% ▼ -6.00%
- Median HH income
- $47,170
- Composite
- 34.61/100
- National rank
- #5153
- State rank
- #138 of 301 in IN
Livability — Indianapolis city (balance)
No livability data for this city. (Only ~50 U.S. cities are tracked.)
Census & demographics
- Census place
- Indianapolis city (balance), IN
- County
- Marion County · 998,460 people
- City population
- 881,119
- Metro
- Indianapolis-Carmel-Anderson, IN
- Population (ZIP)
- 57,587
- Household income
- $53,629
- Rent vs Own
- Severe rent burden
- 3583.0
Population outlook (Marion County) Hauer SSP2
- Today (2025)
- 1,025,572 people
- By 2030
- 1,065,727 · +3.9%
- By 2040
- 1,141,577 · +11.3%
- By 2050
- 1,208,920 · +17.9%
- By 2075
- 1,367,288 · +33.3%
- By 2100
- 1,438,201 · +40.2%
Race, ethnicity, and origin ACS 2023
- Neighborhood character
- Diverse neighborhood (Simpson 0.59)
- Race & ethnicity
- White 61% Asian 12% Black 11% Hispanic / Latino 10% Two or more races 8%
- Hispanic origin (detail)
- Mexican 8%
- Common ancestry
- Italian 2% Slovak 2% Lithuanian 1%
- Foreign-born
- 17% · Philippines, Canada, Vietnam
- Languages at home
- 79% English-only · Other Asian/Pacific 9% Spanish 7% Other Indo-European 1%
Political lean MEDSL · Marion
- 2024 margin
- Strong D (+27.7) · D 63.0% · R 35.3% · Other 1.7%
- 2008→2024 swing
- -0.7pp no change · 2008: 28.4pp · 2024: 27.7pp
- All cycles
- 2024: D+27.7 2020: D+29.1 2016: D+22.8 2012: D+22.2 2008: D+28.4
Not yet ingested
- Civics
- —
Market trends
- HPI YoY
- ▼ -260.49%
- Current HPI
- 276.8271
- Rent YoY
- ▲ 2.46%
- Metro
- Indianapolis-Carmel-Anderson, IN
- State GDP YoY
- ▲ 2.90%
- F500 in state
- 18
Industry mix (Fortune 500 HQ in IN)
| Industry | F500 HQs | Revenue |
|---|---|---|
| Industrial Machinery | 2 | $37B |
|
||
| Healthcare | 1 | $177B |
|
||
| Pharmaceuticals | 1 | $45B |
|
||
| Metals / Steel | 1 | $18B |
|
||
| Agriculture | 1 | $17B |
|
||
| Packaging | 1 | $12B |
|
||
Price history
1 event — show timeline
- 2025-12-09 Listed $125,000 MIBOR as Distributed by MLS Grid
Property tax history
+18.9%/yrLatest (2025): $3,625 · +6.7% YoY. Source: county tax records.
Cash-flow waterfall
monthlySold comps — $/sqft
last 12 mo · ≤1 miLoading sold comps…