702 W Malone · San Antonio, TX
Flood risk 1/10 · Minimal
- FEMA flood zone
- X (unshaded)
- Chance of flooding over 30 yrs
- 0.0%
- Est. flood insurance / yr
- $507 – $1,088
Fire risk 1/10 · Minimal
- Est. fire insurance / yr
- $1,222 – $2,270
Heat risk 8/10 · Major
- Hot days now (above 109°F)
- 7 days/yr
- Hot days in 30 yrs
- 21 days/yr
Wind risk 8/10 · Major
- Chance of severe wind over 30 yrs
- 80.0%
Air-quality risk 2/10 · Minimal
- Unhealthy air days now
- 1 days/yr
- Unhealthy air days in 30 yrs
- 2 days/yr
Risk factors via First Street. Map © Google.
Why this score? — see what drove the C- grade
The composite is a weighted blend of 9 inputs, each scored 0–100. Each bar is that input's sub-score; the figure is the points it added to the 100-point composite (weight × sub-score).
- Cash flow +15.2/30.0
- ARV discount +9.4/15.0
- Appreciation +6.9/10.0
- DSCR +4.7/10.0
- 1% rule +4.6/10.0
- Livability +4.0/5.0
- Rent growth +2.5/5.0
- Condition / age +2.5/5.0
- Schools +1.4/10.0
$110,000
🖨 Deal sheet 📄 Offer letter ✓ Due diligence
Listing remarks MLS
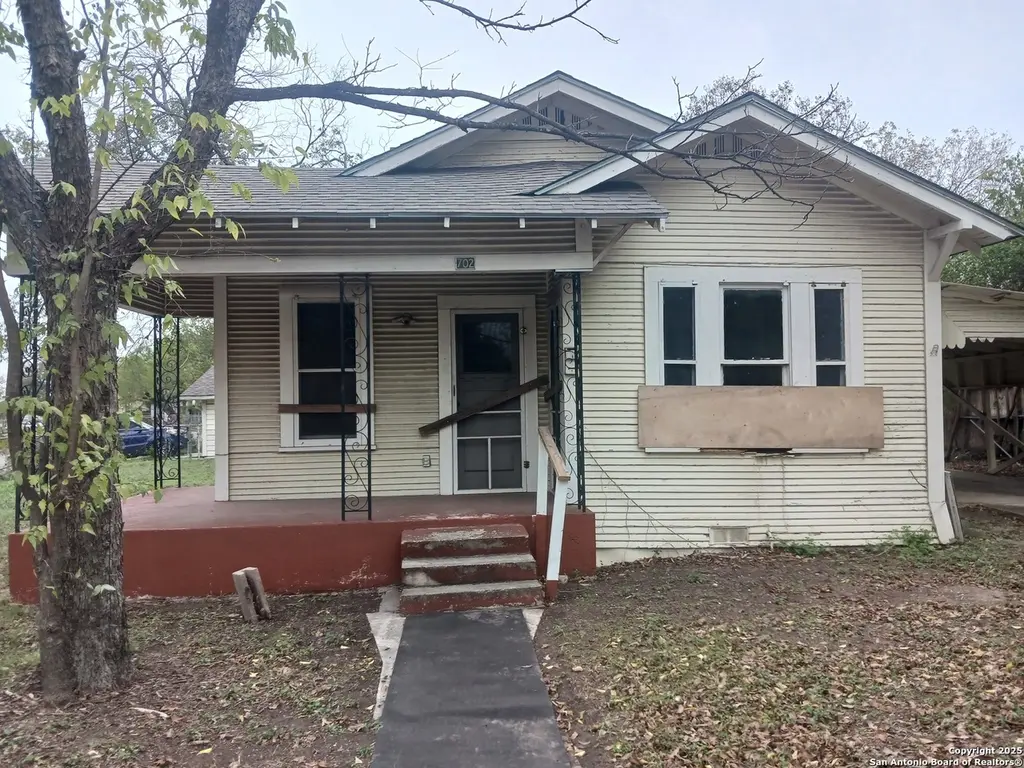
**Investment Opportunity**: This property is situated off IH35 South on Malone. It features a 2-bedroom, 1-bathroom layout, including a living room and a formal dining room, set on a corner lot. The property includes two driveways and a 1-car carport. Additionally, there is a screened-in porch and a 1-car garage, which offers a workshop or extra storage space. The large yard is enhanced by mature trees, providing ample shade. This diamond just needs some effort to restore its glory.
Key facts
- Two driveways
- Screened-in porch
- Large yard
Tags
Neighborhood map
What this means for you Summary
Snapshot
- This is a 2-bed/1.0-bath single-family listed at $110k.
Deal economics
- At list price, monthly cash flow is $38 ($454/yr) — positive.
- The deal already cash-flows at list — no discount required.
- To meet the 1% rule (rent ≥ 1% of price), the offer needs to be $105k (4.1% below list).
- Recommended offer: $97k (12.0% below list) — sets the bar for market timing.
- Cap rate 6.7% vs local median 3.8% in San Antonio — top-decile yield for the area; either an underpriced asset or a hidden risk that comps aren't pricing in. Stress-test before assuming the spread holds.
Location & tenants
- Location reads 80/100 on livability (#31 in TX, #1,616 nationally) — a professional / high-income tenant draw. Strengths: amenities A+, commute A+, cost of living A+; Watch: schools C-, crime F.
- San Antonio ISD (urban): math 12% / reading 22% proficiency, ranked #805 of 826 in TX (top 98%) — low school quality limits family demand, transient renter base, plan for 1-2y turnover; 80% free/reduced lunch — lower-income household profile, screen leases tightly.
- Market conditions: 36 active listings in the ZIP; 27 comparable units currently listed for rent nearby; rentals at typical pace (median 22d on market — plan ~3-4 weeks tenant-placement turnaround); 8,308 units permitted in Bexar County in 2024 (2,506 in 5+ unit buildings).
Forward outlook
- In year one you build about $5k of equity ($761 loan paydown + $4k appreciation (3.8% local appreciation)).
- Bexar County population projected at +50% by 2050 — long-run rental-demand tailwind backs the buy-and-hold thesis.
- At projected returns (3.8% appreciation + 3.0% rent growth), your $31k cash investment doubles in ~5 years — after that, you're playing with house money.
- By year 7, paydown + projected appreciation supports a ~$31k cash-out refi (75% LTV) — recoverable capital for the next deal without selling this one.
Negotiation context
- It's been on market 153 days — a 12% lower offer ($97k) is reasonable based on typical stale-listing flexibility.
- 2 sale attempts; this cycle's ask has dropped $30k (21%) from the opening price — seller is motivated, your offer sets the floor, not the list.
Risks & watch-outs
- Watch-outs: built in 1941 — expect roof / HVAC / electrical / plumbing capex.
- Climate carrying-cost: severe wind risk, 80% chance of damaging wind over 30y; extreme-heat days projected 7→21/yr by 2055 (HVAC capex compounding) — expect insurance premiums to compound above CPI over the hold.
Questions for the listing agent
- It's been on market 153 days. Have you received any prior offers? Is the seller open to a 12% concession, seller financing, or rate buy-down credit?
- Built in 1941 — when were the roof, HVAC, electrical panel, plumbing, and water heater last replaced?
- Why hasn't it sold? Are there any deal-killer items the seller is aware of (foundation, flood, title, zoning, code violations)?
- Is there a deadline driving the sale (1031 exchange, divorce, estate, relocation)? That informs how much negotiation room exists.
- Crime grade is F in this area — have there been break-ins, vandalism, or insurance claims at this property in the last 3 years? What carrier currently insures it and at what premium?
- What's the average days-on-market for RENTAL listings here right now (not sales)? A rising rental-DOM trend means longer vacancies and softer asking-rent achievability than the comps imply.
- What's the recent tenant-quality profile in this submarket — average credit score on applications, eviction rate, late-payment / NSF rate, and stable-employment percentage? A property-management company in the area should have these aggregated.
- How much new for-sale + rental construction is in the pipeline within 1–3 miles? Heavy new supply typically softens prices + rents 12–24 months out; constrained supply supports both.
Investment metrics
- 1% rule
- 0.96% ✗
- Cap rate
- 6.71%
- Cash-on-cash
- 1.48%
- DSCR
- 1.07
- GRM
- 8.7
CMA / ARV
- ARV (median comp)
- $114,966
- List price
- $110,000
- Delta
- -4.32%
- Verdict
- FAIR
- Comps
- 20 within 1.0 mi
Show comp detail 12 sales within ~0.75 mi
| Address | Dist | Beds/Ba | Sqft | Sold | Price | $/sf | Match |
|---|---|---|---|---|---|---|---|
| 702 W Malone | 0.00mi | 2/1.0 | 696 (0%) | 1mo | $110,000 | $158 | 99 |
| 1101 Prado St | 0.39mi | 2/1.0 | 690 (-1%) | 14mo | $72,000 | $104 | 69 |
| 815 Ripford St | 0.45mi | 2/1.0 | 728 (+5%) | 15mo | $85,000 | $117 | 59 |
| 617 Dewitt | 0.59mi | 2/1.0 | 748 (+8%) | 3mo | $160,000 | $214 | 58 |
| 343 Sims Ave | 0.24mi | 2/1.0 | 640 (-8%) | 22mo | $60,000 | $94 | 57 |
| 410 Weinberg Ave | 0.60mi | 2/1.0 | 720 (+3%) | 11mo | $129,700 | $180 | 57 |
| 214 Eskimo St | 0.54mi | 2/1.0 | 720 (+3%) | 19mo | $75,000 | $104 | 53 |
| 115 Chico Aly | 0.42mi | 2/1.0 | 740 (+6%) | 22mo | $142,900 | $193 | 52 |
| 203 Big Foot | 0.75mi | 2/2.0 | 714 (+3%) | 10mo | $139,900 | $196 | 49 |
| 724 Ripford | 0.42mi | 2/1.0 | 784 (+13%) | 14mo | $89,000 | $114 | 48 |
| 147 Walton | 0.57mi | 2/1.0 | 800 (+15%) | 3mo | $219,999 | $275 | 46 |
| 223 Lancaster St | 0.70mi | 2/1.0 | 592 (-15%) | 2mo | $123,000 | $208 | 41 |
Match score weights: distance 35% · size 25% · config 20% · recency 20%. Top-matched comps best support the ARV.
Projected returns pro-forma
3.81% appreciation · 3.0% rent growth · sell at horizon
- IRR
- 11.1%
- Equity multiple
- 1.66×
- Total profit
- $20,473
- Equity at exit
- $54,538
- IRR
- 12.9%
- Equity multiple
- 3.07×
- Total profit
- $63,867
- Equity at exit
- $88,231
Cash invested: $30,800 (down + closing). Projections, not guarantees.
Landlord ↔ Tenant lean methodology
- Overall (STATE)
- 87 Strongly Landlord-Friendly
- State Texas
- 87 Strongly Landlord-Friendly · R+5
- County
- — inherits STATE
- City
- — inherits STATE
ZIP-level market 78225
- Home prices YoY
- 1.5%
- Active inventory
- 36
- Price-to-rent
- 8.7×
Monthly cashflow live
- Estimated rent
- $1,055 high interval (Pro) →
- Mortgage (P&I)
- −$577
- Tax from tax record
- −$173 /mo · $2,074/yr
- Insurance
- −$46
- HOA
- −$0
- Vacancy / Maint / Mgmt
- −$222
- Net cashflow
- $38
Break-even live
UW: 25.0% down · 7.5% · 30yr · 1.5% tax · 5.0% vac · 8.0% maint · 8.0% mgmt
Financing live
Cash to close
- Down payment
- $27,500
- Closing costs
- $3,300
- Reserves months
- —
- Total cash needed
- —
Loan-product check · same deal, 3 products live
Conventional
25% down · 7.5% · 30yr
- Down + closing
- —
- Monthly P&I
- —
- Monthly cashflow
- —
- DSCR
- —
- Eligible?
- —
Personal DTI + credit; lowest rate.
DSCR
20% down · 8.5% · 30yr
- Down + closing
- —
- Monthly P&I
- —
- Monthly cashflow
- —
- DSCR
- —
- Eligible?
- —
No personal income docs; deal must DSCR.
Hard money
10% down · 12.0% · 12mo
- Down + closing
- —
- Monthly P&I
- —
- Monthly cashflow
- —
- DSCR
- —
- Eligible?
- —
Short-term bridge; refi at stabilization.
Rent comps 27 comps
| Address | Beds | Baths | Sqft | Rent | $/sqft | DOM | Units | Dist |
|---|---|---|---|---|---|---|---|---|
| 416 Collingsworth Unit 2 San Antonio, TX | 2.0 | 1.0 | 570 | $1,100 | $1.93 | 43d | 1 | 0.19mi |
| 520 Prado St Unit 1 San Antonio, TX | 2.0 | 1.0 | 620 | $799 | $1.29 | 43d | 1 | 0.19mi |
| 815 Ripford St San Antonio, TX | 2.0 | 1.0 | 728 | $1,300 | $1.79 | 4d | 1 | 0.45mi |
| 834 Division Ave San Antonio, TX | 2.0 | 1.0 | 700 | $1,050 | $1.50 | 24d | 1 | 0.59mi |
| 107 Stanley Ct Apt 4 San Antonio, TX | 1.0 | 1.0 | 375 | $825 | $2.20 | 4d | 1 | 0.67mi |
| 107 Stanley Ct Apt 3 San Antonio, TX | 2.0 | 1.0 | 575 | $950 | $1.65 | 20d | 1 | 0.67mi |
| 103 Stanley Ct Unit 1 San Antonio, TX | 1.0 | 1.0 | 450 | $900 | $2.00 | 20d | 1 | 0.68mi |
| 330 Barrett Pl San Antonio, TX | 1.0 | 1.0 | 400 | $900 | $2.25 | 12d | 1 | 0.73mi |
| 350 Barrett Pl San Antonio, TX | 2.0 | 1.0 | 616 | $1,225 | $1.99 | 4d | 1 | 0.77mi |
| 226 E Malone Ave San Antonio, TX | 2.0 | 1.0 | 693 | $1,100 | $1.59 | 22d | 1 | 0.78mi |
| 165 Division Ave Unit 2 San Antonio, TX | 1.0 | 1.0 | 617 | $700 | $1.13 | 22d | 1 | 0.82mi |
| 165 Division Ave Unit 2 San Antonio, TX | 1.0 | 1.0 | 617 | $725 | $1.18 | 43d | 1 | 0.82mi |
| 1202 Division Ave San Antonio, TX | 1.0 | 1.0 | 550 | $1,100 | $2.00 | 24d | 1 | 0.84mi |
| 1222 Brighton Ave Unit B San Antonio, TX | 3.0 | 1.0 | 725 | $999 | $1.38 | 17d | 1 | 1.03mi |
| 2600 S Flores St San Antonio, TX | 2.0 | 1.0 | 705 | $900 | $1.28 | 24d | 3 | 1.05mi |
| 131 Klein St #1 San Antonio, TX | 2.0 | 1.0 | 653 | $1,395 | $2.14 | 44d | 1 | 1.11mi |
| 112 Oelkers San Antonio, TX | 1.0 | 1.0 | 420 | $1,100 | $2.62 | 3d | 1 | 1.15mi |
| 112 Oelkers St Unit 2 San Antonio, TX | 1.0 | 1.0 | 375 | $950 | $2.53 | 43d | 1 | 1.15mi |
| 323 W Mitchell St San Antonio, TX | 1.0–2.0 | 1.0–2.0 | 788 | $1,257 | $1.59 | 3d | 1 | 1.15mi |
| 205 W Lambert St San Antonio, TX | 2.0 | 1.0 | 550 | $995 | $1.81 | 17d | 1 | 1.16mi |
| 150 Bank St San Antonio, TX | 1.0 | 1.0 | 700 | $795 | $1.14 | 43d | 1 | 1.16mi |
| 150 Bank St Unit C San Antonio, TX | 1.0 | 1.0 | 600 | $749 | $1.25 | 20d | 1 | 1.16mi |
| 125 Forrest Ave San Antonio, TX | 2.0 | 1.0 | 616 | $1,275 | $2.07 | 16d | 1 | 1.23mi |
| 1901 S San Marcos Unit 610 San Antonio, TX | 1.0 | 1.0 | 750 | $962 | $1.28 | 3d | 1 | 1.28mi |
| 121 E Mitchell St San Antonio, TX | 2.0 | 1.0 | 528 | $850 | $1.61 | 43d | 1 | 1.29mi |
| 128 Saint Francis Ave Unit 3 San Antonio, TX | 1.0 | 1.0 | 528 | $775 | $1.47 | 24d | 1 | 1.33mi |
| 515 Humble Ave San Antonio, TX | 1.0 | 1.0 | 700 | $810 | $1.16 | 43d | 1 | 1.48mi |
Listing history 7 events
-
2026-03-25price $110,000 487-char remark
Show marketing remark (487 chars)
**Investment Opportunity**: This property is situated off IH35 South on Malone. It features a 2-bedroom, 1-bathroom layout, including a living room and a formal dining room, set on a corner lot. The property includes two driveways and a 1-car carport. Additionally, there is a screened-in porch and a 1-car garage, which offers a workshop or extra storage space. The large yard is enhanced by mature trees, providing ample shade. This diamond just needs some effort to restore its glory.
-
2026-03-25status Back on Market 487-char remark
Show marketing remark (487 chars)
**Investment Opportunity**: This property is situated off IH35 South on Malone. It features a 2-bedroom, 1-bathroom layout, including a living room and a formal dining room, set on a corner lot. The property includes two driveways and a 1-car carport. Additionally, there is a screened-in porch and a 1-car garage, which offers a workshop or extra storage space. The large yard is enhanced by mature trees, providing ample shade. This diamond just needs some effort to restore its glory.
-
2026-03-02status Pending 487-char remark
Show marketing remark (487 chars)
**Investment Opportunity**: This property is situated off IH35 South on Malone. It features a 2-bedroom, 1-bathroom layout, including a living room and a formal dining room, set on a corner lot. The property includes two driveways and a 1-car carport. Additionally, there is a screened-in porch and a 1-car garage, which offers a workshop or extra storage space. The large yard is enhanced by mature trees, providing ample shade. This diamond just needs some effort to restore its glory.
-
2025-12-01$140,000 New 487-char remark
Show marketing remark (487 chars)
**Investment Opportunity**: This property is situated off IH35 South on Malone. It features a 2-bedroom, 1-bathroom layout, including a living room and a formal dining room, set on a corner lot. The property includes two driveways and a 1-car carport. Additionally, there is a screened-in porch and a 1-car garage, which offers a workshop or extra storage space. The large yard is enhanced by mature trees, providing ample shade. This diamond just needs some effort to restore its glory.
-
2025-09-18soldstatus
-
1998-06-29soldstatus
-
1998-06-29soldstatus
ⓘ Source: listings_history table (triggers on properties + properties_extension) + one-shot
backfill from property_details.listing_events for pre-trigger history.
Tax reassessment forecast TX · Resets to sale price
- Current annual tax
- $2,074 · $173/mo
- Projected year-2 tax
- $2,074 · $173/mo
- Expected delta
- $0/yr ($0/mo · 0.0%)
ⓘ Screening estimate from a state-policy table — verify with the county assessor before closing.
Climate risk First Street
- Flood 1/10 Low FEMA zone X (unshaded) · 0% chance over 30 yrs
- Wildfire 1/10 Low
- Heat 8/10 Severe 7 d/yr ≥109°F today · 21 d/yr by 30 yrs out
- Wind 8/10 Severe 80% chance of damaging wind over 30 yrs
- Air quality 2/10 Low 1 unhealthy d/yr today · 2 by 30 yrs out
Nearby sold comps map
Loading sold comps map…
Walkable amenities ~0.75 mi
Loading nearby amenities…
Taxation est. · year 1
- Rental income
- $12,660
- − Mortgage interest
- −$6,162
- − Property taxes
- −$2,074
- − Insurance
- −$550
- − Repairs & maintenance
- −$1,013
- − Management
- −$1,013
- − Depreciation
- −$3,200
- Taxable loss
- −$1,352
- Est. tax savings @ 24.0%
- +$325
- After-tax cash flow
- $779/yr
For passive investors: Depreciation is non-cash, so a rental often shows a tax loss while cash-flowing — sheltering income. Rental losses are passive: they offset passive income freely, and up to $25,000/yr can offset ordinary (W-2) income if you actively participate and your MAGI is under $100k (phasing out to $0 by $150k); unused losses carry forward. On sale, claimed depreciation is recaptured at up to 25%, and gains may owe capital-gains tax (a 1031 exchange can defer both). Figures are a year-1 estimate at your 24.0% rate — not tax advice; consult a CPA.
Schools (NCES district)
- District
- San Antonio ISD
- NCES district ID
- 4838730
- Math proficiency
- 12% ▼ -21.00%
- Reading proficiency
- 22% ▼ -7.00%
- Median HH income
- $30,952
- Composite
- 13.57/100
- National rank
- #9512
- State rank
- #805 of 826 in TX
Livability — San Antonio
- Score
- 80/100
- State rank
- #31
- US rank
- #1616
Category grades
Schools grade is shown separately in the Schools card above.
Census & demographics
- Census place
- San Antonio, TX
- County
- Bexar County · 1,990,555 people
- City population
- 1,806,925
- Metro
- San Antonio-New Braunfels, TX
- Population (ZIP)
- 13,104
- Household income
- $46,955
- Rent vs Own
- Severe rent burden
- 381.0
Population outlook (Bexar County) Hauer SSP2
- Today (2025)
- 2,336,851 people
- By 2030
- 2,560,728 · +9.6%
- By 2040
- 3,020,569 · +29.3%
- By 2050
- 3,493,522 · +49.5%
- By 2075
- 4,668,459 · +99.8%
- By 2100
- 5,533,242 · +136.8%
Race, ethnicity, and origin ACS 2023
- Neighborhood character
- Predominantly Hispanic (91%)
- Race & ethnicity
- Hispanic / Latino 91% Two or more races 41% White 5% Black 4% Native American 3%
- Hispanic origin (detail)
- Mexican 85%
- Foreign-born
- 13% · Canada
- Languages at home
- 35% English-only · Spanish 65%
Political lean MEDSL · Bexar
- 2024 margin
- Lean D (+9.8) · D 54.3% · R 44.6% · Other 1.1%
- 2008→2024 swing
- +4.2pp toward D · 2008: 5.6pp · 2024: 9.8pp
- All cycles
- 2024: D+9.8 2020: D+18.2 2016: D+13.5 2012: D+4.6 2008: D+5.6
Not yet ingested
- Civics
- —
Market trends
- HPI YoY
- ▲ 3.81%
- Current HPI
- 264.2018
- Rent YoY
- —
- Metro
- San Antonio-New Braunfels, TX
- State GDP YoY
- ▲ 3.95%
- F500 in state
- 110
Industry mix (Fortune 500 HQ in TX)
| Industry | F500 HQs | Revenue |
|---|---|---|
| Energy | 16 | $1,198B |
|
||
| Technology | 5 | $198B |
|
||
| Engineering / Construction | 4 | $72B |
|
||
| Energy Services | 3 | $60B |
|
||
| Utilities | 3 | $41B |
|
||
| Healthcare | 2 | $330B |
|
||
Price history
-21.4% since first listed7 events — show timeline
- 2026-03-25 Price Changed $110,000 LERA
- 2026-03-25 Relisted — LERA
- 2026-03-02 Pending — LERA
- 2025-12-01 Listed $140,000 LERA
- 2025-09-18 Sold (Public Records) — Public Records
- 1998-06-29 Sold (Public Records) — Public Records
- 1998-06-29 Sold (Public Records) — Public Records
Property tax history
+5.0%/yrLatest (2025): $2,074 · +0.0% YoY. Source: county tax records.
Cash-flow waterfall
monthlySold comps — $/sqft
last 12 mo · ≤1 miLoading sold comps…