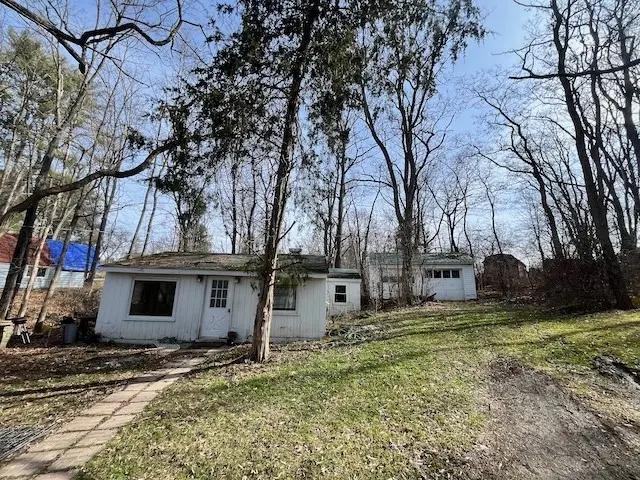
903 Cayuga Heights Rd · Lansing, NY
Flood risk 10/10 · Severe
- FEMA flood zone
- —
- Chance of flooding over 30 yrs
- 0.99%
- Est. flood insurance / yr
- —
Fire risk 1/10 · Minimal
- Est. fire insurance / yr
- $691 – $1,283
Heat risk 2/10 · Minimal
- Hot days now (above 93°F)
- 7 days/yr
- Hot days in 30 yrs
- 15 days/yr
Wind risk 1/10 · Minimal
- Chance of severe wind over 30 yrs
- 1.0%
Air-quality risk 2/10 · Minimal
- Unhealthy air days now
- 0 days/yr
- Unhealthy air days in 30 yrs
- 1 days/yr
Risk factors via First Street. Map © Google.
Why this score? — see what drove the C- grade
The composite is a weighted blend of 9 inputs, each scored 0–100. Each bar is that input's sub-score; the figure is the points it added to the 100-point composite (weight × sub-score).
- ARV discount +15.0/15.0
- Cash flow +13.7/30.0
- Schools +5.4/10.0
- 1% rule +4.7/10.0
- Livability +4.2/5.0
- DSCR +4.1/10.0
- Rent growth +3.8/5.0
- Condition / age +2.5/5.0
- Appreciation +0.0/10.0
$195,000
🖨 Deal sheet 📄 Offer letter ✓ Due diligence
Listing remarks MLS
Location, location, location!!! Great little Home ready to be rehabbed into a Special place to live! OR use as an investment property or maybe take down the house and Build a new one! This could also be a great first time Buyers home or single level empty Nester house for anyone not afraid of a project! Contractors and Investors will want to come and see the possibilities to turn this into a valuable piece of Real Estate. The house next-door to it is also available at 899 Cayuga Heights Rd which is listing #R1663472.
Key facts
- 0.56 acre lot
- Garage
- Built 1940
Neighborhood map
What this means for you Summary
Snapshot
- This is a 2-bed/1.0-bath single-family listed at $195k.
Deal economics
- At list price, monthly cash flow is $15 ($180/yr) — positive.
- The deal already cash-flows at list — no discount required.
- To meet the 1% rule (rent ≥ 1% of price), the offer needs to be $189k (3.1% below list).
- Recommended offer: $183k (6.0% below list) — sets the bar for market timing.
Location & tenants
- Location reads 83/100 on livability (#67 in NY, #1,006 nationally) — a professional / high-income tenant draw. Strengths: crime A+, commute A+, employment A+; Watch: amenities F, cost of living F.
- Ithaca City School District (urban): math 57% / reading 71% proficiency, ranked #195 of 590 in NY (top 33%) — acceptable for families but not a draw, mixed tenant base, ~2y average lease.
- Market conditions: Rents rising fast (+5.2%/yr); 327 active listings in the ZIP; 2 comparable units currently listed for rent nearby; 382 units permitted in Tompkins County in 2024 (208 in 5+ unit buildings).
- This rent runs 32% of the median local income ($71k/yr) — at the standard rent-burdened threshold; future hikes will face affordability resistance.
Forward outlook
- Local home prices are declining (-3.0%/yr); year-one equity from $1k of loan paydown is wiped out by about $6k of value loss. Plan a longer hold.
- Tompkins County population projected at +17% by 2050 — long-run rental-demand tailwind backs the buy-and-hold thesis.
Negotiation context
- It's been on market 86 days — a 6% lower offer ($183k) is reasonable based on typical stale-listing flexibility.
Risks & watch-outs
- Watch-outs: built in 1940 — expect roof / HVAC / electrical / plumbing capex.
- Climate carrying-cost: severe flood risk — expect insurance premiums to compound above CPI over the hold.
Questions for the listing agent
- It's been on market 86 days. Have you received any prior offers? Is the seller open to a 6% concession, seller financing, or rate buy-down credit?
- Built in 1940 — when were the roof, HVAC, electrical panel, plumbing, and water heater last replaced?
- Why hasn't it sold? Are there any deal-killer items the seller is aware of (foundation, flood, title, zoning, code violations)?
- Is there a deadline driving the sale (1031 exchange, divorce, estate, relocation)? That informs how much negotiation room exists.
- Schools are A-rated — typically a magnet for longer-tenancy family renters. What's the average tenant stay here, and is there a school-zone premium baked into asking?
- What's the average days-on-market for RENTAL listings here right now (not sales)? A rising rental-DOM trend means longer vacancies and softer asking-rent achievability than the comps imply.
- What's the recent tenant-quality profile in this submarket — average credit score on applications, eviction rate, late-payment / NSF rate, and stable-employment percentage? A property-management company in the area should have these aggregated.
- How much new for-sale + rental construction is in the pipeline within 1–3 miles? Heavy new supply typically softens prices + rents 12–24 months out; constrained supply supports both.
Investment metrics
- 1% rule
- 0.97% ✗
- Cap rate
- 6.39%
- Cash-on-cash
- 0.33%
- DSCR
- 1.01
- GRM
- 8.6
CMA / ARV
- ARV (median comp)
- $286,122
- List price
- $195,000
- Delta
- -31.85%
- Verdict
- UNDERPRICED
- Comps
- 18 within 2.0 mi
Projected returns pro-forma
-3.0% appreciation · 5.22% rent growth · sell at horizon
- IRR
- -13.0%
- Equity multiple
- 0.52×
- Total profit
- $-26,218
- Equity at exit
- $29,075
- IRR
- -0.6%
- Equity multiple
- 0.95×
- Total profit
- $-2,630
- Equity at exit
- $16,860
Cash invested: $54,600 (down + closing). Projections, not guarantees.
Landlord ↔ Tenant lean methodology
- Overall (STATE)
- 15 Strongly Tenant-Friendly
- State New York
- 15 Strongly Tenant-Friendly · D+10
- County
- — inherits STATE
- City
- — inherits STATE
ZIP-level market 14850
- Rents YoY
- 5.2%
- Active inventory
- 327
- Price-to-rent
- 8.6×
Monthly cashflow live
- Estimated rent
- $1,890 medium interval (Pro) →
- Mortgage (P&I)
- −$1,023
- Tax from tax record
- −$374 /mo · $4,487/yr
- Insurance
- −$81
- HOA
- −$0
- Vacancy / Maint / Mgmt
- −$397
- Net cashflow
- $15
Break-even live
UW: 25.0% down · 7.5% · 30yr · 1.5% tax · 5.0% vac · 8.0% maint · 8.0% mgmt
Financing live
Cash to close
- Down payment
- $48,750
- Closing costs
- $5,850
- Reserves months
- —
- Total cash needed
- —
Loan-product check · same deal, 3 products live
Conventional
25% down · 7.5% · 30yr
- Down + closing
- —
- Monthly P&I
- —
- Monthly cashflow
- —
- DSCR
- —
- Eligible?
- —
Personal DTI + credit; lowest rate.
DSCR
20% down · 8.5% · 30yr
- Down + closing
- —
- Monthly P&I
- —
- Monthly cashflow
- —
- DSCR
- —
- Eligible?
- —
No personal income docs; deal must DSCR.
Hard money
10% down · 12.0% · 12mo
- Down + closing
- —
- Monthly P&I
- —
- Monthly cashflow
- —
- DSCR
- —
- Eligible?
- —
Short-term bridge; refi at stabilization.
Rent comps 2 comps
| Address | Beds | Baths | Sqft | Rent | $/sqft | DOM | Units | Dist |
|---|---|---|---|---|---|---|---|---|
| 37 Uptown Rd Ithaca, NY | 1.0–2.0 | 1.0 | 925 | $1,622 | $1.75 | 43d | 6 | 1.41mi |
| 87 Uptown Rd Ithaca, NY | 1.0–2.0 | 1.0–2.0 | 775 | $2,000 | $2.58 | 21d | 31 | 1.45mi |
Listing history 18 events
-
2026-06-19days on market $195,000 Active 86 DOM
-
2026-06-18days on market $195,000 Active 85 DOM
-
2026-06-17days on market $195,000 Active 84 DOM
-
2026-06-16days on market $195,000 Active 83 DOM
-
2026-06-15days on market $195,000 Active 82 DOM
-
2026-06-14days on market $195,000 Active 80 DOM
-
2026-06-13days on market $195,000 Active 79 DOM
-
2026-06-10days on market $195,000 Active 77 DOM
-
2026-06-09days on market $195,000 Active 76 DOM
-
2026-06-08days on market $195,000 Active 75 DOM
-
2026-06-07days on market $195,000 Active 74 DOM
-
2026-06-05days on market $195,000 Active 71 DOM
-
2026-06-02days on market $195,000 Active 69 DOM
-
2026-06-01days on market $195,000 Active 68 DOM
-
2026-05-31days on market $195,000 Active 67 DOM
-
2026-05-30days on market $195,000 Active 66 DOM
-
2026-04-15price $195,000 522-char remark
Show marketing remark (522 chars)
Location, location, location!!! Great little Home ready to be rehabbed into a Special place to live! OR use as an investment property or maybe take down the house and Build a new one! This could also be a great first time Buyers home or single level empty Nester house for anyone not afraid of a project! Contractors and Investors will want to come and see the possibilities to turn this into a valuable piece of Real Estate. The house next-door to it is also available at 899 Cayuga Heights Rd which is listing #R1663472.
-
2026-03-25$225,000 Active 522-char remark
Show marketing remark (522 chars)
Location, location, location!!! Great little Home ready to be rehabbed into a Special place to live! OR use as an investment property or maybe take down the house and Build a new one! This could also be a great first time Buyers home or single level empty Nester house for anyone not afraid of a project! Contractors and Investors will want to come and see the possibilities to turn this into a valuable piece of Real Estate. The house next-door to it is also available at 899 Cayuga Heights Rd which is listing #R1663472.
ⓘ Source: listings_history table (triggers on properties + properties_extension) + one-shot
backfill from property_details.listing_events for pre-trigger history.
Tax reassessment forecast NY · Partial reset (capped growth)
- Current annual tax
- $4,487 · $374/mo
- Projected year-2 tax
- $4,487 · $374/mo
- Expected delta
- $0/yr ($0/mo · 0.0%)
ⓘ Screening estimate from a state-policy table — verify with the county assessor before closing.
Climate risk First Street
- Flood 10/10 Extreme 99% chance over 30 yrs
- Wildfire 1/10 Low
- Heat 2/10 Low 7 d/yr ≥93°F today · 15 d/yr by 30 yrs out
- Wind 1/10 Low 100% chance of damaging wind over 30 yrs
- Air quality 2/10 Low 0 unhealthy d/yr today · 1 by 30 yrs out
Nearby sold comps map
Loading sold comps map…
Walkable amenities ~0.75 mi
Loading nearby amenities…
Taxation est. · year 1
- Rental income
- $22,675
- − Mortgage interest
- −$10,923
- − Property taxes
- −$4,487
- − Insurance
- −$975
- − Repairs & maintenance
- −$1,814
- − Management
- −$1,814
- − Depreciation
- −$5,673
- Taxable loss
- −$3,010
- Est. tax savings @ 24.0%
- +$722
- After-tax cash flow
- $903/yr
For passive investors: Depreciation is non-cash, so a rental often shows a tax loss while cash-flowing — sheltering income. Rental losses are passive: they offset passive income freely, and up to $25,000/yr can offset ordinary (W-2) income if you actively participate and your MAGI is under $100k (phasing out to $0 by $150k); unused losses carry forward. On sale, claimed depreciation is recaptured at up to 25%, and gains may owe capital-gains tax (a 1031 exchange can defer both). Figures are a year-1 estimate at your 24.0% rate — not tax advice; consult a CPA.
Schools (NCES district)
- District
- Ithaca City School District
- NCES district ID
- 3615570
- Math proficiency
- 57% ▼ -5.00%
- Reading proficiency
- 71% ▲ 11.00%
- Median HH income
- $46,528
- Composite
- 54.01/100
- National rank
- #1397
- State rank
- #195 of 590 in NY
Livability — Lansing
- Score
- 83/100
- State rank
- #67
- US rank
- #1006
Category grades
Schools grade is shown separately in the Schools card above.
Census & demographics
- Census place
- Lansing, NY
- County
- Tompkins County · 68,610 people
- Metro
- Ithaca, NY
- Population (ZIP)
- 68,610
- Household income
- $71,445
- Rent vs Own
- Severe rent burden
- 5169.0
Population outlook (Tompkins County) Hauer SSP2
- Today (2025)
- 113,958 people
- By 2030
- 118,774 · +4.2%
- By 2040
- 125,927 · +10.5%
- By 2050
- 133,599 · +17.2%
- By 2075
- 156,759 · +37.6%
- By 2100
- 169,896 · +49.1%
Race, ethnicity, and origin ACS 2023
- Neighborhood character
- Predominantly White (68%)
- Race & ethnicity
- White 68% Asian 13% Hispanic / Latino 8% Two or more races 8% Black 4%
- Hispanic origin (detail)
- Mexican 2% Puerto Rican 2%
- Common ancestry
- Romanian 3% Italian 3% Scotch-Irish 2%
- Foreign-born
- 18% · China, Canada, South Korea
- Languages at home
- 79% English-only · Chinese 5% Spanish 4% Other Indo-European 4%
Political lean MEDSL · Tompkins
- 2024 margin
- Solid D (+50.6) · D 75.3% · R 24.7%
- 2008→2024 swing
- +8.6pp toward D · 2008: 42.1pp · 2024: 50.6pp
- All cycles
- 2024: D+50.6 2020: D+49.2 2016: D+42.1 2012: D+39.8 2008: D+42.1
Not yet ingested
- Civics
- —
Market trends
- HPI YoY
- ▼ -276.59%
- Current HPI
- 389.7215
- Rent YoY
- ▲ 5.22%
- Metro
- Ithaca, NY
- State GDP YoY
- ▲ 2.60%
- F500 in state
- 92
Industry mix (Fortune 500 HQ in NY)
| Industry | F500 HQs | Revenue |
|---|---|---|
| Financial Services | 10 | $950B |
|
||
| Consumer Goods | 9 | $162B |
|
||
| Insurance | 4 | $225B |
|
||
| Telecommunications | 2 | $144B |
|
||
| Pharmaceuticals | 2 | $112B |
|
||
| Media / Entertainment | 2 | $69B |
|
||
Price history
-13.3% since first listed2 events — show timeline
- 2026-04-15 Price Changed $195,000 IBRMLS
- 2026-03-25 Listed $225,000 IBRMLS
Property tax history
+1.6%/yrLatest (2025): $4,487 · +4.5% YoY. Source: county tax records.
Cash-flow waterfall
monthlySold comps — $/sqft
last 12 mo · ≤1 miLoading sold comps…