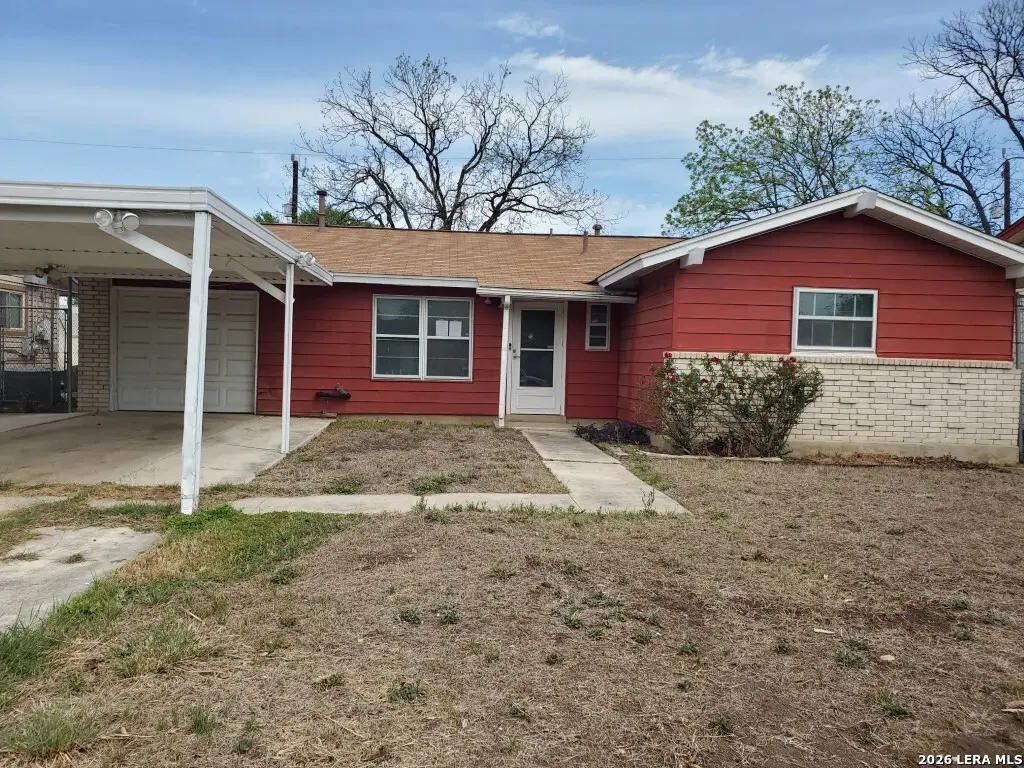
6719 Monterey St · San Antonio, TX
Flood risk 1/10 · Minimal
- FEMA flood zone
- X (unshaded)
- Chance of flooding over 30 yrs
- 0.0%
- Est. flood insurance / yr
- $507 – $1,088
Fire risk 1/10 · Minimal
- Est. fire insurance / yr
- $1,222 – $2,270
Heat risk 8/10 · Major
- Hot days now (above 108°F)
- 7 days/yr
- Hot days in 30 yrs
- 22 days/yr
Wind risk 6/10 · Moderate
- Chance of severe wind over 30 yrs
- 77.0%
Air-quality risk 2/10 · Minimal
- Unhealthy air days now
- 1 days/yr
- Unhealthy air days in 30 yrs
- 1 days/yr
Risk factors via First Street. Map © Google.
Why this score? — see what drove the C+ grade
The composite is a weighted blend of 9 inputs, each scored 0–100. Each bar is that input's sub-score; the figure is the points it added to the 100-point composite (weight × sub-score).
- Cash flow +26.0/30.0
- DSCR +8.8/10.0
- 1% rule +8.4/10.0
- ARV discount +7.5/15.0
- Livability +4.0/5.0
- Condition / age +2.5/5.0
- Rent growth +2.1/5.0
- Schools +1.3/10.0
- Appreciation +0.0/10.0
$110,400
🖨 Deal sheet (PDF) 📄 Offer letter ✓ Due diligence
Listing remarks
Exclusive Agency Listing. All agents may advertise this property with exceptions of MLS and yard signs. HUD homes are sold "as is". HUD Case #514-307706. Single story 3 bedroom 1.5 bath with large back covered patio located in Edgewood neighborhood. No representation is made to information provided including taxes, sqft, schools, features, etc. Buyer must verify all information.
Key facts
- 6,490 sq ft lot
- Garage
- Built 1970
Tags
Property features AI
Finance
- HOA & community: Subdivision: Edgewood; Community legal name: LOS JARDINES
Exterior
- Parking: 1-car garage
- Utilities: City water/sewer
- Home design: Pre-owned property; Approximate age: 56 years
- Construction: Slab foundation; Composition roof
- Exterior features: Brick and siding exterior
Interior
- Kitchen: Kitchen (8 x 5)
- Bedrooms: Master bedroom with half bath (12 x 12); Bedroom 2 (10 x 11); Bedroom 3 (10 x 11)
- Flooring: Ceramic tile; Vinyl
- Bathrooms: One full bathroom; One half bathroom; Master bath with single vanity (4 x 8)
- Heating & cooling: Central heating (electric); Central air conditioning
- Interior features: Washer and dryer connections; One living area
- Laundry & utility: Washer and dryer connections
Neighborhood map
What this means for you Summary
Snapshot
- This is a 3-bed/1.5-bath single-family listed at $110k.
Deal economics
- At list price, monthly cash flow is $276 ($3k/yr) — positive.
- The deal already cash-flows at list — no discount required.
- Meets the 1% rule at list price ($1k rent vs $110k).
- Recommended offer: $107k (3.0% below list) — sets the bar for market timing.
- Cap rate 9.3% vs local median 3.8% in San Antonio — top-decile yield for the area; either an underpriced asset or a hidden risk that comps aren't pricing in. Stress-test before assuming the spread holds.
Location & tenants
- Location reads 80/100 on livability (#31 in TX, #1,616 nationally) — a professional / high-income tenant draw. Strengths: amenities A+, commute A+, cost of living A+; Watch: crime F.
- Edgewood ISD (urban): math 12% / reading 21% proficiency, ranked #812 of 826 in TX (top 98%) — low school quality limits family demand, transient renter base, plan for 1-2y turnover.
- Zoned schools: L B Johnson El (math 14% / reading 20%, grade F, #3,836 of 4,322 statewide, top 91%, 348 students, 97% FRL); E T Wrenn Middle (math 11% / reading 22%, grade F, #1,536 of 1,662 statewide, top 93%, 496 students, 97% FRL); Memorial H S (math 22% / reading 29%, grade F, #1,246 of 1,632 statewide, top 77%, 872 students, 92% FRL) — zoned schools average 95% FRL vs 24% district-wide (71 pts higher); higher-poverty schools than district average — tighter screening recommended.
- Market conditions: Rents soft (-1.7%/yr); 30 active listings in the ZIP; 8,308 units permitted in Bexar County in 2024 (2,506 in 5+ unit buildings).
- This rent runs 35% of the median local income ($52k/yr) — at the standard rent-burdened threshold; future hikes will face affordability resistance.
Forward outlook
- Local home prices are declining (-3.0%/yr); year-one equity from $763 of loan paydown is wiped out by about $3k of value loss. Plan a longer hold.
- Bexar County population projected at +50% by 2050 — long-run rental-demand tailwind backs the buy-and-hold thesis.
Negotiation context
- It's been on market 53 days — a 3% lower offer ($107k) is reasonable based on typical stale-listing flexibility.
- 5 sale attempts since 5y ago; this cycle's ask has dropped $10k (8%) from the opening price — seller is motivated, your offer sets the floor, not the list.
Risks & watch-outs
- Watch-outs: property tax is 2.9% of price.
- Climate carrying-cost: major wind risk, 77% chance of damaging wind over 30y; extreme-heat days projected 7→22/yr by 2055 (HVAC capex compounding) — expect insurance premiums to compound above CPI over the hold.
Questions for the listing agent
- It's been on market 53 days. Have you received any prior offers? Is the seller open to a 3% concession, seller financing, or rate buy-down credit?
- Built in 1970 — when were the roof, HVAC, electrical panel, plumbing, and water heater last replaced?
- Property tax is high relative to price — has the assessment been appealed recently, and will the sale trigger a re-assessment?
- Is there a deadline driving the sale (1031 exchange, divorce, estate, relocation)? That informs how much negotiation room exists.
- Crime grade is F in this area — have there been break-ins, vandalism, or insurance claims at this property in the last 3 years? What carrier currently insures it and at what premium?
- What's the average days-on-market for RENTAL listings here right now (not sales)? A rising rental-DOM trend means longer vacancies and softer asking-rent achievability than the comps imply.
- What's the recent tenant-quality profile in this submarket — average credit score on applications, eviction rate, late-payment / NSF rate, and stable-employment percentage? A property-management company in the area should have these aggregated.
- How much new for-sale + rental construction is in the pipeline within 1–3 miles? Heavy new supply typically softens prices + rents 12–24 months out; constrained supply supports both.
Investment metrics
- 1% rule
- 1.34% ✓
- Cap rate
- 9.29%
- Cash-on-cash
- 10.71%
- DSCR
- 1.48
- GRM
- 6.2
CMA / ARV
No comps found within radius.
Projected returns pro-forma
-3.0% appreciation · 0.0% rent growth · sell at horizon
- IRR
- -4.1%
- Equity multiple
- 0.85×
- Total profit
- $-4,562
- Equity at exit
- $16,461
- IRR
- 1.2%
- Equity multiple
- 1.07×
- Total profit
- $2,279
- Equity at exit
- $9,545
Cash invested: $30,912 (down + closing). Projections, not guarantees.
Landlord ↔ Tenant lean methodology
- Overall (STATE)
- 87 Strongly Landlord-Friendly
- State Texas
- 87 Strongly Landlord-Friendly · R+5
- County
- — inherits STATE
- City
- — inherits STATE
ZIP-level market 78227
- Home prices YoY
- -5.5%
- Rents YoY
- -1.7%
- Active inventory
- 30
- Price-to-rent
- 6.2×
Monthly cashflow live
- Estimated rent
- $1,483 medium interval (Pro) →
- Mortgage (P&I)
- −$579
- Tax from tax record
- −$271 /mo · $3,249/yr
- Insurance
- −$46
- HOA
- −$0
- Vacancy / Maint / Mgmt
- −$311
- Net cashflow
- $276
Break-even live
Sensitivity live
| Price | -10% $338 | -5% $307 | +0% $276 | +5% $245 | +10% $213 |
|---|---|---|---|---|---|
| Rent | -10% $159 | -5% $217 | +0% $276 | +5% $334 | +10% $393 |
| Rate | -1.0pp $331 | -0.5pp $304 | base $276 | +0.5pp $247 | +1.0pp $218 |
UW: 25.0% down · 7.5% · 30yr · 1.5% tax · 5.0% vac · 8.0% maint · 8.0% mgmt
Financing live
Cash to close
- Down payment
- $27,600
- Closing costs
- $3,312
- Reserves months
- —
- Total cash needed
- —
Loan-product check · same deal, 3 products live
Conventional
25% down · 7.5% · 30yr
- Down + closing
- —
- Monthly P&I
- —
- Monthly cashflow
- —
- DSCR
- —
- Eligible?
- —
Personal DTI + credit; lowest rate.
DSCR
20% down · 8.5% · 30yr
- Down + closing
- —
- Monthly P&I
- —
- Monthly cashflow
- —
- DSCR
- —
- Eligible?
- —
No personal income docs; deal must DSCR.
Hard money
10% down · 12.0% · 12mo
- Down + closing
- —
- Monthly P&I
- —
- Monthly cashflow
- —
- DSCR
- —
- Eligible?
- —
Short-term bridge; refi at stabilization.
Listing history 10 events
-
2026-06-12statusdays on market $110,400 Pending 53 DOM
-
2026-06-09days on market $110,400 Price Change 50 DOM
-
2026-06-08days on market $110,400 Price Change 49 DOM
-
2026-06-08days on market $110,400 Price Change 48 DOM
-
2026-06-07days on market $110,400 Price Change 47 DOM
-
2026-06-03pricestatusdays on market $110,400 Price Change 44 DOM
-
2026-06-02days on market $120,000 Active 43 DOM
-
2026-06-01days on market $120,000 Active 42 DOM
-
2026-05-31remarks 381-char remark
-
2026-05-31$120,000 Active 41 DOM
ⓘ Source: listings_history table (triggers on properties + properties_extension) + one-shot
backfill from property_details.listing_events for pre-trigger history.
Tax reassessment forecast TX · Resets to sale price
- Current annual tax
- $3,249 · $271/mo
- Projected year-2 tax
- $3,249 · $271/mo
- Expected delta
- $0/yr ($0/mo · 0.0%)
ⓘ Screening estimate from a state-policy table — verify with the county assessor before closing.
Climate risk First Street
- Flood 1/10 Low FEMA zone X (unshaded) · 0% chance over 30 yrs
- Wildfire 1/10 Low
- Heat 8/10 Severe 7 d/yr ≥108°F today · 22 d/yr by 30 yrs out
- Wind 6/10 Major 77% chance of damaging wind over 30 yrs
- Air quality 2/10 Low 1 unhealthy d/yr today · 1 by 30 yrs out
Nearby sold comps map
Loading sold comps map…
Walkable amenities ~0.75 mi
Loading nearby amenities…
Taxation est. · year 1
- Rental income
- $17,795
- − Mortgage interest
- −$6,184
- − Property taxes
- −$3,249
- − Insurance
- −$552
- − Repairs & maintenance
- −$1,424
- − Management
- −$1,424
- − Depreciation
- −$3,212
- Taxable income
- $1,752
- Est. tax owed @ 24.0%
- −$420
- After-tax cash flow
- $2,890/yr
For passive investors: Depreciation is non-cash, so a rental often shows a tax loss while cash-flowing — sheltering income. Rental losses are passive: they offset passive income freely, and up to $25,000/yr can offset ordinary (W-2) income if you actively participate and your MAGI is under $100k (phasing out to $0 by $150k); unused losses carry forward. On sale, claimed depreciation is recaptured at up to 25%, and gains may owe capital-gains tax (a 1031 exchange can defer both). Figures are a year-1 estimate at your 24.0% rate — not tax advice; consult a CPA.
Schools (NCES district)
- District
- Edgewood ISD
- NCES district ID
- 4818150
- Math proficiency
- 12% ▼ -18.00%
- Reading proficiency
- 21% ▼ -5.00%
- Median HH income
- $27,419
- Composite
- 12.82/100
- National rank
- #9597
- State rank
- #812 of 826 in TX
Livability — San Antonio
- Score
- 80/100
- State rank
- #31
- US rank
- #1616
Category grades
Schools grade is shown separately in the Schools card above.
Census & demographics
- Census place
- San Antonio, TX
- County
- Bexar County · 1,990,555 people
- City population
- 1,806,925
- Metro
- San Antonio-New Braunfels, TX
- Population (ZIP)
- 44,035
- Household income
- $51,519
- Rent vs Own
- Severe rent burden
- 1773.0
Population outlook (Bexar County) Hauer SSP2
- Today (2025)
- 2,336,851 people
- By 2030
- 2,560,728 · +9.6%
- By 2040
- 3,020,569 · +29.3%
- By 2050
- 3,493,522 · +49.5%
- By 2075
- 4,668,459 · +99.8%
- By 2100
- 5,533,242 · +136.8%
Race, ethnicity, and origin ACS 2023
- Neighborhood character
- Predominantly Hispanic (83%)
- Race & ethnicity
- Hispanic / Latino 83% Two or more races 40% White 9% Black 5% Native American 2%
- Hispanic origin (detail)
- Mexican 72% Puerto Rican 1%
- Common ancestry
- Romanian 1%
- Foreign-born
- 15% · Canada
- Languages at home
- 52% English-only · Spanish 47% Other Asian/Pacific 1%
Political lean MEDSL · Bexar
- 2024 margin
- Lean D (+9.8) · D 54.3% · R 44.6% · Other 1.1%
- 2008→2024 swing
- +4.2pp toward D · 2008: 5.6pp · 2024: 9.8pp
- All cycles
- 2024: D+9.8 2020: D+18.2 2016: D+13.5 2012: D+4.6 2008: D+5.6
Not yet ingested
- Civics
- —
Market trends
- HPI YoY
- ▼ -15.94%
- Current HPI
- 275.9519
- Rent YoY
- ▼ -1.71%
- Metro
- San Antonio-New Braunfels, TX
- State GDP YoY
- ▲ 3.95%
- F500 in state
- 110
Industry mix (Fortune 500 HQ in TX)
| Industry | F500 HQs | Revenue |
|---|---|---|
| Energy | 16 | $1,198B |
|
||
| Technology | 5 | $198B |
|
||
| Engineering / Construction | 4 | $72B |
|
||
| Energy Services | 3 | $60B |
|
||
| Utilities | 3 | $41B |
|
||
| Healthcare | 2 | $330B |
|
||
Price history
-20.0% since first listed14 events — show timeline
- 2026-04-20 Listed $120,000 LERA
- 2023-12-31 Listing Removed — LERA
- 2023-08-25 Listed $179,500 LERA
- 2023-08-23 Listing Removed — LERA
- 2023-08-11 Relisted — LERA
- 2023-08-07 Contingent — LERA
- 2023-08-01 Price Changed $179,500 LERA
- 2023-07-12 Price Changed $167,500 LERA
- 2023-06-06 Listed $169,500 LERA
- 2021-12-21 Sold (Public Records) — Public Records
- 2021-12-20 Sold (MLS) — LERA
- 2021-10-21 Contingent — LERA
- 2021-10-12 Listed $150,000 LERA
- 2012-10-18 Sold (Public Records) — Public Records
Property tax history
+7.1%/yrLatest (2025): $3,249 · +2.6% YoY. Source: county tax records.
Cash-flow waterfall
monthlySold comps — $/sqft
last 12 mo · ≤1 miLoading sold comps…