228 Kingfield Dr · Columbia, SC
Flood risk No data
- FEMA flood zone
- —
- Chance of flooding over 30 yrs
- —
- Est. flood insurance / yr
- —
Fire risk No data
- Est. fire insurance / yr
- —
Heat risk No data
- Hot days now (above threshold)
- —
- Hot days in 30 yrs
- —
Wind risk No data
- Chance of severe wind over 30 yrs
- —
Air-quality risk No data
- Unhealthy air days now
- —
- Unhealthy air days in 30 yrs
- —
Risk factors via First Street. Map © Google.
Why this score? — see what drove the D- grade
The composite is a weighted blend of 9 inputs, each scored 0–100. Each bar is that input's sub-score; the figure is the points it added to the 100-point composite (weight × sub-score).
- Cash flow +12.2/30.0
- ARV discount +7.5/15.0
- Condition / age +4.0/5.0
- Livability +3.9/5.0
- DSCR +3.6/10.0
- 1% rule +3.5/10.0
- Schools +2.6/10.0
- Rent growth +2.5/5.0
- Appreciation +0.0/10.0
$274,675
🖨 Deal sheet (PDF) 📄 Offer letter ✓ Due diligence
Listing remarks
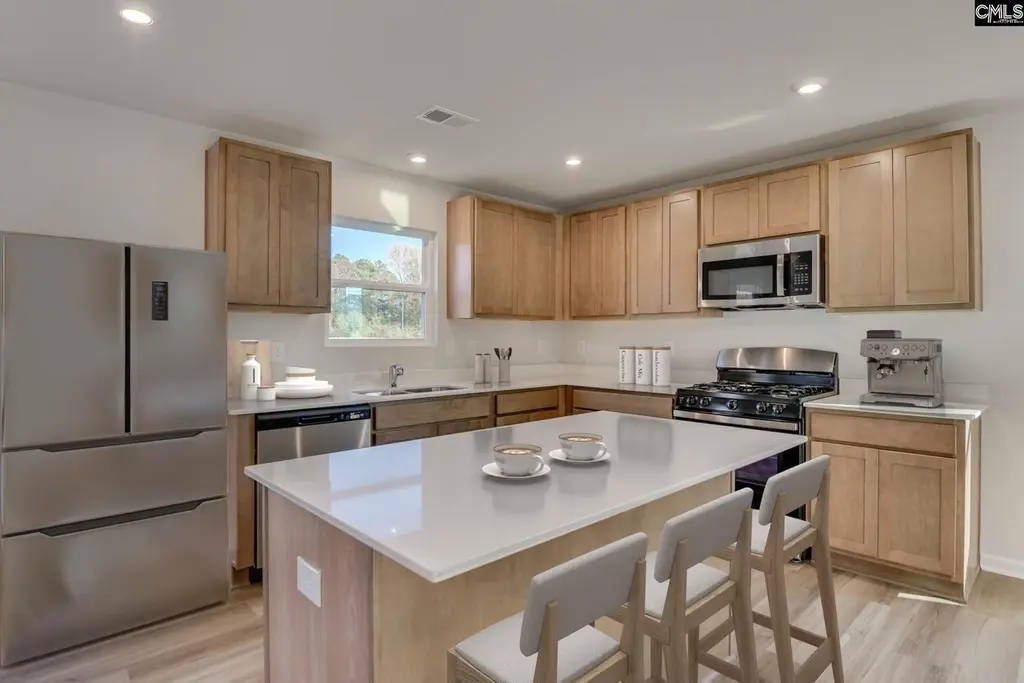
Find your new home in Chestnut Ridge North! We are delighted to introduce the Teagan, a stunning floor plan created for today's lifestyles, situated in a friendly neighborhood with exciting amenities on the horizon. The Teagan welcomes you with a perfect balance of functional spaces and open-concept living. The main level is designed for both productivity and relaxation, featuring a private study and a convenient half bathroom. Imagine preparing meals in a beautiful kitchen equipped with sleek stainless steel appliances and durable quartz countertops. This kitchen flows effortlessly into the spacious living and eat-in areas, creating a bright, airy hub perfect for entertaining guests or enj
Key facts
- Quartz countertops
- Walk-in closet
- Private study
Tags
Property features AI
Finance
- Other: New construction builder warranty
- HOA & community: Community association present; Association maintains common areas, pool, and sidewalks
Exterior
- Parking: Attached garage (2 spaces total)
- Utilities: Public water; Public sewer
- Home design: Two-story house; Slab foundation
- Construction: Stone and vinyl siding; Slab foundation
- Exterior features: Patio; Sprinkler system; Full gutters; Stone and vinyl exterior finish; Paved road access
Interior
- Kitchen: Eat-in kitchen with island; Pantry; Wood cabinets; Quartz countertops; Dishwasher; Garbage disposal; Microwave (above stove); Free-standing gas range
- Bedrooms: Master suite with double vanity, private bath and walk-in closet (second floor); Bedroom 2 with shared bath and private closet (second floor); Bedroom 3 with shared bath and walk-in closet (second floor); Bedroom 4 with shared bath and walk-in closet (second floor)
- Flooring: Carpet in bedrooms; Luxury vinyl plank in living areas and kitchen
- Bathrooms: Two full bathrooms; One partial bathroom; One half bathroom
- Heating & cooling: Central air conditioning; Gas heating on both first and second levels
- Interior features: Garage opener; Smoke detector; Attic access; Tankless hot water
- Laundry & utility: Laundry located on second floor; Electric hookup; Heated laundry space / utility room
Neighborhood map
What this means for you Summary
Snapshot
- This is a 4-bed/2.5-bath single-family listed at $275k. Condition is rated good.
Deal economics
- At list price, monthly cash flow is $-56 ($-676/yr) — negative.
- To cash-flow at today's rent, offer at most $267k (3.0% below list).
- To meet the 1% rule (rent ≥ 1% of price), the offer needs to be $233k (15.1% below list).
- Recommended offer: $233k (15.1% below list) — sets the bar for 1% rule.
Location & tenants
- Location reads 78/100 on livability (#18 in SC, #2,436 nationally) — a middle-class / working-renter tenant base. Strengths: amenities A+, commute A+, cost of living A+; Watch: employment D, crime F.
- Richland 01 (urban): math 26% / reading 36% proficiency, ranked #54 of 80 in SC (top 68%) — families likely to look elsewhere, expect single-tenant / working-renter base with shorter leases; 64% free/reduced lunch — lower-income household profile, screen leases tightly.
- Zoned schools: Horrell Hill Elementary (math 17% / reading 17%, grade F, #515 of 597 statewide, top 89%, 562 students, 100% FRL); Southeast Middle (math 7% / reading 19%, grade F, #210 of 229 statewide, top 93%, 493 students, 100% FRL); Lower Richland High (math 5% / reading 64%, grade F, #185 of 196 statewide, top 94%, 1,244 students, 100% FRL) — zoned schools average 100% FRL vs 64% district-wide (36 pts higher); higher-poverty schools than district average — tighter screening recommended.
- Market conditions: 335 active listings in the ZIP; 3,472 units permitted in Richland County in 2024 (1,096 in 5+ unit buildings).
- At $2,331/mo this rent would consume 46% of the median local household income ($60k/yr) (locally 236% of renters already pay >50% of income on rent) — very limited rent-growth headroom before tenants either downsize or default.
Forward outlook
- Local home prices are declining (-3.0%/yr); year-one equity from $2k of loan paydown is wiped out by about $8k of value loss. Plan a longer hold.
- Richland County population projected at +30% by 2050 — long-run rental-demand tailwind backs the buy-and-hold thesis.
Negotiation context
- It's been on market 35 days — a 3% lower offer ($266k) is reasonable based on typical stale-listing flexibility.
Questions for the listing agent
- What do current leases actually rent for vs. the listed asking? Can we see a recent rent roll and the last 12 months of T-12 income?
- It's been on market 35 days. Have you received any prior offers? Is the seller open to a 15% concession, seller financing, or rate buy-down credit?
- Is there a deadline driving the sale (1031 exchange, divorce, estate, relocation)? That informs how much negotiation room exists.
- Schools are D-rated, which usually means shorter tenancies and higher turnover. Who's the typical renter profile here, and what's been the actual vacancy rate?
- Crime grade is F in this area — have there been break-ins, vandalism, or insurance claims at this property in the last 3 years? What carrier currently insures it and at what premium?
- The area grade is low — what's the realistic commute time and amenity access for the typical tenant pool here? Any planned neighborhood developments (good or bad) we should know about?
- What's the average days-on-market for RENTAL listings here right now (not sales)? A rising rental-DOM trend means longer vacancies and softer asking-rent achievability than the comps imply.
- What's the recent tenant-quality profile in this submarket — average credit score on applications, eviction rate, late-payment / NSF rate, and stable-employment percentage? A property-management company in the area should have these aggregated.
- How much new for-sale + rental construction is in the pipeline within 1–3 miles? Heavy new supply typically softens prices + rents 12–24 months out; constrained supply supports both.
Investment metrics
- 1% rule
- 0.85% ✗
- Cap rate
- 6.05%
- Cash-on-cash
- -0.88%
- DSCR
- 0.96
- GRM
- 9.8
CMA / ARV
No comps found within radius.
Projected returns pro-forma
-3.0% appreciation · 3.0% rent growth · sell at horizon
- IRR
- -17.7%
- Equity multiple
- 0.38×
- Total profit
- $-48,064
- Equity at exit
- $40,955
- IRR
- -9.8%
- Equity multiple
- 0.40×
- Total profit
- $-46,333
- Equity at exit
- $23,749
Cash invested: $76,909 (down + closing). Projections, not guarantees.
Landlord ↔ Tenant lean methodology
- Overall (STATE)
- 90 Strongly Landlord-Friendly
- State South Carolina
- 90 Strongly Landlord-Friendly · R+6
- County
- — inherits STATE
- City
- — inherits STATE
ZIP-level market 29061
- Home prices YoY
- -22.8%
- Active inventory
- 335
- Price-to-rent
- 9.8×
Monthly cashflow live
- Estimated rent
- $2,331 medium interval (Pro) →
- Mortgage (P&I)
- −$1,440
- Tax est. 1.5%
- −$343 /mo · $4,120/yr
- Insurance
- −$114
- HOA
- −$0
- Vacancy / Maint / Mgmt
- −$490
- Net cashflow
- $-56
Break-even live
Sensitivity live
| Price | -10% $133 | -5% $39 | +0% $-56 | +5% $-151 | +10% $-246 |
|---|---|---|---|---|---|
| Rent | -10% $-241 | -5% $-148 | +0% $-56 | +5% $36 | +10% $128 |
| Rate | -1.0pp $82 | -0.5pp $13 | base $-56 | +0.5pp $-128 | +1.0pp $-200 |
UW: 25.0% down · 7.5% · 30yr · 1.5% tax · 5.0% vac · 8.0% maint · 8.0% mgmt
Financing live
Cash to close
- Down payment
- $68,669
- Closing costs
- $8,240
- Reserves months
- —
- Total cash needed
- —
Loan-product check · same deal, 3 products live
Conventional
25% down · 7.5% · 30yr
- Down + closing
- —
- Monthly P&I
- —
- Monthly cashflow
- —
- DSCR
- —
- Eligible?
- —
Personal DTI + credit; lowest rate.
DSCR
20% down · 8.5% · 30yr
- Down + closing
- —
- Monthly P&I
- —
- Monthly cashflow
- —
- DSCR
- —
- Eligible?
- —
No personal income docs; deal must DSCR.
Hard money
10% down · 12.0% · 12mo
- Down + closing
- —
- Monthly P&I
- —
- Monthly cashflow
- —
- DSCR
- —
- Eligible?
- —
Short-term bridge; refi at stabilization.
Listing history 15 events
-
2026-06-21days on market $274,675 Active 35 DOM
-
2026-06-18days on market $274,675 Active 32 DOM
-
2026-06-17days on market $274,675 Active 31 DOM
-
2026-06-16days on market $274,675 Active 30 DOM
-
2026-06-15days on market $274,675 Active 29 DOM
-
2026-06-14days on market $274,675 Active 27 DOM
-
2026-06-10days on market $274,675 Active 24 DOM
-
2026-06-09days on market $274,675 Active 23 DOM
-
2026-06-08days on market $274,675 Active 22 DOM
-
2026-06-07days on market $274,675 Active 21 DOM
-
2026-06-03days on market $274,675 Active 17 DOM
-
2026-06-03days on market $274,675 Active 16 DOM
-
2026-06-01days on market $274,675 Active 15 DOM
-
2026-05-31days on market $274,675 Active 14 DOM
-
2026-05-17$274,675 Active
ⓘ Source: listings_history table (triggers on properties + properties_extension) + one-shot
backfill from property_details.listing_events for pre-trigger history.
Nearby sold comps map
Loading sold comps map…
Walkable amenities ~0.75 mi
Loading nearby amenities…
Taxation est. · year 1
- Rental income
- $27,978
- − Mortgage interest
- −$15,386
- − Property taxes
- −$4,120
- − Insurance
- −$1,373
- − Repairs & maintenance
- −$2,238
- − Management
- −$2,238
- − Depreciation
- −$7,991
- Taxable loss
- −$5,369
- Est. tax savings @ 24.0%
- +$1,289
- After-tax cash flow
- $612/yr
For passive investors: Depreciation is non-cash, so a rental often shows a tax loss while cash-flowing — sheltering income. Rental losses are passive: they offset passive income freely, and up to $25,000/yr can offset ordinary (W-2) income if you actively participate and your MAGI is under $100k (phasing out to $0 by $150k); unused losses carry forward. On sale, claimed depreciation is recaptured at up to 25%, and gains may owe capital-gains tax (a 1031 exchange can defer both). Figures are a year-1 estimate at your 24.0% rate — not tax advice; consult a CPA.
Condition & rehab AI · 12 photos
This home is in excellent condition with a good condition score of 80. It is move-in ready with no visible repairs or maintenance needed. The highest-ROI updates would be painting the exterior, landscaping the front yard, upgrading the flooring in the entryway, and adding a smart home system.
Value-add opportunities
- Both Painting the exterior — Enhances curb appeal and value
- Both Landscaping the front yard — Improves curb appeal and rental value
- Both Upgrading the flooring in the entryway — Enhances first impression and value
- Both Adding a smart home system — Improves convenience and value
Renovation cost estimate screening
Value-add ROI direction
- Both Painting the exterior — Enhances curb appeal and value ↑
- Both Landscaping the front yard — Improves curb appeal and rental value ↑
- Both Upgrading the flooring in the entryway — Enhances first impression and value ↑
- Both Adding a smart home system — Improves convenience and value ↑
ⓘ Cost ranges are severity-bucket heuristics (US national rule-of-thumb). Get contractor quotes + a written scope before underwriting a rehab budget.
Schools (NCES district)
- District
- Richland 01
- NCES district ID
- 4503360
- Math proficiency
- 26% ▼ -7.00%
- Reading proficiency
- 36% ▼ -5.00%
- Median HH income
- $38,931
- Composite
- 25.94/100
- National rank
- #7335
- State rank
- #54 of 80 in SC
Livability — Columbia
- Score
- 78/100
- State rank
- #18
- US rank
- #2436
Category grades
Schools grade is shown separately in the Schools card above.
Census & demographics
- County
- Richland County · 389,530 people
- City population
- 335,994
- Metro
- Columbia, SC
- Population (ZIP)
- 12,538
- Household income
- $60,307
- Rent vs Own
- Severe rent burden
- 236.0
Population outlook (Richland County) Hauer SSP2
- Today (2025)
- 459,667 people
- By 2030
- 487,524 · +6.1%
- By 2040
- 542,035 · +17.9%
- By 2050
- 595,371 · +29.5%
- By 2075
- 732,998 · +59.5%
- By 2100
- 820,415 · +78.5%
Race, ethnicity, and origin ACS 2023
- Neighborhood character
- Predominantly Black (68%)
- Race & ethnicity
- Black 68% White 23% Two or more races 6% Hispanic / Latino 4%
- Common ancestry
- Italian 1% Lithuanian 1% Romanian 1%
- Foreign-born
- 3% · Canada
- Languages at home
- 96% English-only · Spanish 3%
Political lean MEDSL · Richland
- 2024 margin
- Solid D (+34.6) · D 66.4% · R 31.8% · Other 1.8%
- 2008→2024 swing
- +5.7pp toward D · 2008: 28.9pp · 2024: 34.6pp
- All cycles
- 2024: D+34.6 2020: D+38.3 2016: D+32.9 2012: D+33.3 2008: D+28.9
Not yet ingested
- Civics
- —
Market trends
- HPI YoY
- ▼ -57.44%
- Current HPI
- 194.8986
- Rent YoY
- —
- Metro
- Columbia, SC
- State GDP YoY
- ▲ 4.51%
- F500 in state
- 2
Industry mix (Fortune 500 HQ in SC)
| Industry | F500 HQs | Revenue |
|---|---|---|
| Packaging | 1 | $7B |
|
||
Price history
1 event — show timeline
- 2026-05-17 Listed $274,675 Consolidated MLS
Cash-flow waterfall
monthlySold comps — $/sqft
last 12 mo · ≤1 miLoading sold comps…