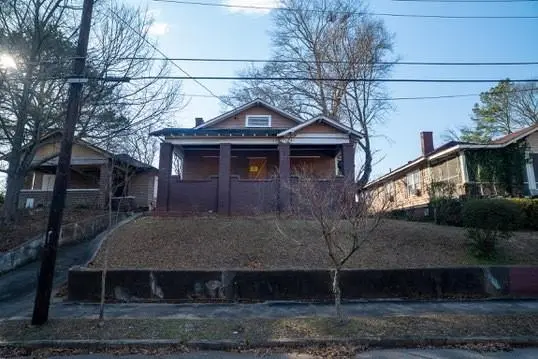
644 Lexington Ave SW · Atlanta, GA
Flood risk 1/10 · Minimal
- FEMA flood zone
- X (unshaded)
- Chance of flooding over 30 yrs
- 0.0%
- Est. flood insurance / yr
- $473 – $860
Fire risk 1/10 · Minimal
- Est. fire insurance / yr
- $963 – $1,789
Heat risk 6/10 · Moderate
- Hot days now (above 104°F)
- 7 days/yr
- Hot days in 30 yrs
- 18 days/yr
Wind risk 6/10 · Moderate
- Chance of severe wind over 30 yrs
- 27.0%
Air-quality risk 4/10 · Minor
- Unhealthy air days now
- 4 days/yr
- Unhealthy air days in 30 yrs
- 6 days/yr
Risk factors via First Street. Map © Google.
Why this score? — see what drove the D+ grade
The composite is a weighted blend of 9 inputs, each scored 0–100. Each bar is that input's sub-score; the figure is the points it added to the 100-point composite (weight × sub-score).
- Cash flow +18.4/30.0
- ARV discount +7.5/15.0
- DSCR +5.8/10.0
- 1% rule +5.7/10.0
- Livability +4.2/5.0
- Rent growth +3.2/5.0
- Schools +2.7/10.0
- Condition / age +2.5/5.0
- Appreciation +0.0/10.0
$205,000
🖨 Deal sheet 📄 Offer letter ✓ Due diligence
Listing remarks MLS
Incredible opportunity just steps from the Westside BeltLine! This property is zoned to allow for an ADU, with space in the rear offering additional value add potential. A full renovation is needed, making this ideal for an experienced investor or buyer ready to bring their vision to life. Perfect for a fix-and-flip or long-term buy-and-hold strategy. The surrounding area continues to show strong resale and rental demand, with renovated homes selling quickly and well-positioned rentals performing strongly. The entry price provides room for improvements and long-term appreciation in an established, rapidly evolving neighborhood.
Key facts
- Zoned for adu
- Strong rental demand
- Strong resale demand
Tags
Neighborhood map
What this means for you Summary
Snapshot
- This is a 2-bed/1.0-bath single-family listed at $205k.
Deal economics
- At list price, monthly cash flow is $192 ($2k/yr) — positive.
- The deal already cash-flows at list — no discount required.
- Meets the 1% rule at list price ($2k rent vs $205k).
- Recommended offer: $180k (12.0% below list) — sets the bar for market timing.
- Cap rate 7.4% vs local median 3.1% in Atlanta — top-decile yield for the area; either an underpriced asset or a hidden risk that comps aren't pricing in. Stress-test before assuming the spread holds.
Location & tenants
- Location reads 83/100 on livability (#6 in GA, #919 nationally) — a professional / high-income tenant draw. Strengths: amenities A+, commute A+, housing A+; Watch: schools C-, cost of living C-.
- Atlanta Public Schools (urban): math 28% / reading 35% proficiency, ranked #80 of 174 in GA (top 46%) — families likely to look elsewhere, expect single-tenant / working-renter base with shorter leases; 71% free/reduced lunch — lower-income household profile, screen leases tightly.
- Market conditions: Rents rising (+2.8%/yr); 452 active listings in the ZIP; 40 comparable units currently listed for rent nearby; rentals at typical pace (median 24d on market — plan ~3-4 weeks tenant-placement turnaround); 11,565 units permitted in Fulton County in 2024 (8,159 in 5+ unit buildings).
- At $2,190/mo this rent would consume 50% of the median local household income ($53k/yr) (locally 1676% of renters already pay >50% of income on rent) — very limited rent-growth headroom before tenants either downsize or default.
Forward outlook
- Local home prices are declining (-3.0%/yr); year-one equity from $1k of loan paydown is wiped out by about $6k of value loss. Plan a longer hold.
- Fulton County population projected at +38% by 2050 — long-run rental-demand tailwind backs the buy-and-hold thesis.
Negotiation context
- It's been on market 126 days — a 12% lower offer ($180k) is reasonable based on typical stale-listing flexibility.
- 2 sale attempts with the ask held roughly flat each time — persistent listings suggest the price (not the market) is what's stuck; bring a comps-based counter.
Risks & watch-outs
- Watch-outs: built in 1920 — expect roof / HVAC / electrical / plumbing capex.
- Climate carrying-cost: major wind risk, 27% chance of damaging wind over 30y; extreme-heat days projected 7→18/yr by 2055 (HVAC capex compounding) — expect insurance premiums to compound above CPI over the hold.
Questions for the listing agent
- It's been on market 126 days. Have you received any prior offers? Is the seller open to a 12% concession, seller financing, or rate buy-down credit?
- Built in 1920 — when were the roof, HVAC, electrical panel, plumbing, and water heater last replaced?
- Why hasn't it sold? Are there any deal-killer items the seller is aware of (foundation, flood, title, zoning, code violations)?
- Is there a deadline driving the sale (1031 exchange, divorce, estate, relocation)? That informs how much negotiation room exists.
- The area grade is low — what's the realistic commute time and amenity access for the typical tenant pool here? Any planned neighborhood developments (good or bad) we should know about?
- What's the average days-on-market for RENTAL listings here right now (not sales)? A rising rental-DOM trend means longer vacancies and softer asking-rent achievability than the comps imply.
- What's the recent tenant-quality profile in this submarket — average credit score on applications, eviction rate, late-payment / NSF rate, and stable-employment percentage? A property-management company in the area should have these aggregated.
- How much new for-sale + rental construction is in the pipeline within 1–3 miles? Heavy new supply typically softens prices + rents 12–24 months out; constrained supply supports both.
Investment metrics
- 1% rule
- 1.07% ✓
- Cap rate
- 7.42%
- Cash-on-cash
- 4.01%
- DSCR
- 1.18
- GRM
- 7.8
CMA / ARV
- ARV (median comp)
- $420,623
- List price
- $205,000
- Delta
- -51.26%
- Verdict
- UNDERPRICED
- Comps
- 20 within 1.0 mi
Show comp detail 12 sales within ~0.75 mi
| Address | Dist | Beds/Ba | Sqft | Sold | Price | $/sf | Match |
|---|---|---|---|---|---|---|---|
| 520 Mary St SW | 0.46mi | 3/2.0 (+1) | 1,666 (-3%) | 1mo | $365,000 | $219 | 64 |
| 776 Brookline St SW | 0.36mi | 3/2.0 (+1) | 1,600 (-6%) | 4mo | $352,000 | $220 | 60 |
| 1464 Graham St SW | 0.71mi | 2/2.0 | 1,689 (-1%) | 3mo | $399,000 | $236 | 59 |
| 1444 Athens Ave | 0.54mi | 3/1.0 (+1) | 1,850 (+8%) | 2mo | $235,000 | $127 | 54 |
| 515 Cohen St | 0.60mi | 3/2.5 (+1) | 1,635 (-4%) | 5mo | $325,000 | $199 | 50 |
| 1526 Beatie Ave SW | 0.68mi | 3/3.0 (+1) | 1,750 (+2%) | 5mo | $417,500 | $239 | 48 |
| 925 Tift Ave | 0.46mi | 3/2.0 (+1) | 1,938 (+13%) | 6mo | $235,000 | $121 | 43 |
| 865 Rose Cir SW | 0.70mi | 3/2.0 (+1) | 1,546 (-10%) | 2mo | $415,000 | $268 | 41 |
| 845 Metropolitan Pkwy SW | 0.60mi | 3/2.0 (+1) | 1,500 (-12%) | 4mo | $220,000 | $147 | 40 |
| 1375 Hartford Ave SW | 0.65mi | 3/2.0 (+1) | 1,507 (-12%) | 3mo | $460,000 | $305 | 38 |
| 988 Mcdaniel St SW | 0.52mi | 3/2.5 (+1) | 1,484 (-13%) | 6mo | $392,800 | $265 | 38 |
| 964 Dill Ave SW | 0.73mi | 3/1.0 (+1) | 1,478 (-14%) | 2mo | $165,000 | $112 | 36 |
Match score weights: distance 35% · size 25% · config 20% · recency 20%. Top-matched comps best support the ARV.
Projected returns pro-forma
-3.0% appreciation · 2.77% rent growth · sell at horizon
- IRR
- -10.2%
- Equity multiple
- 0.63×
- Total profit
- $-21,404
- Equity at exit
- $30,566
- IRR
- -1.2%
- Equity multiple
- 0.92×
- Total profit
- $-4,539
- Equity at exit
- $17,725
Cash invested: $57,400 (down + closing). Projections, not guarantees.
Landlord ↔ Tenant lean methodology
- Overall (STATE)
- 90 Strongly Landlord-Friendly
- State Georgia
- 90 Strongly Landlord-Friendly · R+3
- County
- — inherits STATE
- City
- — inherits STATE
ZIP-level market 30310
- Home prices YoY
- -32.8%
- Rents YoY
- 2.8%
- Active inventory
- 452
- Price-to-rent
- 7.8×
Monthly cashflow live
- Estimated rent
- $2,190 high interval (Pro) →
- Mortgage (P&I)
- −$1,075
- Tax from tax record
- −$378 /mo · $4,533/yr
- Insurance
- −$85
- HOA
- −$0
- Vacancy / Maint / Mgmt
- −$460
- Net cashflow
- $192
Break-even live
UW: 25.0% down · 7.5% · 30yr · 1.5% tax · 5.0% vac · 8.0% maint · 8.0% mgmt
Financing live
Cash to close
- Down payment
- $51,250
- Closing costs
- $6,150
- Reserves months
- —
- Total cash needed
- —
Loan-product check · same deal, 3 products live
Conventional
25% down · 7.5% · 30yr
- Down + closing
- —
- Monthly P&I
- —
- Monthly cashflow
- —
- DSCR
- —
- Eligible?
- —
Personal DTI + credit; lowest rate.
DSCR
20% down · 8.5% · 30yr
- Down + closing
- —
- Monthly P&I
- —
- Monthly cashflow
- —
- DSCR
- —
- Eligible?
- —
No personal income docs; deal must DSCR.
Hard money
10% down · 12.0% · 12mo
- Down + closing
- —
- Monthly P&I
- —
- Monthly cashflow
- —
- DSCR
- —
- Eligible?
- —
Short-term bridge; refi at stabilization.
Rent comps 40 comps
| Address | Beds | Baths | Sqft | Rent | $/sqft | DOM | Units | Dist |
|---|---|---|---|---|---|---|---|---|
| 600 Mayland Ave SW Atlanta, GA | 3.0 | 2.0 | 1100 | $2,300 | $2.09 | 24d | 1 | 0.15mi |
| 1133 Mayland Cir SW Atlanta, GA | 3.0 | 2.0 | 1120 | $3,600 | $3.21 | 24d | 1 | 0.18mi |
| 1246 Allene Ave SW Atlanta, GA | 2.0 | 1.0–2.0 | 896 | $2,110 | $2.35 | 1d | 23 | 0.19mi |
| 610 Fletcher St SW Atlanta, GA | 3.0 | 2.5 | 1550 | $2,100 | $1.35 | 24d | 1 | 0.20mi |
| 706 Catherine St SW Atlanta, GA | 3.0 | 2.0 | 1352 | $2,200 | $1.63 | 7d | 1 | 0.21mi |
| 504 Dunbar St SW Atlanta, GA | 3.0 | 2.5 | 1728 | $1,625 | $0.94 | 24d | 1 | 0.28mi |
| 1104 Welch St SW Atlanta, GA | 1.0 | 1.0 | 1600 | $795 | $0.50 | 24d | 1 | 0.28mi |
| 1104 Welch St SW Atlanta, GA | 1.0 | 1.0 | 1600 | $1,350 | $0.84 | 20d | 1 | 0.28mi |
| 1135 Coleman St SW Atlanta, GA | 3.0 | 2.5 | 1353 | $1,795 | $1.33 | 24d | 1 | 0.29mi |
| 547 Erin Ave SW Atlanta, GA | 3.0 | 2.0 | 1394 | $2,600 | $1.87 | 24d | 1 | 0.29mi |
| 547 Erin Ave SW Atlanta, GA | 3.0 | 2.0 | 1400 | $5,000 | $3.57 | 2d | 1 | 0.29mi |
| 518 Erin Ave SW Atlanta, GA | 2.0 | 1.0 | 1075 | $2,500 | $2.33 | 18d | 1 | 0.35mi |
| 821 Erin Ave SW Atlanta, GA | 3.0 | 2.0 | 1535 | $2,195 | $1.43 | 24d | 1 | 0.42mi |
| 1153 Smith St SW Atlanta, GA | 3.0 | 2.5 | 1728 | $2,023 | $1.17 | 12d | 1 | 0.46mi |
| 1151 Smith St SW Atlanta, GA | 3.0 | 2.5 | 1728 | $1,100 | $0.64 | 24d | 1 | 0.46mi |
| 1264 Hartford Ave SW Atlanta, GA | 3.0 | 2.0 | 1290 | $1,989 | $1.54 | 24d | 1 | 0.48mi |
| 827 Elbert St SW Atlanta, GA | 3.0 | 2.0 | 1300 | $2,900 | $2.23 | 24d | 1 | 0.50mi |
| 1412 Allene Ave SW Atlanta, GA | 3.0 | 2.0 | 1705 | $2,500 | $1.47 | 24d | 1 | 0.50mi |
| 1430 Desoto Ave SW Atlanta, GA | 3.0 | 2.0 | 1224 | $2,200 | $1.80 | 24d | 1 | 0.52mi |
| 1443 Metropolitan Pkwy SW Atlanta, GA | 3.0 | 2.0 | 1518 | $2,200 | $1.45 | 24d | 1 | 0.53mi |
| 496 Shannon Dr SW Atlanta, GA | 3.0 | 2.0 | 1658 | $2,900 | $1.75 | 2d | 1 | 0.53mi |
| 496 Shannon Dr SW Atlanta, GA | 3.0 | 2.0 | 1658 | $3,250 | $1.96 | 3d | 1 | 0.53mi |
| 1040 Smith St SW Atlanta, GA | 3.0 | 2.5 | 1500 | $1,595 | $1.06 | 24d | 1 | 0.53mi |
| 1449 Athens Ave SW Atlanta, GA | 1.0 | 1.0 | 2000 | $595 | $0.30 | 24d | 1 | 0.53mi |
| 1449 Beatie Ave SW Atlanta, GA | 3.0 | 2.0 | 1628 | $2,481 | $1.52 | 22d | 1 | 0.55mi |
| 906 Allene Ave SW Atlanta, GA | 3.0 | 2.0 | 1500 | $3,500 | $2.33 | 22d | 1 | 0.57mi |
| 875 Beryl St SW Atlanta, GA | 3.0 | 2.5 | 2060 | $2,850 | $1.38 | 14d | 1 | 0.57mi |
| 490 Lynnhaven Dr SW Atlanta, GA | 3.0 | 2.0 | 1289 | $2,395 | $1.86 | 4d | 1 | 0.59mi |
| 444 Shannon Dr SW Atlanta, GA | 3.0 | 2.0 | 1600 | $2,450 | $1.53 | 24d | 1 | 0.59mi |
| 1048 Garibaldi St SW Atlanta, GA | 2.0 | 2.0 | 1280 | $2,150 | $1.68 | 24d | 1 | 0.61mi |
| 1534 Beatie Ave SW Atlanta, GA | 3.0 | 2.0 | 1050 | $2,050 | $1.95 | 24d | 1 | 0.67mi |
| 1141 Moton Ave SW Atlanta, GA | 3.0 | 3.0 | 1584 | $2,800 | $1.77 | 24d | 1 | 0.69mi |
| 802 Lowndes Ave SW Atlanta, GA | 3.0 | 2.0 | 1872 | $2,550 | $1.36 | 22d | 1 | 0.71mi |
| 776 Metropolitan Pkwy SW Atlanta, GA | 2.0–3.0 | 2.0–3.0 | 1212 | $2,165 | $1.79 | 1d | 6 | 0.76mi |
| 903 Beecher St SW Atlanta, GA | 3.0 | 2.0 | 1500 | $7,500 | $5.00 | 24d | 1 | 0.87mi |
| 903 Beecher St SW Unit 905 Beecher Atlanta, GA | 3.0 | 2.0 | 1500 | $4,000 | $2.67 | 22d | 1 | 0.87mi |
| 2159 M L King Jr DR SW Atlanta, GA | 1.0 | 1.0 | 1050 | $800 | $0.76 | 3d | 1 | 0.90mi |
| 1645 Metropolitan Pkwy SW Unit A Atlanta, GA | 3.0 | 1.0 | 1433 | $1,795 | $1.25 | 24d | 1 | 0.91mi |
| 1077 Peeples St SW Atlanta, GA | 1.0 | 1.0 | 1718 | $1,000 | $0.58 | 24d | 1 | 0.92mi |
| 746 Joseph E Lowery Blvd SW Atlanta, GA | 3.0 | 2.5 | 1940 | $2,550 | $1.31 | 24d | 1 | 0.94mi |
Listing history 17 events
-
2026-06-18days on market $205,000 Active 126 DOM
-
2026-06-17days on market $205,000 Active 125 DOM
-
2026-06-16days on market $205,000 Active 124 DOM
-
2026-06-15days on market $205,000 Active 123 DOM
-
2026-06-13days on market $205,000 Active 121 DOM
-
2026-06-13days on market $205,000 Active 120 DOM
-
2026-06-09days on market $205,000 Active 117 DOM
-
2026-06-08days on market $205,000 Active 116 DOM
-
2026-06-07days on market $205,000 Active 115 DOM
-
2026-06-04days on market $205,000 Active 112 DOM
-
2026-06-03days on market $205,000 Active 111 DOM
-
2026-06-02days on market $205,000 Active 110 DOM
-
2026-06-01days on market $205,000 Active 109 DOM
-
2026-05-31days on market $205,000 Active 108 DOM
-
2026-02-06$205,000 New 636-char remark
Show marketing remark (716 chars)
Incredible opportunity just steps from the Westside BeltLine! This property is zoned to allow for an ADU, with space in the rear offering additional value add potential. A full renovation is needed, making this ideal for an experienced investor or buyer ready to bring their vision to life. Perfect for a fix-and-flip or long-term buy-and-hold strategy. The surrounding area continues to show strong resale and rental demand, with renovated homes selling quickly and well-positioned rentals performing strongly. The entry price provides room for improvements and long-term appreciation in an established, rapidly evolving neighborhood. NO BLIND OFFERS. NO WHOLESALERS. NO CREATIVE FINANCING. CASH OR HARD MONEY ONLY.
-
2026-02-06$205,000 Active 716-char remark
Show marketing remark (716 chars)
Incredible opportunity just steps from the Westside BeltLine! This property is zoned to allow for an ADU, with space in the rear offering additional value add potential. A full renovation is needed, making this ideal for an experienced investor or buyer ready to bring their vision to life. Perfect for a fix-and-flip or long-term buy-and-hold strategy. The surrounding area continues to show strong resale and rental demand, with renovated homes selling quickly and well-positioned rentals performing strongly. The entry price provides room for improvements and long-term appreciation in an established, rapidly evolving neighborhood. NO BLIND OFFERS. NO WHOLESALERS. NO CREATIVE FINANCING. CASH OR HARD MONEY ONLY.
-
2005-01-25soldstatus $280,000
ⓘ Source: listings_history table (triggers on properties + properties_extension) + one-shot
backfill from property_details.listing_events for pre-trigger history.
Tax reassessment forecast GA · Resets to sale price
- Current annual tax
- $4,533 · $378/mo
- Projected year-2 tax
- $4,533 · $378/mo
- Expected delta
- $0/yr ($0/mo · 0.0%)
ⓘ Screening estimate from a state-policy table — verify with the county assessor before closing.
Climate risk First Street
- Flood 1/10 Low FEMA zone X (unshaded) · 0% chance over 30 yrs
- Wildfire 1/10 Low
- Heat 6/10 Major 7 d/yr ≥104°F today · 18 d/yr by 30 yrs out
- Wind 6/10 Major 27% chance of damaging wind over 30 yrs
- Air quality 4/10 Moderate 4 unhealthy d/yr today · 6 by 30 yrs out
Nearby sold comps map
Loading sold comps map…
Walkable amenities ~0.75 mi
Loading nearby amenities…
Taxation est. · year 1
- Rental income
- $26,278
- − Mortgage interest
- −$11,483
- − Property taxes
- −$4,533
- − Insurance
- −$1,025
- − Repairs & maintenance
- −$2,102
- − Management
- −$2,102
- − Depreciation
- −$5,964
- Taxable loss
- −$931
- Est. tax savings @ 24.0%
- +$224
- After-tax cash flow
- $2,525/yr
For passive investors: Depreciation is non-cash, so a rental often shows a tax loss while cash-flowing — sheltering income. Rental losses are passive: they offset passive income freely, and up to $25,000/yr can offset ordinary (W-2) income if you actively participate and your MAGI is under $100k (phasing out to $0 by $150k); unused losses carry forward. On sale, claimed depreciation is recaptured at up to 25%, and gains may owe capital-gains tax (a 1031 exchange can defer both). Figures are a year-1 estimate at your 24.0% rate — not tax advice; consult a CPA.
Schools (NCES district)
- District
- Atlanta Public Schools
- NCES district ID
- 1300120
- Math proficiency
- 28% ▼ -6.00%
- Reading proficiency
- 35% ▼ -2.00%
- Median HH income
- $48,306
- Composite
- 27.27/100
- National rank
- #7006
- State rank
- #80 of 174 in GA
Livability — Atlanta
- Score
- 83/100
- State rank
- #6
- US rank
- #919
Category grades
Schools grade is shown separately in the Schools card above.
Census & demographics
- Census place
- Atlanta, GA
- County
- Fulton County · 1,094,430 people
- City population
- 629,525
- Metro
- Atlanta-Sandy Springs-Alpharetta, GA
- Population (ZIP)
- 27,186
- Household income
- $53,037
- Rent vs Own
- Severe rent burden
- 1676.0
Population outlook (Fulton County) Hauer SSP2
- Today (2025)
- 1,203,707 people
- By 2030
- 1,299,706 · +8.0%
- By 2040
- 1,488,256 · +23.6%
- By 2050
- 1,664,580 · +38.3%
- By 2075
- 2,036,072 · +69.2%
- By 2100
- 2,222,402 · +84.6%
Race, ethnicity, and origin ACS 2023
- Neighborhood character
- Predominantly Black (76%)
- Race & ethnicity
- Black 76% White 14% Two or more races 4% Hispanic / Latino 4% Asian 2%
- Common ancestry
- Lithuanian 1% Slovak 1% Serbian 0%
- Foreign-born
- 5% · Canada, South Korea, Vietnam
- Languages at home
- 92% English-only · Spanish 4% French/Haitian/Cajun 1% Other Indo-European 1%
Political lean MEDSL · Fulton
- 2024 margin
- Solid D (+44.9) · D 71.9% · R 27.0% · Other 1.1%
- 2008→2024 swing
- +9.8pp toward D · 2008: 35.0pp · 2024: 44.9pp
- All cycles
- 2024: D+44.9 2020: D+46.4 2016: D+42.1 2012: D+29.6 2008: D+35.0
Not yet ingested
- Civics
- —
Market trends
- HPI YoY
- ▼ -204.00%
- Current HPI
- 418.7297
- Rent YoY
- ▲ 2.77%
- Metro
- Atlanta-Sandy Springs-Alpharetta, GA
- State GDP YoY
- ▲ 2.66%
- F500 in state
- 28
Industry mix (Fortune 500 HQ in GA)
| Industry | F500 HQs | Revenue |
|---|---|---|
| Paper / Packaging | 2 | $29B |
|
||
| Retail | 1 | $160B |
|
||
| Transportation / Logistics | 1 | $91B |
|
||
| Airlines | 1 | $62B |
|
||
| Consumer Goods | 1 | $47B |
|
||
| Utilities | 1 | $25B |
|
||
Price history
-26.8% since first listed3 events — show timeline
- 2026-02-06 Listed $205,000 FMLS
- 2026-02-06 Listed $205,000 GAMLS
- 2005-01-25 Sold (Public Records) $280,000 Public Records
Property tax history
+7.7%/yrLatest (2025): $4,533 · +43.2% YoY. Source: county tax records.
Cash-flow waterfall
monthlySold comps — $/sqft
last 12 mo · ≤1 miLoading sold comps…