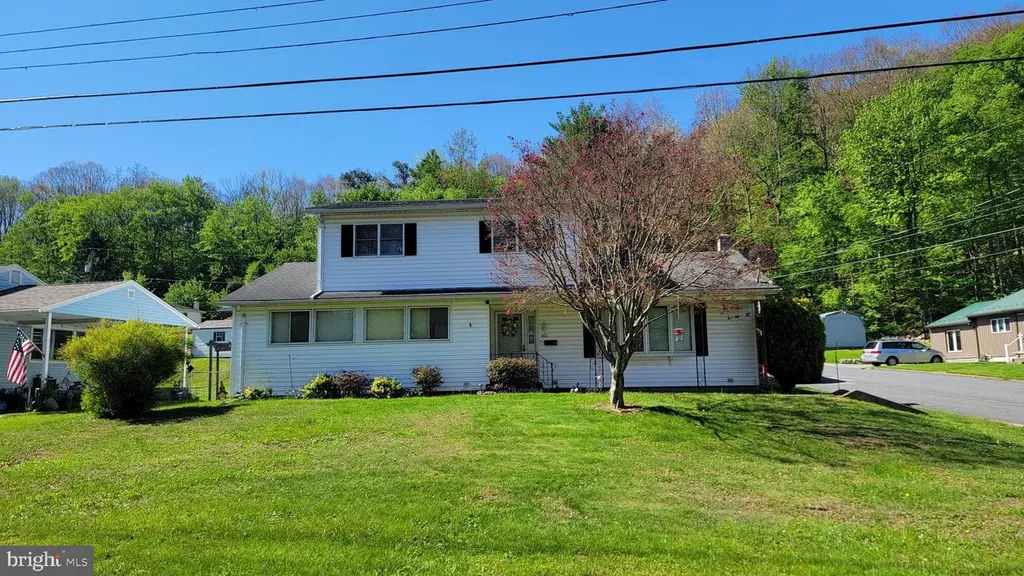
600 Parkview Rd · Lykens, PA
Flood risk 6/10 · Moderate
- FEMA flood zone
- X (unshaded)
- Chance of flooding over 30 yrs
- 0.71%
- Est. flood insurance / yr
- $473 – $860
Fire risk 4/10 · Minor
- Est. fire insurance / yr
- $511 – $949
Heat risk 4/10 · Minor
- Hot days now (above 94°F)
- 7 days/yr
- Hot days in 30 yrs
- 16 days/yr
Wind risk 2/10 · Minimal
- Chance of severe wind over 30 yrs
- 4.0%
Air-quality risk 2/10 · Minimal
- Unhealthy air days now
- 1 days/yr
- Unhealthy air days in 30 yrs
- 2 days/yr
Risk factors via First Street. Map © Google.
Why this score? — see what drove the D grade
The composite is a weighted blend of 9 inputs, each scored 0–100. Each bar is that input's sub-score; the figure is the points it added to the 100-point composite (weight × sub-score).
- Cash flow +11.9/30.0
- ARV discount +5.0/15.0
- Appreciation +4.8/10.0
- Schools +3.9/10.0
- 1% rule +3.7/10.0
- DSCR +3.5/10.0
- Livability +3.4/5.0
- Rent growth +2.5/5.0
- Condition / age +2.5/5.0
$200,000
🖨 Deal sheet (PDF) 📄 Offer letter ✓ Due diligence
Listing remarks
A spacious 5-bedroom, 2.5-bath home situated on a corner lot just outside of town. Enjoy peaceful surroundings with beautiful views overlooking the Glen and baseball fields. This property offers the perfect blend of privacy and convenience, featuring generous living space for families, entertaining, or working from home. The out-of-town setting provides a quiet atmosphere while still being close to local amenities and community activities. Whether you're looking for room to grow or simply want a home with a beautiful setting and small-town charm, 600 Parkview Road is a must-see!
Key facts
- Local amenities
- Corner lot
- 8,712 sq ft lot
Tags
Property features AI
Exterior
- Parking: On-street parking
- Utilities: 200+ amp electric service; Public water; Oil for heating and hot water; Municipal trash not provided
- Home design: Detached home; Above-grade finished living area reported by assessor
- Construction: Frame construction; Block foundation; Asphalt roof; Year built source: Assessor
- Exterior features: Detached structure; Above-grade and below-grade other structures
Interior
- Bedrooms: Three main-level bedrooms; Two upper-level bedrooms
- Flooring: Carpet; Laminate; Wood
- Bathrooms: Two full bathrooms (one on main level, one on upper level); One half bathroom on the lower level
- Heating & cooling: Hot water baseboard heating; Oil-fired heating and hot water
- Interior features: Basement present with poured concrete foundation and walkout stairs; Not in a federal flood zone
- Laundry & utility: Laundry in the basement
Neighborhood map
What this means for you Summary
Snapshot
- This is a 5-bed/1.5-bath single-family listed at $200k.
Deal economics
- At list price, monthly cash flow is $-51 ($-613/yr) — negative.
- To cash-flow at today's rent, offer at most $191k (4.5% below list).
- To meet the 1% rule (rent ≥ 1% of price), the offer needs to be $175k (12.7% below list).
- Recommended offer: $175k (12.7% below list) — sets the bar for 1% rule.
Location & tenants
- Location reads 67/100 on livability (#969 in PA) — a middle-class / working-renter tenant base. Strengths: crime A+, cost of living A+, housing A+; Watch: amenities F, commute F, employment D-.
- Upper Dauphin Area SD (rural): math 37% / reading 55% proficiency, ranked #259 of 539 in PA (top 48%) — families likely to look elsewhere, expect single-tenant / working-renter base with shorter leases.
- Zoned schools: Upper Dauphin Area El Sch (math 42% / reading 62%, grade C-, #586 of 1,518 statewide, top 42%, 399 students, 52% FRL); Upper Dauphin Area Ms (math 25% / reading 52%, grade F, #275 of 512 statewide, top 55%, 312 students, 48% FRL); Upper Dauphin Area Hs (math 77%, 343 students, 47% FRL) — zoned schools average 49% FRL vs 32% district-wide (17 pts higher); higher-poverty schools than district average — tighter screening recommended.
- Market conditions: 26 active listings in the ZIP; 540 units permitted in Dauphin County in 2024 (194 in 5+ unit buildings).
Forward outlook
- In year one you build about $421 of equity ($1k loan paydown + $-962 appreciation (-0.5% local appreciation)).
Negotiation context
- It's been on market 16 days — a 2% lower offer ($197k) is reasonable based on typical stale-listing flexibility.
Risks & watch-outs
- Watch-outs: built in 1956 — expect roof / HVAC / electrical / plumbing capex.
- Climate carrying-cost: major flood risk — expect insurance premiums to compound above CPI over the hold.
Questions for the listing agent
- What do current leases actually rent for vs. the listed asking? Can we see a recent rent roll and the last 12 months of T-12 income?
- Built in 1956 — when were the roof, HVAC, electrical panel, plumbing, and water heater last replaced?
- Is there a deadline driving the sale (1031 exchange, divorce, estate, relocation)? That informs how much negotiation room exists.
- Schools are D-rated, which usually means shorter tenancies and higher turnover. Who's the typical renter profile here, and what's been the actual vacancy rate?
- The area grade is low — what's the realistic commute time and amenity access for the typical tenant pool here? Any planned neighborhood developments (good or bad) we should know about?
- What's the average days-on-market for RENTAL listings here right now (not sales)? A rising rental-DOM trend means longer vacancies and softer asking-rent achievability than the comps imply.
- What's the recent tenant-quality profile in this submarket — average credit score on applications, eviction rate, late-payment / NSF rate, and stable-employment percentage? A property-management company in the area should have these aggregated.
- How much new for-sale + rental construction is in the pipeline within 1–3 miles? Heavy new supply typically softens prices + rents 12–24 months out; constrained supply supports both.
Investment metrics
- 1% rule
- 0.87% ✗
- Cap rate
- 5.99%
- Cash-on-cash
- -1.09%
- DSCR
- 0.95
- GRM
- 9.5
CMA / ARV
- ARV (on-the-fly)
- $189,440
- Comps found
- 5
Show comp detail 5 sales within ~0.75 mi
| Address | Dist | Beds/Ba | Sqft | Sold | Price | $/sf | Match |
|---|---|---|---|---|---|---|---|
| 803 Main St | 0.41mi | 4/1.5 (-1) | 2,313 (-2%) | 11mo | $190,200 | $82 | 63 |
| 558 Main St | 0.24mi | 4/2.0 (-1) | 2,251 (-5%) | 20mo | $180,000 | $80 | 57 |
| 619 Market St | 0.11mi | 6/2.0 (+1) | 2,716 (+15%) | 24mo | $150,000 | $55 | 43 |
| 659 N 2nd St | 0.34mi | 4/1.5 (-1) | 2,012 (-15%) | 23mo | $159,900 | $79 | 35 |
| 400 North St | 0.48mi | 4/1.5 (-1) | 2,016 (-15%) | 23mo | $195,000 | $97 | 29 |
Match score weights: distance 35% · size 25% · config 20% · recency 20%. Top-matched comps best support the ARV.
Projected returns pro-forma
-0.48% appreciation · 3.0% rent growth · sell at horizon
- IRR
- -5.3%
- Equity multiple
- 0.76×
- Total profit
- $-13,528
- Equity at exit
- $53,308
- IRR
- 1.0%
- Equity multiple
- 1.10×
- Total profit
- $5,542
- Equity at exit
- $60,389
Cash invested: $56,000 (down + closing). Projections, not guarantees.
Landlord ↔ Tenant lean methodology
- Overall (STATE)
- 62 Landlord-Friendly
- State Pennsylvania
- 62 Landlord-Friendly · EVEN
- County
- — inherits STATE
- City
- — inherits STATE
ZIP-level market 17048
- Home prices YoY
- -0.2%
- Active inventory
- 26
- Price-to-rent
- 9.5×
Monthly cashflow live
- Estimated rent
- $1,745 medium interval (Pro) →
- Mortgage (P&I)
- −$1,049
- Tax from tax record
- −$298 /mo · $3,572/yr
- Insurance
- −$83
- HOA
- −$0
- Lot rent
- −$0
- Vacancy / Maint / Mgmt
- −$367
- Net cashflow
- $-51
Break-even live
Sensitivity live
| Price | -10% $62 | -5% $6 | +0% $-51 | +5% $-108 | +10% $-164 |
|---|---|---|---|---|---|
| Rent | -10% $-189 | -5% $-120 | +0% $-51 | +5% $18 | +10% $87 |
| Rate | -1.0pp $50 | -0.5pp $0 | base $-51 | +0.5pp $-103 | +1.0pp $-156 |
UW: 25.0% down · 7.5% · 30yr · 1.5% tax · 5.0% vac · 8.0% maint · 8.0% mgmt
Financing live
Cash to close
- Down payment
- $50,000
- Closing costs
- $6,000
- Reserves months
- —
- Total cash needed
- —
Loan-product check · same deal, 3 products live
Conventional
25% down · 7.5% · 30yr
- Down + closing
- —
- Monthly P&I
- —
- Monthly cashflow
- —
- DSCR
- —
- Eligible?
- —
Personal DTI + credit; lowest rate.
DSCR
20% down · 8.5% · 30yr
- Down + closing
- —
- Monthly P&I
- —
- Monthly cashflow
- —
- DSCR
- —
- Eligible?
- —
No personal income docs; deal must DSCR.
Hard money
10% down · 12.0% · 12mo
- Down + closing
- —
- Monthly P&I
- —
- Monthly cashflow
- —
- DSCR
- —
- Eligible?
- —
Short-term bridge; refi at stabilization.
Listing history 5 events
-
2026-06-03status $200,000 Pending 16 DOM
-
2026-06-02days on market $200,000 Active 16 DOM
-
2026-06-01days on market $200,000 Active 15 DOM
-
2026-05-31days on market $200,000 Active 14 DOM
-
2026-05-17$200,000 Active
ⓘ Source: listings_history table (triggers on properties + properties_extension) + one-shot
backfill from property_details.listing_events for pre-trigger history.
Tax reassessment forecast PA · Partial reset (capped growth)
- Current annual tax
- $3,572 · $298/mo
- Projected year-2 tax
- $3,572 · $298/mo
- Expected delta
- $0/yr ($0/mo · 0.0%)
ⓘ Screening estimate from a state-policy table — verify with the county assessor before closing.
Climate risk First Street
- Flood 6/10 Major FEMA zone X (unshaded) · 71% chance over 30 yrs
- Wildfire 4/10 Moderate
- Heat 4/10 Moderate 7 d/yr ≥94°F today · 16 d/yr by 30 yrs out
- Wind 2/10 Low 4% chance of damaging wind over 30 yrs
- Air quality 2/10 Low 1 unhealthy d/yr today · 2 by 30 yrs out
Nearby sold comps map
Loading sold comps map…
Walkable amenities ~0.75 mi
Loading nearby amenities…
Taxation est. · year 1
- Rental income
- $20,943
- − Mortgage interest
- −$11,203
- − Property taxes
- −$3,572
- − Insurance
- −$1,000
- − Repairs & maintenance
- −$1,675
- − Management
- −$1,675
- − Depreciation
- −$5,818
- Taxable loss
- −$4,001
- Est. tax savings @ 24.0%
- +$960
- After-tax cash flow
- $347/yr
For passive investors: Depreciation is non-cash, so a rental often shows a tax loss while cash-flowing — sheltering income. Rental losses are passive: they offset passive income freely, and up to $25,000/yr can offset ordinary (W-2) income if you actively participate and your MAGI is under $100k (phasing out to $0 by $150k); unused losses carry forward. On sale, claimed depreciation is recaptured at up to 25%, and gains may owe capital-gains tax (a 1031 exchange can defer both). Figures are a year-1 estimate at your 24.0% rate — not tax advice; consult a CPA.
Schools (NCES district)
- District
- Upper Dauphin Area SD
- NCES district ID
- 4224360
- Math proficiency
- 37% ▼ -3.00%
- Reading proficiency
- 55% ▼ -8.00%
- Median HH income
- $48,201
- Composite
- 39.23/100
- National rank
- #4012
- State rank
- #259 of 539 in PA
Livability — Lykens
- Score
- 67/100
- State rank
- #969
- US rank
- #10571
Category grades
Schools grade is shown separately in the Schools card above.
Census & demographics
- Census place
- Lykens, PA
- Population (ZIP)
- 3,801
Population outlook (Dauphin County) Hauer SSP2
- Today (2025)
- 281,628 people
- By 2030
- 283,549 · +0.7%
- By 2040
- 285,385 · +1.3%
- By 2050
- 286,188 · +1.6%
- By 2075
- 291,053 · +3.3%
- By 2100
- 282,374 · +0.3%
Race, ethnicity, and origin ACS 2023
- Neighborhood character
- Predominantly White (88%)
- Race & ethnicity
- White 88% Two or more races 8% Hispanic / Latino 2% Asian 2%
- Common ancestry
- Polish 4% Romanian 3% Iranian 3%
- Foreign-born
- 1% · Canada, India
- Languages at home
- 88% English-only · German/W. Germanic 10% Spanish 2%
Political lean MEDSL · Dauphin
- 2024 margin
- Lean D (+5.9) · D 52.4% · R 46.5% · Other 1.1%
- 2008→2024 swing
- -3.1pp toward R · 2008: 9.1pp · 2024: 5.9pp
- All cycles
- 2024: D+5.9 2020: D+8.5 2016: D+2.8 2012: D+6.0 2008: D+9.1
Not yet ingested
- Civics
- —
Market trends
- HPI YoY
- ▼ -0.48%
- Current HPI
- 241.7628
- Rent YoY
- —
- Metro
- —
- State GDP YoY
- ▲ 1.68%
- F500 in state
- 34
Industry mix (Fortune 500 HQ in PA)
| Industry | F500 HQs | Revenue |
|---|---|---|
| Healthcare | 2 | $309B |
|
||
| Insurance | 2 | $27B |
|
||
| Telecommunications / Media | 1 | $124B |
|
||
| Industrial Distribution | 1 | $22B |
|
||
| Financial Services | 1 | $20B |
|
||
| Chemicals / Materials | 1 | $18B |
|
||
Price history
2 events — show timeline
- 2026-06-02 Pending — BRIGHT MLS
- 2026-05-17 Listed $200,000 BRIGHT MLS
Property tax history
+1.9%/yrLatest (2026): $3,572 · +5.6% YoY. Source: county tax records.
Cash-flow waterfall
monthlySold comps — $/sqft
last 12 mo · ≤1 miLoading sold comps…