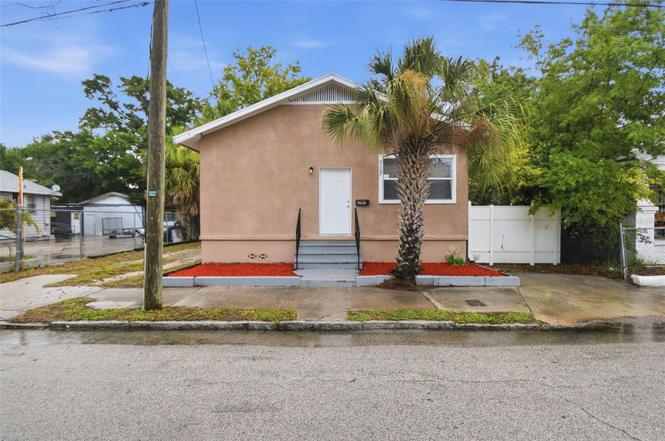
3107 N 16th St · Tampa, FL
Flood risk 6/10 · Moderate
- FEMA flood zone
- X (unshaded)
- Chance of flooding over 30 yrs
- 0.72%
- Est. flood insurance / yr
- $507 – $1,088
Fire risk 1/10 · Minimal
- Est. fire insurance / yr
- $947 – $1,759
Heat risk 10/10 · Severe
- Hot days now (above 107°F)
- 7 days/yr
- Hot days in 30 yrs
- 26 days/yr
Wind risk 9/10 · Severe
- Chance of severe wind over 30 yrs
- 99.0%
Air-quality risk 3/10 · Minor
- Unhealthy air days now
- 3 days/yr
- Unhealthy air days in 30 yrs
- 4 days/yr
Risk factors via First Street. Map © Google.
Why this score? — see what drove the D grade
The composite is a weighted blend of 9 inputs, each scored 0–100. Each bar is that input's sub-score; the figure is the points it added to the 100-point composite (weight × sub-score).
- Appreciation +10.0/10.0
- Cash flow +7.9/30.0
- ARV discount +7.5/15.0
- Schools +4.2/10.0
- Livability +4.0/5.0
- Rent growth +2.6/5.0
- Condition / age +2.5/5.0
- 1% rule +2.0/10.0
- DSCR +1.9/10.0
$289,999
🖨 Deal sheet 📄 Offer letter ✓ Due diligence
Listing remarks MLS
FABULOUS NEWLY RENOVATED HOME!!! Upgrades include hardwood floors, tiles in all wet areas, maple cabinetry with crown moldings, granite coutertops in kitchen and baths with brand new fixtures, brand new appliances. High ceiling with open split floor plan. This charming home is move in ready complete with a backyard porch overlooking a spacious fenced in private backyard. Ideally located in walking distance from schools, parks and minutes to downtown area. There's no one like it in this area, THIS IS A MUSTSEE!!!Seller will assist with closing cost with reasonable offer.
Key facts
- Tampa home
- 4,900 sq ft lot
- Built 1925
Tags
Property features AI
Finance
- Other: Zoning: RS-50
- HOA & community: Pets allowed
Exterior
- Utilities: Water: See remarks; Sewer: Other; Other utilities
- Home design: Single family residence; Residential property; One story; Faces east; Entry level: One
- Construction: Stucco construction; Shingle roof; Slab foundation; Built on 0.11 acre lot
- Exterior features: Private mailbox; Asphalt road access
Interior
- Kitchen: Dishwasher; Microwave; Range; Refrigerator
- Bedrooms: 3 bedrooms
- Bathrooms: 2 full bathrooms
- Heating & cooling: Electric heating; Central air conditioning
- Interior features: Open floor plan; Other interior features
- Laundry & utility: Laundry: Other
Neighborhood map
What this means for you Summary
Snapshot
- This is a 3-bed/2.0-bath single-family listed at $290k.
Deal economics
- At list price, monthly cash flow is $-314 ($-4k/yr) — negative.
- To cash-flow at today's rent, offer at most $234k (19.1% below list).
- To meet the 1% rule (rent ≥ 1% of price), the offer needs to be $203k (30.0% below list).
- Recommended offer: $203k (30.0% below list) — sets the bar for 1% rule.
Location & tenants
- Location reads 79/100 on livability (#142 in FL, #2,135 nationally) — a middle-class / working-renter tenant base. Strengths: commute A+, housing A+, health & safety A+; Watch: crime D+.
- Hillsborough (suburban): math 47% / reading 50% proficiency, ranked #41 of 73 in FL (top 56%) — families likely to look elsewhere, expect single-tenant / working-renter base with shorter leases.
- Zoned schools: Middleton High School (math 23% / reading 51%, grade F, #340 of 667 statewide, top 52%, 1,511 students, 57% FRL).
- Market conditions: Rents flat; 187 active listings in the ZIP; 40 comparable units currently listed for rent nearby; rentals at typical pace (median 15d on market — plan ~3-4 weeks tenant-placement turnaround); lower-income renter base — watch delinquency; 9,053 units permitted in Hillsborough County in 2024 (4,555 in 5+ unit buildings).
- At $2,029/mo this rent would consume 66% of the median local household income ($37k/yr) (locally 1374% of renters already pay >50% of income on rent) — very limited rent-growth headroom before tenants either downsize or default.
Forward outlook
- In year one you build about $31k of equity ($2k loan paydown + $29k appreciation (10.0% local appreciation)).
- Hillsborough County population projected at +37% by 2050 — long-run rental-demand tailwind backs the buy-and-hold thesis.
- By year 2, paydown + projected appreciation supports a ~$50k cash-out refi (75% LTV) — recoverable capital for the next deal without selling this one.
Negotiation context
- Only 2 days on market — expect competitive offers; lowballing is unlikely to land.
- 7 sale attempts since 20y ago with the ask held roughly flat each time — persistent listings suggest the price (not the market) is what's stuck; bring a comps-based counter.
Risks & watch-outs
- Watch-outs: built in 1925 — expect roof / HVAC / electrical / plumbing capex.
- Climate carrying-cost: major flood risk; severe wind risk, 99% chance of damaging wind over 30y; extreme-heat days projected 7→26/yr by 2055 (HVAC capex compounding) — expect insurance premiums to compound above CPI over the hold.
Questions for the listing agent
- What do current leases actually rent for vs. the listed asking? Can we see a recent rent roll and the last 12 months of T-12 income?
- Built in 1925 — when were the roof, HVAC, electrical panel, plumbing, and water heater last replaced?
- Is there a deadline driving the sale (1031 exchange, divorce, estate, relocation)? That informs how much negotiation room exists.
- Crime grade is D in this area — have there been break-ins, vandalism, or insurance claims at this property in the last 3 years? What carrier currently insures it and at what premium?
- The area grade is low — what's the realistic commute time and amenity access for the typical tenant pool here? Any planned neighborhood developments (good or bad) we should know about?
- What's the average days-on-market for RENTAL listings here right now (not sales)? A rising rental-DOM trend means longer vacancies and softer asking-rent achievability than the comps imply.
- What's the recent tenant-quality profile in this submarket — average credit score on applications, eviction rate, late-payment / NSF rate, and stable-employment percentage? A property-management company in the area should have these aggregated.
- How much new for-sale + rental construction is in the pipeline within 1–3 miles? Heavy new supply typically softens prices + rents 12–24 months out; constrained supply supports both.
Investment metrics
- 1% rule
- 0.70% ✗
- Cap rate
- 4.99%
- Cash-on-cash
- -4.64%
- DSCR
- 0.79
- GRM
- 11.9
CMA / ARV
No comps found within radius.
Projected returns pro-forma
10.0% appreciation · 0.58% rent growth · sell at horizon
- IRR
- 20.3%
- Equity multiple
- 2.64×
- Total profit
- $133,082
- Equity at exit
- $261,254
- IRR
- 18.1%
- Equity multiple
- 5.91×
- Total profit
- $398,744
- Equity at exit
- $563,404
Cash invested: $81,200 (down + closing). Projections, not guarantees.
Landlord ↔ Tenant lean methodology
- Overall (STATE)
- 87 Strongly Landlord-Friendly
- State Florida
- 87 Strongly Landlord-Friendly · R+3
- County
- — inherits STATE
- City
- — inherits STATE
ZIP-level market 33605
- Home prices YoY
- 3.7%
- Rents YoY
- 0.6%
- Active inventory
- 187
- Price-to-rent
- 11.9×
Monthly cashflow live
- Estimated rent
- $2,029 high interval (Pro) →
- Mortgage (P&I)
- −$1,521
- Tax from tax record
- −$275 /mo · $3,303/yr
- Insurance
- −$121
- HOA
- −$0
- Vacancy / Maint / Mgmt
- −$426
- Net cashflow
- $-314
Break-even live
UW: 25.0% down · 7.5% · 30yr · 1.5% tax · 5.0% vac · 8.0% maint · 8.0% mgmt
Financing live
Cash to close
- Down payment
- $72,500
- Closing costs
- $8,700
- Reserves months
- —
- Total cash needed
- —
Loan-product check · same deal, 3 products live
Conventional
25% down · 7.5% · 30yr
- Down + closing
- —
- Monthly P&I
- —
- Monthly cashflow
- —
- DSCR
- —
- Eligible?
- —
Personal DTI + credit; lowest rate.
DSCR
20% down · 8.5% · 30yr
- Down + closing
- —
- Monthly P&I
- —
- Monthly cashflow
- —
- DSCR
- —
- Eligible?
- —
No personal income docs; deal must DSCR.
Hard money
10% down · 12.0% · 12mo
- Down + closing
- —
- Monthly P&I
- —
- Monthly cashflow
- —
- DSCR
- —
- Eligible?
- —
Short-term bridge; refi at stabilization.
Rent comps 40 comps
| Address | Beds | Baths | Sqft | Rent | $/sqft | DOM | Units | Dist |
|---|---|---|---|---|---|---|---|---|
| 3021 Sanchez St Tampa, FL | 3.0 | 1.0 | 1300 | $2,195 | $1.69 | 24d | 1 | 0.07mi |
| 3210 N 16th St Tampa, FL | 4.0 | 2.0 | 1380 | $1,875 | $1.36 | 2d | 1 | 0.08mi |
| 3210 N 16th St Tampa, FL | 4.0 | 2.0 | 1380 | $1,995 | $1.45 | 21d | 1 | 0.08mi |
| 3005 Sanchez St Unit 5 Tampa, FL | 2.0 | 1.0 | 750 | $1,050 | $1.40 | 2d | 1 | 0.10mi |
| 2909 N 17th St Tampa, FL | 2.0 | 1.0 | 750 | $1,350 | $1.80 | 21d | 1 | 0.18mi |
| 1807 E 20th Ave Tampa, FL | 3.0 | 2.0 | 1131 | $2,900 | $2.56 | 24d | 1 | 0.22mi |
| 2907 N 15th St Unit D Tampa, FL | 3.0 | 2.0 | 888 | $1,850 | $2.08 | 4d | 1 | 0.22mi |
| 2810 N 16th St Tampa, FL | 2.0 | 1.0 | 1066 | $2,550 | $2.39 | 12d | 1 | 0.25mi |
| 1607 E 18th Ave Tampa, FL | 2.0 | 1.0 | 869 | $2,600 | $2.99 | 12d | 1 | 0.27mi |
| 1302 E 21st Ave Tampa, FL | 1.0–2.0 | 1.0–2.0 | 800 | $1,408 | $1.76 | 4d | 9 | 0.29mi |
| 1605 E 29th Ave Tampa, FL | 3.0 | 1.0 | 870 | $1,800 | $2.07 | 20d | 1 | 0.31mi |
| 1212 E 25th Ave Tampa, FL | 2.0 | 1.0 | 1035 | $1,490 | $1.44 | 19d | 1 | 0.33mi |
| 3411 N 13th St Tampa, FL | 3.0 | 2.0 | 978 | $1,895 | $1.94 | 24d | 1 | 0.35mi |
| 2108 E 22nd Ave Tampa, FL | 3.0 | 3.0 | 1308 | $2,100 | $1.61 | 4d | 1 | 0.35mi |
| 2108 E 22nd Ave Tampa, FL | 3.0 | 3.0 | 1308 | $2,100 | $1.61 | 3d | 1 | 0.35mi |
| 1716 E Columbus Dr Unit A Tampa, FL | 2.0 | 1.0 | 924 | $1,800 | $1.95 | 24d | 1 | 0.35mi |
| 2002 E 18th Ave Tampa, FL | 4.0 | 2.0 | 1084 | $2,400 | $2.21 | 4d | 1 | 0.40mi |
| 1211 E 18th Ave Unit 2 Tampa, FL | 2.0 | 1.0 | 725 | $1,800 | $2.48 | 17d | 1 | 0.41mi |
| 2006 E Columbus Dr Unit A Tampa, FL | 2.0 | 1.0 | 896 | $1,495 | $1.67 | 1d | 1 | 0.44mi |
| 1515 E 31st Ave Tampa, FL | 2.0 | 1.0 | 914 | $1,500 | $1.64 | 4d | 1 | 0.45mi |
| 1221 E Columbus Dr Tampa, FL | 2.0 | 1.0 | 1000 | $1,499 | $1.50 | 24d | 1 | 0.46mi |
| 2205 Chipco St Tampa, FL | 2.0 | 1.0 | 1100 | $1,600 | $1.45 | 24d | 1 | 0.47mi |
| 1105 E 28th Ave Tampa, FL | 3.0 | 1.0 | 744 | $1,525 | $2.05 | 4d | 1 | 0.48mi |
| 1003 E 22nd Ave Tampa, FL | 2.0 | 1.0 | 1062 | $1,639 | $1.54 | 4d | 1 | 0.48mi |
| 2104 E Columbus Dr Tampa, FL | 3.0 | 2.0 | 1231 | $1,995 | $1.62 | 24d | 1 | 0.49mi |
| 2104 E Columbus Dr Unit 301 Tampa, FL | 3.0 | 2.0 | 1083 | $2,050 | $1.89 | 24d | 1 | 0.49mi |
| 2214 E 18th Ave Tampa, FL | 3.0 | 2.0 | 1188 | $2,295 | $1.93 | 4d | 1 | 0.50mi |
| 1006 E 26th Ave Tampa, FL | 2.0 | 1.0 | 1000 | $1,630 | $1.63 | 4d | 1 | 0.51mi |
| 1305 E Louise Ave Tampa, FL | 3.0 | 2.0 | 1384 | $2,700 | $1.95 | 24d | 1 | 0.55mi |
| 3511 Cone Ct Tampa, FL | 3.0 | 2.0 | 1256 | $2,200 | $1.75 | 4d | 1 | 0.57mi |
| 912 E Saint Clair St Tampa, FL | 2.0 | 1.0 | 1000 | $1,900 | $1.90 | 24d | 1 | 0.57mi |
| 1003 E Columbus Dr Tampa, FL | 2.0 | 1.0 | 1160 | $1,795 | $1.55 | 1d | 1 | 0.60mi |
| 2703 N 24th St Unit 1 Tampa, FL | 3.0 | 3.0 | 1164 | $2,295 | $1.97 | 13d | 1 | 0.60mi |
| 2407 E 17th Ave Unit B Tampa, FL | 3.0 | 2.0 | 810 | $1,650 | $2.04 | 17d | 1 | 0.60mi |
| 2407 E 17th Ave Tampa, FL | 3.0 | 2.0 | 810 | $1,650 | $2.04 | 24d | 1 | 0.60mi |
| 2407 E 17th Ave Tampa, FL | 3.0 | 2.0 | 810 | $1,650 | $2.04 | 21d | 1 | 0.60mi |
| 2407 E 17th Ave Apt A Tampa, FL | 3.0 | 2.0 | 810 | $1,650 | $2.04 | 14d | 1 | 0.60mi |
| 2407 E 17th Ave Apt A Tampa, FL | 3.0 | 2.0 | 810 | $1,595 | $1.97 | 10d | 1 | 0.60mi |
| 1504 E 33rd Ave Tampa, FL | 3.0 | 2.0 | 1108 | $2,900 | $2.62 | 24d | 1 | 0.61mi |
| 2308 E 15th Ave Tampa, FL | 3.0 | 1.0 | 936 | $1,895 | $2.02 | 14d | 1 | 0.63mi |
Listing history 3 events
-
2026-06-18days on market $289,999 Active 2 DOM
-
2026-06-16remarks 625-char remark
-
2026-06-16$289,999 Active 1 DOM
ⓘ Source: listings_history table (triggers on properties + properties_extension) + one-shot
backfill from property_details.listing_events for pre-trigger history.
Tax reassessment forecast FL · Resets to sale price
- Current annual tax
- $3,303 · $275/mo
- Projected year-2 tax
- $3,303 · $275/mo
- Expected delta
- $0/yr ($0/mo · 0.0%)
ⓘ Screening estimate from a state-policy table — verify with the county assessor before closing.
Climate risk First Street
- Flood 6/10 Major FEMA zone X (unshaded) · 72% chance over 30 yrs
- Wildfire 1/10 Low
- Heat 10/10 Extreme 7 d/yr ≥107°F today · 26 d/yr by 30 yrs out
- Wind 9/10 Extreme 99% chance of damaging wind over 30 yrs
- Air quality 3/10 Moderate 3 unhealthy d/yr today · 4 by 30 yrs out
Nearby sold comps map
Loading sold comps map…
Walkable amenities ~0.75 mi
Loading nearby amenities…
Taxation est. · year 1
- Rental income
- $24,344
- − Mortgage interest
- −$16,244
- − Property taxes
- −$3,303
- − Insurance
- −$1,450
- − Repairs & maintenance
- −$1,948
- − Management
- −$1,948
- − Depreciation
- −$8,436
- Taxable loss
- −$8,985
- Est. tax savings @ 24.0%
- +$2,156
- After-tax cash flow
- $-1,614/yr
For passive investors: Depreciation is non-cash, so a rental often shows a tax loss while cash-flowing — sheltering income. Rental losses are passive: they offset passive income freely, and up to $25,000/yr can offset ordinary (W-2) income if you actively participate and your MAGI is under $100k (phasing out to $0 by $150k); unused losses carry forward. On sale, claimed depreciation is recaptured at up to 25%, and gains may owe capital-gains tax (a 1031 exchange can defer both). Figures are a year-1 estimate at your 24.0% rate — not tax advice; consult a CPA.
Schools (NCES district)
- District
- Hillsborough
- NCES district ID
- 1200870
- Math proficiency
- 47% ▼ -8.00%
- Reading proficiency
- 50% ▼ -4.00%
- Median HH income
- $50,622
- Composite
- 41.6/100
- National rank
- #3435
- State rank
- #41 of 73 in FL
Livability — Tampa
- Score
- 79/100
- State rank
- #142
- US rank
- #2135
Category grades
Schools grade is shown separately in the Schools card above.
Census & demographics
- Census place
- Tampa, FL
- County
- Hillsborough County · 1,540,968 people
- City population
- 523,346
- Metro
- Tampa-St. Petersburg-Clearwater, FL
- Population (ZIP)
- 16,030
- Household income
- $36,975
- Rent vs Own
- Severe rent burden
- 1374.0
Population outlook (Hillsborough County) Hauer SSP2
- Today (2025)
- 1,607,022 people
- By 2030
- 1,733,968 · +7.9%
- By 2040
- 1,979,565 · +23.2%
- By 2050
- 2,203,427 · +37.1%
- By 2075
- 2,667,893 · +66.0%
- By 2100
- 2,891,558 · +79.9%
Race, ethnicity, and origin ACS 2023
- Neighborhood character
- Diverse neighborhood (Simpson 0.66)
- Race & ethnicity
- Black 48% Hispanic / Latino 28% Two or more races 18% White 17% Asian 1%
- Hispanic origin (detail)
- Mexican 6% Puerto Rican 8% Cuban 6% Dominican 1%
- Common ancestry
- Hispanic 2% Romanian 1% Lithuanian 1%
- Foreign-born
- 17% · Canada, Vietnam, Jamaica
- Languages at home
- 72% English-only · Spanish 24% French/Haitian/Cajun 3% Other Asian/Pacific 1%
Political lean MEDSL · Hillsborough
- 2024 margin
- Toss-up / Even · D 47.8% · R 50.9% · Other 1.3%
- 2008→2024 swing
- -10.2pp toward R · 2008: 7.1pp · 2024: -3.1pp
- All cycles
- 2024: R+3.1 2020: D+6.9 2016: D+6.8 2012: D+6.7 2008: D+7.1
Not yet ingested
- Civics
- —
Market trends
- HPI YoY
- ▲ 17.43%
- Current HPI
- 494.1871
- Rent YoY
- ▲ 0.58%
- Metro
- Tampa-St. Petersburg-Clearwater, FL
- State GDP YoY
- ▲ 3.28%
- F500 in state
- 36
Industry mix (Fortune 500 HQ in FL)
| Industry | F500 HQs | Revenue |
|---|---|---|
| Industrial Technology | 2 | $29B |
|
||
| Insurance | 2 | $17B |
|
||
| Retail | 1 | $60B |
|
||
| Technology Distribution | 1 | $58B |
|
||
| Homebuilding | 1 | $35B |
|
||
| Technology Manufacturing | 1 | $35B |
|
||
Price history
+1771.0% since first listed30 events — show timeline
- 2026-06-16 Listed $289,999 Stellar MLS as Distributed by MLS Grid
- 2024-04-28 Rental Removed $1,790 RENTLY
- 2024-03-06 Price Changed $1,790 RENTLY
- 2024-02-28 Price Changed $1,870 RENTLY
- 2024-02-22 Price Changed $1,895 RENTLY
- 2024-02-14 Price Changed $1,995 RENTLY
- 2024-02-07 Price Changed $2,095 RENTLY
- 2024-01-20 Listed for Rent $2,145 RENTLY
- 2023-08-29 Rental Removed $2,145 RENTLY
- 2023-08-23 Price Changed $2,145 RENTLY
- 2023-08-16 Price Changed $2,185 RENTLY
- 2023-08-09 Price Changed $2,195 RENTLY
- 2023-08-04 Price Changed $2,220 RENTLY
- 2023-07-25 Price Changed $2,245 RENTLY
- 2022-11-15 Sold (Public Records) $1,092,534 Public Records
- 2009-08-28 Sold (MLS) $41,000 Stellar MLS as Distributed by MLS Grid
- 2009-07-20 Listed $59,500 Stellar MLS as Distributed by MLS Grid
- 2008-12-18 Listed $45,000 Stellar MLS as Distributed by MLS Grid
- 2008-03-01 Listing Removed — Stellar MLS as Distributed by MLS Grid
- 2007-07-23 Listed $105,000 Stellar MLS as Distributed by MLS Grid
- 2007-07-05 Listing Removed — Stellar MLS as Distributed by MLS Grid
- 2007-05-25 Listed $121,000 Stellar MLS as Distributed by MLS Grid
- 2006-10-16 Listed $139,900 Stellar MLS as Distributed by MLS Grid
- 2002-12-10 Sold (Public Records) $80,000 Public Records
- 2002-08-14 Sold (Public Records) $50,000 Public Records
- 2002-05-16 Sold (Public Records) $22,000 Public Records
- 1991-08-01 Sold (Public Records) $12,000 Public Records
- 1990-03-01 Sold (Public Records) $9,000 Public Records
- 1981-06-01 Sold (Public Records) $21,000 Public Records
- 1980-12-01 Sold (Public Records) $15,500 Public Records
Property tax history
+14.8%/yrLatest (2025): $3,303 · +1.1% YoY. Source: county tax records.
Cash-flow waterfall
monthlySold comps — $/sqft
last 12 mo · ≤1 miLoading sold comps…