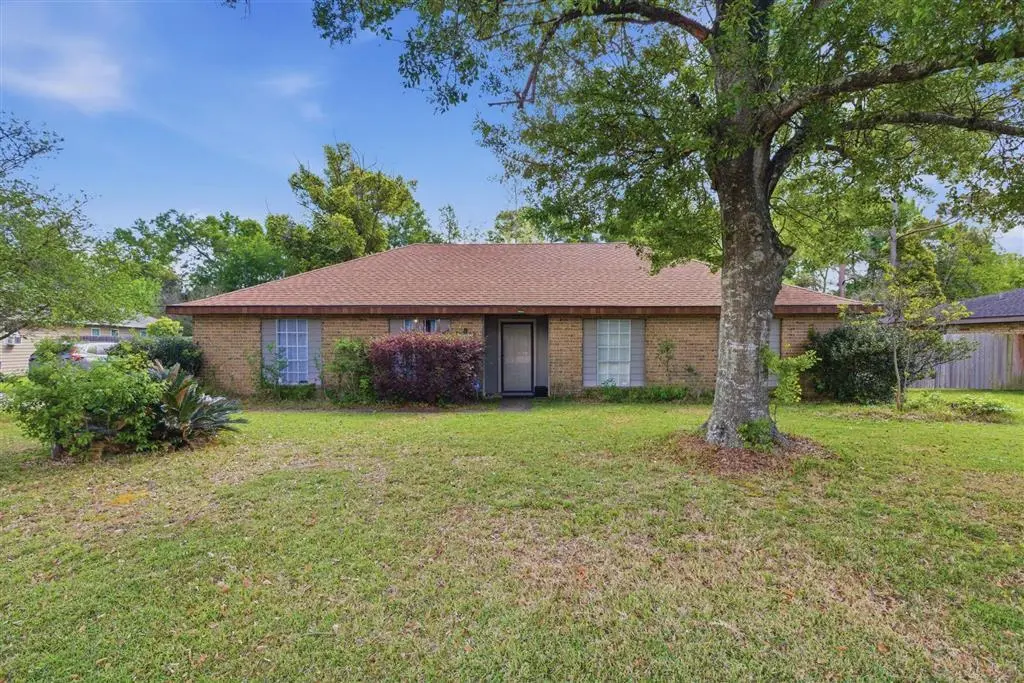
4711 E Greenfield Cir Cir E · Lake Charles, LA
Flood risk 5/10 · Moderate
- FEMA flood zone
- X (shaded)
- Chance of flooding over 30 yrs
- 0.24%
- Est. flood insurance / yr
- $507 – $1,088
Fire risk 1/10 · Minimal
- Est. fire insurance / yr
- $1,269 – $2,357
Heat risk 8/10 · Major
- Hot days now (above 109°F)
- 5 days/yr
- Hot days in 30 yrs
- 14 days/yr
Wind risk 9/10 · Severe
- Chance of severe wind over 30 yrs
- 99.0%
Air-quality risk 2/10 · Minimal
- Unhealthy air days now
- 1 days/yr
- Unhealthy air days in 30 yrs
- 1 days/yr
Risk factors via First Street. Map © Google.
Why this score? — see what drove the C+ grade
The composite is a weighted blend of 9 inputs, each scored 0–100. Each bar is that input's sub-score; the figure is the points it added to the 100-point composite (weight × sub-score).
- Cash flow +22.7/30.0
- ARV discount +10.9/15.0
- DSCR +7.3/10.0
- 1% rule +5.2/10.0
- Rent growth +5.0/5.0
- Livability +3.4/5.0
- Schools +3.1/10.0
- Condition / age +2.5/5.0
- Appreciation +0.0/10.0
$226,000
🖨 Deal sheet 📄 Offer letter ✓ Due diligence
Listing remarks MLS
This 3 bedroom 2 bath ranch in South Lake Charles is conveniently located near shopping and schools. Tile floors throughout make for easy upkeep. Beautiful brick fireplace in the den that accentuates the cathedral ceiling. Large kitchen with breakfast nook. Great flexible space that could be a second living area, an office, or formal dining. Back yard features an in ground pool. 2016 property taxes were $1,169.18. Flood zone X.
Key facts
- Large back yard
- Spacious family room
- 0.29 acre lot
Tags
Property features AI
Exterior
- Parking: Attached garage; Garage with 2 spaces; Open parking
- Utilities: Public water; Public sewer; Electricity connected; Water connected; Sewer connected
- Home design: Single-family residence; Updated / remodeled condition; House structure; 10 total stories; Corner location on the lot
- Construction: Brick construction; Slab foundation
- Exterior features: Covered patio; Patio; Wood fencing (fenced yard); Shingle roof
Interior
- Kitchen: Dishwasher; Electric cooktop; Electric oven
- Bedrooms: 3 bedrooms on the main level
- Bathrooms: 2 full bathrooms on the main level
- Heating & cooling: Central heating; Central air conditioning
- Interior features: Ceiling fans; Cathedral ceilings; Wood-burning fireplace
Neighborhood map
What this means for you Summary
Snapshot
- This is a 3-bed/2.0-bath single-family listed at $226k.
Deal economics
- At list price, monthly cash flow is $390 ($5k/yr) — positive.
- The deal already cash-flows at list — no discount required.
- Meets the 1% rule at list price ($2k rent vs $226k).
- Cap rate 8.4% vs local median 4.3% in Lake Charles — top-decile yield for the area; either an underpriced asset or a hidden risk that comps aren't pricing in. Stress-test before assuming the spread holds.
Location & tenants
- Location reads 68/100 on livability (#95 in LA) — a middle-class / working-renter tenant base. Strengths: commute A+, cost of living A+, housing A+; Watch: crime F, amenities F, employment D-.
- Calcasieu Parish (other): math 30% / reading 44% proficiency, ranked #29 of 98 in LA (top 30%) — families likely to look elsewhere, expect single-tenant / working-renter base with shorter leases.
- Zoned schools: A. A. Nelson Elementary School (math 36% / reading 52%, grade F, #191 of 646 statewide, top 30%, 741 students, 55% FRL); Alfred M. Barbe High School (math 41% / reading 56%, grade D, #41 of 265 statewide, top 16%, 1,991 students, 41% FRL) — zoned schools at 48% FRL track the district average.
- Market conditions: Rents rising fast (+15.1%/yr); 456 active listings in the ZIP; 4 comparable units currently listed for rent nearby; rentals lingering (median 44d on market — plan ~5-8 weeks vacancy on turnover, expect pricing pressure); 50% of comp listings sitting > 30 days — soft ceiling on asking rent; solid renter incomes; 1,298 units permitted in Calcasieu Parish in 2024 (526 in 5+ unit buildings).
- This rent runs 32% of the median local income ($86k/yr) — at the standard rent-burdened threshold; future hikes will face affordability resistance.
Forward outlook
- Local home prices are declining (-3.0%/yr); year-one equity from $2k of loan paydown is wiped out by about $7k of value loss. Plan a longer hold.
- Calcasieu County population projected at +11% by 2050 — modest demand growth; plan on rents tracking national, not racing it.
- At projected returns (-3.0% appreciation + 8.0% rent growth), your $63k cash investment doubles in ~9 years — after that, you're playing with house money.
Negotiation context
- Only 7 days on market — expect competitive offers; lowballing is unlikely to land.
- 2 sale attempts since 9y ago with the ask held roughly flat each time — persistent listings suggest the price (not the market) is what's stuck; bring a comps-based counter.
Risks & watch-outs
- Climate carrying-cost: moderate flood risk; severe wind risk, 99% chance of damaging wind over 30y; extreme-heat days projected 5→14/yr by 2055 (HVAC capex compounding) — expect insurance premiums to compound above CPI over the hold.
Questions for the listing agent
- Built in 1979 — when were the roof, HVAC, electrical panel, plumbing, and water heater last replaced?
- Is there a deadline driving the sale (1031 exchange, divorce, estate, relocation)? That informs how much negotiation room exists.
- Schools are B-rated — typically a magnet for longer-tenancy family renters. What's the average tenant stay here, and is there a school-zone premium baked into asking?
- Crime grade is F in this area — have there been break-ins, vandalism, or insurance claims at this property in the last 3 years? What carrier currently insures it and at what premium?
- What's the average days-on-market for RENTAL listings here right now (not sales)? A rising rental-DOM trend means longer vacancies and softer asking-rent achievability than the comps imply.
- What's the recent tenant-quality profile in this submarket — average credit score on applications, eviction rate, late-payment / NSF rate, and stable-employment percentage? A property-management company in the area should have these aggregated.
- How much new for-sale + rental construction is in the pipeline within 1–3 miles? Heavy new supply typically softens prices + rents 12–24 months out; constrained supply supports both.
Investment metrics
- 1% rule
- 1.02% ✓
- Cap rate
- 8.37%
- Cash-on-cash
- 7.40%
- DSCR
- 1.33
- GRM
- 8.2
CMA / ARV
- ARV (median comp)
- $244,562
- List price
- $226,000
- Delta
- -5.95%
- Verdict
- FAIR
- Comps
- 20 within 1.0 mi
Show comp detail 12 sales within ~0.75 mi
| Address | Dist | Beds/Ba | Sqft | Sold | Price | $/sf | Match |
|---|---|---|---|---|---|---|---|
| 1525 W Autumnwood Ln W | 0.20mi | 3/2.0 | 1,964 (-2%) | 5mo | $219,000 | $112 | 83 |
| 1506 S Greenfield Cir S | 0.13mi | 4/2.5 (+1) | 2,025 (+1%) | 2mo | $229,000 | $113 | 83 |
| 1411 Jefferson Dr | 0.54mi | 3/2.0 | 1,908 (-5%) | 1mo | $235,000 | $123 | 66 |
| 1407 Jefferson Dr | 0.56mi | 3/2.0 | 1,946 (-3%) | 4mo | $260,000 | $134 | 66 |
| 1514 Tuscany Dr | 0.58mi | 3/2.0 | 2,020 (+1%) | 6mo | $315,000 | $156 | 66 |
| 4272 Holly Hill Ct | 0.56mi | 3/2.0 | 1,945 (-3%) | 4mo | $219,000 | $113 | 66 |
| 1539 Tuscany Ln | 0.61mi | 3/2.0 | 1,940 (-3%) | 2mo | $345,000 | $178 | 65 |
| 1119 Mobile St | 0.69mi | 3/2.0 | 1,971 (-2%) | 1mo | $171,000 | $87 | 65 |
| 1550 Lacadie Dr #14 | 0.53mi | 3/2.5 | 1,947 (-3%) | 5mo | $227,500 | $117 | 65 |
| 1441 Wedgewood St | 0.54mi | 3/2.0 | 2,183 (+9%) | 4mo | $288,000 | $132 | 56 |
| 4124 W Jevon Ln W | 0.70mi | 3/2.5 | 2,132 (+7%) | 4mo | $350,000 | $164 | 51 |
| 1023 N Worthington Dr Dr N | 0.57mi | 4/3.0 (+1) | 2,254 (+13%) | 1mo | $420,000 | $186 | 42 |
Match score weights: distance 35% · size 25% · config 20% · recency 20%. Top-matched comps best support the ARV.
Projected returns pro-forma
-3.0% appreciation · 8.0% rent growth · sell at horizon
- IRR
- 0.1%
- Equity multiple
- 1.01×
- Total profit
- $366
- Equity at exit
- $33,697
- IRR
- 14.1%
- Equity multiple
- 2.38×
- Total profit
- $87,530
- Equity at exit
- $19,540
Cash invested: $63,280 (down + closing). Projections, not guarantees.
Landlord ↔ Tenant lean methodology
- Overall (STATE)
- 90 Strongly Landlord-Friendly
- State Louisiana
- 90 Strongly Landlord-Friendly · R+12
- County
- — inherits STATE
- City
- — inherits STATE
ZIP-level market 70605
- Rents YoY
- 15.1%
- Active inventory
- 456
- Price-to-rent
- 8.2×
Monthly cashflow live
- Estimated rent
- $2,303 medium interval (Pro) →
- Mortgage (P&I)
- −$1,185
- Tax from tax record
- −$149 /mo · $1,792/yr
- Insurance
- −$94
- HOA
- −$0
- Vacancy / Maint / Mgmt
- −$484
- Net cashflow
- $390
Break-even live
UW: 25.0% down · 7.5% · 30yr · 1.5% tax · 5.0% vac · 8.0% maint · 8.0% mgmt
Financing live
Cash to close
- Down payment
- $56,500
- Closing costs
- $6,780
- Reserves months
- —
- Total cash needed
- —
Loan-product check · same deal, 3 products live
Conventional
25% down · 7.5% · 30yr
- Down + closing
- —
- Monthly P&I
- —
- Monthly cashflow
- —
- DSCR
- —
- Eligible?
- —
Personal DTI + credit; lowest rate.
DSCR
20% down · 8.5% · 30yr
- Down + closing
- —
- Monthly P&I
- —
- Monthly cashflow
- —
- DSCR
- —
- Eligible?
- —
No personal income docs; deal must DSCR.
Hard money
10% down · 12.0% · 12mo
- Down + closing
- —
- Monthly P&I
- —
- Monthly cashflow
- —
- DSCR
- —
- Eligible?
- —
Short-term bridge; refi at stabilization.
Rent comps 4 comps
| Address | Beds | Baths | Sqft | Rent | $/sqft | DOM | Units | Dist |
|---|---|---|---|---|---|---|---|---|
| 4326 Christina St Lake Charles, LA | 3.0 | 2.0 | 1600 | $1,770 | $1.11 | 21d | 1 | 0.39mi |
| 4650 Nelson Rd Lake Charles, LA | 1.0–3.0 | 1.0–2.0 | 1032 | $1,875 | $1.82 | 13d | 24 | 0.67mi |
| 716 Dianne Ln Lake Charles, LA | 3.0 | 2.0 | 2200 | $5,000 | $2.27 | 44d | 1 | 0.99mi |
| 3708 Nelson Rd Lake Charles, LA | 3.0 | 2.0 | 2020 | $1,400 | $0.69 | 44d | 1 | 1.43mi |
Listing history 16 events
-
2026-06-19days on market $226,000 Active 7 DOM
-
2026-06-18days on market $226,000 Active 6 DOM
-
2026-06-17days on market $226,000 Active 5 DOM
-
2026-06-16days on market $226,000 Active 4 DOM
-
2026-06-15days on market $226,000 Active 3 DOM
-
2026-06-13remarks 695-char remark
-
2026-06-13pricedays on market $226,000 Active 1 DOM
-
2026-05-06status Active 566-char remark
-
2026-05-06price $230,000 566-char remark
-
2026-04-22historical 566-char remark
-
2026-04-09price $238,000 566-char remark
-
2026-03-28$245,000 Active 566-char remark
-
2017-03-28soldstatus $200,000
-
2017-03-27soldstatus 431-char remark
Show marketing remark (431 chars)
This 3 bedroom 2 bath ranch in South Lake Charles is conveniently located near shopping and schools. Tile floors throughout make for easy upkeep. Beautiful brick fireplace in the den that accentuates the cathedral ceiling. Large kitchen with breakfast nook. Great flexible space that could be a second living area, an office, or formal dining. Back yard features an in ground pool. 2016 property taxes were $1,169.18. Flood zone X.
-
2017-01-05$208,900 431-char remark
Show marketing remark (431 chars)
This 3 bedroom 2 bath ranch in South Lake Charles is conveniently located near shopping and schools. Tile floors throughout make for easy upkeep. Beautiful brick fireplace in the den that accentuates the cathedral ceiling. Large kitchen with breakfast nook. Great flexible space that could be a second living area, an office, or formal dining. Back yard features an in ground pool. 2016 property taxes were $1,169.18. Flood zone X.
-
2001-10-19soldstatus $116,000
ⓘ Source: listings_history table (triggers on properties + properties_extension) + one-shot
backfill from property_details.listing_events for pre-trigger history.
Tax reassessment forecast LA · Resets to sale price
- Current annual tax
- $1,792 · $149/mo
- Projected year-2 tax
- $1,792 · $149/mo
- Expected delta
- $0/yr ($0/mo · 0.0%)
ⓘ Screening estimate from a state-policy table — verify with the county assessor before closing.
Climate risk First Street
- Flood 5/10 Major FEMA zone X (shaded) · 24% chance over 30 yrs
- Wildfire 1/10 Low
- Heat 8/10 Severe 5 d/yr ≥109°F today · 14 d/yr by 30 yrs out
- Wind 9/10 Extreme 99% chance of damaging wind over 30 yrs
- Air quality 2/10 Low 1 unhealthy d/yr today · 1 by 30 yrs out
Nearby sold comps map
Loading sold comps map…
Walkable amenities ~0.75 mi
Loading nearby amenities…
Taxation est. · year 1
- Rental income
- $27,631
- − Mortgage interest
- −$12,660
- − Property taxes
- −$1,792
- − Insurance
- −$1,130
- − Repairs & maintenance
- −$2,210
- − Management
- −$2,210
- − Depreciation
- −$6,575
- Taxable income
- $1,055
- Est. tax owed @ 24.0%
- −$253
- After-tax cash flow
- $4,432/yr
For passive investors: Depreciation is non-cash, so a rental often shows a tax loss while cash-flowing — sheltering income. Rental losses are passive: they offset passive income freely, and up to $25,000/yr can offset ordinary (W-2) income if you actively participate and your MAGI is under $100k (phasing out to $0 by $150k); unused losses carry forward. On sale, claimed depreciation is recaptured at up to 25%, and gains may owe capital-gains tax (a 1031 exchange can defer both). Figures are a year-1 estimate at your 24.0% rate — not tax advice; consult a CPA.
Schools (NCES district)
- District
- Calcasieu Parish
- NCES district ID
- 2200330
- Math proficiency
- 30% ▼ -39.00%
- Reading proficiency
- 44% ▼ -33.00%
- Median HH income
- $44,700
- Composite
- 31.45/100
- National rank
- #5979
- State rank
- #29 of 98 in LA
Livability — Lake Charles
- Score
- 68/100
- State rank
- #95
- US rank
- #9820
Category grades
Schools grade is shown separately in the Schools card above.
Census & demographics
- Census place
- Lake Charles, LA
- County
- Calcasieu Parish · 170,889 people
- City population
- 133,538
- Metro
- Lake Charles, LA
- Population (ZIP)
- 40,482
- Household income
- $86,015
- Rent vs Own
- Severe rent burden
- 1328.0
Population outlook (Calcasieu County) Hauer SSP2
- Today (2025)
- 212,179 people
- By 2030
- 218,199 · +2.8%
- By 2040
- 228,486 · +7.7%
- By 2050
- 236,208 · +11.3%
- By 2075
- 251,696 · +18.6%
- By 2100
- 247,848 · +16.8%
Race, ethnicity, and origin ACS 2023
- Neighborhood character
- Predominantly White (79%)
- Race & ethnicity
- White 79% Black 10% Hispanic / Latino 6% Two or more races 6% Asian 3%
- Hispanic origin (detail)
- Mexican 2%
- Common ancestry
- Lithuanian 12% Italian 3% Slovak 2%
- Foreign-born
- 6% · Canada, Jamaica
- Languages at home
- 92% English-only · Spanish 4% Other Indo-European 2% Other Asian/Pacific 1%
Political lean MEDSL · Calcasieu
- 2024 margin
- Solid R (+39.6) · D 29.5% · R 69.0% · Other 1.5%
- 2008→2024 swing
- -15.0pp toward R · 2008: -24.6pp · 2024: -39.6pp
- All cycles
- 2024: R+39.6 2020: R+35.2 2016: R+33.3 2012: R+28.7 2008: R+24.6
Not yet ingested
- Civics
- —
Market trends
- HPI YoY
- ▼ -102.68%
- Current HPI
- 105.1903
- Rent YoY
- ▲ 15.10%
- Metro
- Lake Charles, LA
- State GDP YoY
- ▲ 3.29%
- F500 in state
- 10
Industry mix (Fortune 500 HQ in LA)
| Industry | F500 HQs | Revenue |
|---|---|---|
| Telecommunications | 2 | $23B |
|
||
| Utilities | 1 | $12B |
|
||
| Wholesale / Distribution | 1 | $5B |
|
||
| Advertising | 1 | $2B |
|
||
Price history
+94.8% since first listed5 events — show timeline
- 2026-06-12 Listed $226,000 SWLAR
- 2017-03-28 Sold (Public Records) $200,000 Public Records
- 2017-03-27 Sold (MLS) — SWLAR
- 2017-01-05 Listed $208,900 SWLAR
- 2001-10-19 Sold (Public Records) $116,000 Public Records
Property tax history
+1.0%/yrLatest (2025): $1,792 · +2.4% YoY. Source: county tax records.
Cash-flow waterfall
monthlySold comps — $/sqft
last 12 mo · ≤1 miLoading sold comps…