 Fourplex
4320 Columbus St · Bakersfield, CA
Flood risk 1/10 · Minimal
- FEMA flood zone
- X (unshaded)
- Chance of flooding over 30 yrs
- 0.0%
- Est. flood insurance / yr
- $507 – $1,088
Fire risk 7/10 · Major
- Est. fire insurance / yr
- $659 – $1,223
Heat risk 8/10 · Major
- Hot days now (above 105°F)
- 6 days/yr
- Hot days in 30 yrs
- 16 days/yr
Wind risk 1/10 · Minimal
- Chance of severe wind over 30 yrs
- —
Air-quality risk 10/10 · Severe
- Unhealthy air days now
- 34 days/yr
- Unhealthy air days in 30 yrs
- 40 days/yr
Risk factors via First Street. Map © Google.
Why this score? — see what drove the D grade
The composite is a weighted blend of 9 inputs, each scored 0–100. Each bar is that input's sub-score; the figure is the points it added to the 100-point composite (weight × sub-score).
- Cash flow +15.1/30.0
- ARV discount +7.5/15.0
- DSCR +4.6/10.0
- Schools +3.4/10.0
- 1% rule +3.2/10.0
- Rent growth +3.1/5.0
- Livability +2.9/5.0
- Condition / age +2.5/5.0
- Appreciation +0.0/10.0
$980,000
🖨 Deal sheet (PDF) 📄 Offer letter ✓ Due diligence
Multi-family units
County records classify this as Multi-Family (5+ Unit). Listing-text estimate: 4 units. estimate disagrees with records
5+ unit building — per-unit beds/baths from public records are typically unavailable; the breakdown below (if shown) is an estimate from the listing text.
Listing remarks
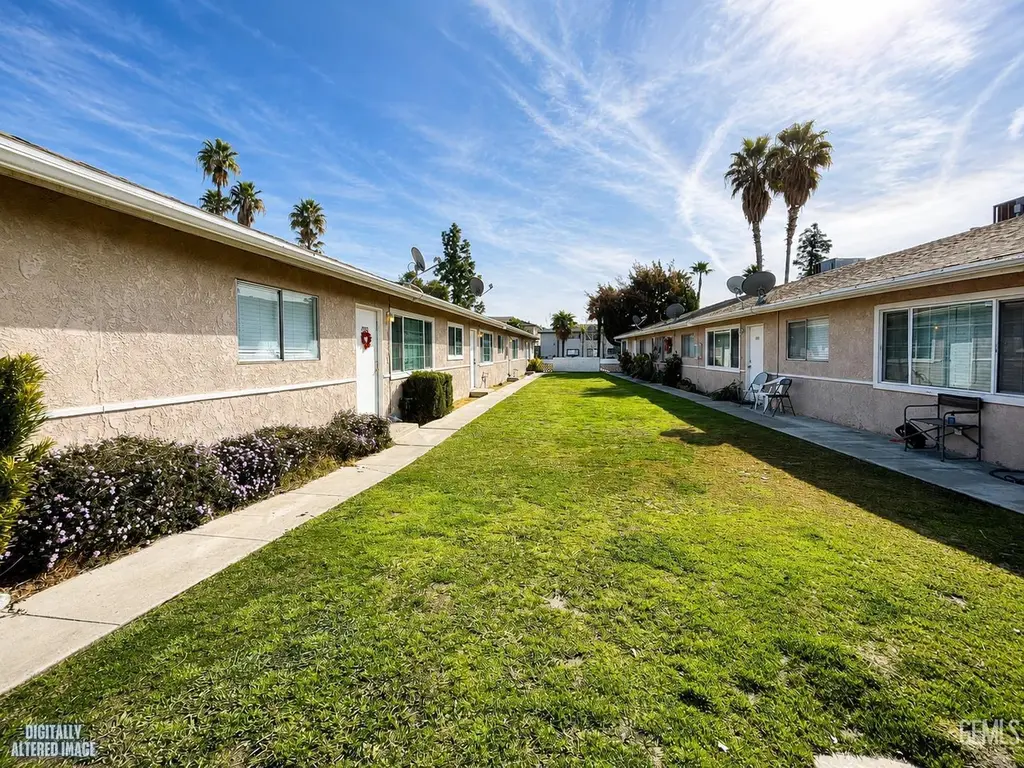
Incredible 8-unit multifamily investment opportunity in Bakersfield's desirable 93306 corridor! Two well-maintained 4-plex buildings on one parcel, totaling 6,336 sq ft. All 2BD/1BA floor plans with private yard areas, covered parking, and a common area between buildings. On-site laundry room, some new windows, and great curb appeal. 6 of the 8 Central AC units are about 6 years old or NEWER. 100% occupied with gross monthly income of $8,960, and current rents ranging from $1,050-$1,250 are still below the market rate of $1,250-$1,300 per unit, meaning there's real upside for the next owner! Strong cash flow, strong demand, strong market - this one checks all the boxes!6.7% Cap Rate.
Key facts
- Covered parking
- Private yard areas
- On-site laundry room
Tags
Property features AI
Finance
- Other: Price per unit listed at $122,500
- Financial info: 8-unit multifamily property; Owner-managed; Annual gross income approximately $107,520; Annual net income approximately $66,284; Total annual expenses approximately $41,236; Pro forma income/expense reporting; Common annual expenses listed: fire insurance ~$8,000; garden/garbage ~$4,680; repairs ~$3,265; utilities ~$4,800; Vacancy factor accounted at 4%
Exterior
- Parking: Carport parking
- Utilities: Sewer service
- Home design: Single-story building
- Construction: Slab foundation; Composition roof
- Exterior features: Property zoned R2; Occupied by tenants
Interior
- Bedrooms: Eight 2-bedroom units (each unit is 2 bedrooms)
- Bathrooms: Eight 1-bath units (each unit has 1 bathroom)
- Heating & cooling: Central air conditioning
- Interior features: Private patios for units; On-site laundry room
- Laundry & utility: Shared laundry room
Neighborhood map
What this means for you Summary
Snapshot
- This is a 4 × 4-bed/?-bath units multifamily listed at $980k.
Deal economics
- At list price, monthly cash flow is $317 ($4k/yr) — positive. Per door: $79/mo.
- The deal already cash-flows at list — no discount required.
- To meet the 1% rule (rent ≥ 1% of price), the offer needs to be $805k (17.8% below list).
- Recommended offer: $805k (17.8% below list) — sets the bar for 1% rule.
- Cap rate 6.7% vs local median 3.6% in Bakersfield — top-decile yield for the area; either an underpriced asset or a hidden risk that comps aren't pricing in. Stress-test before assuming the spread holds.
Location & tenants
- Location reads 58/100 on livability (#716 in CA) — a working-class tenant base; expect higher turnover. Strengths: housing A+; Watch: health & safety D, crime F, amenities F.
- Kern High (urban): math 21% / reading 51% proficiency, ranked #860 of 1,400 in CA (top 61%) — families likely to look elsewhere, expect single-tenant / working-renter base with shorter leases.
- Zoned schools: Colonel Howard Nichols Elementary (931 students, 82% FRL); Chipman Junior High (727 students, 72% FRL); Highland High (reading 75%, 2,599 students, 79% FRL).
- Market conditions: Rents rising (+2.2%/yr); 392 active listings in the ZIP; 3,244 units permitted in Kern County in 2024 (73 in 5+ unit buildings).
- At $8,051/mo this rent would consume 138% of the median local household income ($70k/yr) (locally 2871% of renters already pay >50% of income on rent) — very limited rent-growth headroom before tenants either downsize or default.
Forward outlook
- Local home prices are declining (-3.0%/yr); year-one equity from $7k of loan paydown is wiped out by about $29k of value loss. Plan a longer hold.
- Kern County population projected at +17% by 2050 — long-run rental-demand tailwind backs the buy-and-hold thesis.
Negotiation context
- Only 9 days on market — expect competitive offers; lowballing is unlikely to land.
Risks & watch-outs
- Climate carrying-cost: major wildfire risk; extreme-heat days projected 6→16/yr by 2055 (HVAC capex compounding) — expect insurance premiums to compound above CPI over the hold.
Questions for the listing agent
- Can we see the unit-by-unit rent roll, current vacancy, and any below-market leases? What's the average tenancy length?
- What capital expenditures (roof, boiler, parking lot, exteriors) have been made in the last 5 years, and what's planned in the next 2?
- Built in 1962 — when were the roof, HVAC, electrical panel, plumbing, and water heater last replaced?
- Is there a deadline driving the sale (1031 exchange, divorce, estate, relocation)? That informs how much negotiation room exists.
- Schools are D-rated, which usually means shorter tenancies and higher turnover. Who's the typical renter profile here, and what's been the actual vacancy rate?
- Crime grade is F in this area — have there been break-ins, vandalism, or insurance claims at this property in the last 3 years? What carrier currently insures it and at what premium?
- The area grade is low — what's the realistic commute time and amenity access for the typical tenant pool here? Any planned neighborhood developments (good or bad) we should know about?
- What's the average days-on-market for RENTAL listings here right now (not sales)? A rising rental-DOM trend means longer vacancies and softer asking-rent achievability than the comps imply.
- What's the recent tenant-quality profile in this submarket — average credit score on applications, eviction rate, late-payment / NSF rate, and stable-employment percentage? A property-management company in the area should have these aggregated.
- How much new apartment / multifamily construction is in the pipeline within 1–3 miles? Heavy new supply (>2% of stock underway) typically softens rents 12–24 months out; light construction supports rent growth.
Investment metrics
- 1% rule
- 0.82% ✗
- Cap rate
- 6.68%
- Cash-on-cash
- 1.39%
- DSCR
- 1.06
- GRM
- 10.1
CMA / ARV
No comps found within radius.
Projected returns pro-forma
-3.0% appreciation · 2.24% rent growth · sell at horizon
- IRR
- -14.9%
- Equity multiple
- 0.47×
- Total profit
- $-145,049
- Equity at exit
- $146,121
- IRR
- -7.5%
- Equity multiple
- 0.54×
- Total profit
- $-126,327
- Equity at exit
- $84,732
Cash invested: $274,400 (down + closing). Projections, not guarantees.
Landlord ↔ Tenant lean methodology
- Overall (STATE)
- 18 Strongly Tenant-Friendly
- State California
- 18 Strongly Tenant-Friendly · D+13
- County
- — inherits STATE
- City
- — inherits STATE
ZIP-level market 93306
- Rents YoY
- 2.2%
- Active inventory
- 392
- Price-to-rent
- 40.6×
Monthly cashflow live
- Estimated rent
- $8,051 medium interval (Pro) →
- Mortgage (P&I)
- −$5,139
- Tax from tax record
- −$496 /mo · $5,949/yr
- Insurance
- −$408
- HOA
- −$0
- Vacancy / Maint / Mgmt
- −$1,691
- Net cashflow
- $317
Break-even live
Sensitivity live
| Price | -10% $872 | -5% $594 | +0% $317 | +5% $40 | +10% $-238 |
|---|---|---|---|---|---|
| Rent | -10% $-319 | -5% $-1 | +0% $317 | +5% $635 | +10% $953 |
| Rate | -1.0pp $811 | -0.5pp $566 | base $317 | +0.5pp $63 | +1.0pp $-195 |
4-unit breakdown (identical units grouped — click to expand)
| Units | Beds | Baths | Est. rent |
|---|---|---|---|
| 4× units | 4 | — | $8,052 |
| #1 | 4 | — | $2,013 |
| #2 | 4 | — | $2,013 |
| #3 | 4 | — | $2,013 |
| #4 | 4 | — | $2,013 |
| Total (4 units) | $8,051 | ||
UW: 25.0% down · 7.5% · 30yr · 1.5% tax · 5.0% vac · 8.0% maint · 8.0% mgmt
Financing live
Cash to close
- Down payment
- $245,000
- Closing costs
- $29,400
- Reserves months
- —
- Total cash needed
- —
Loan-product check · same deal, 3 products live
Conventional
25% down · 7.5% · 30yr
- Down + closing
- —
- Monthly P&I
- —
- Monthly cashflow
- —
- DSCR
- —
- Eligible?
- —
Personal DTI + credit; lowest rate.
DSCR
20% down · 8.5% · 30yr
- Down + closing
- —
- Monthly P&I
- —
- Monthly cashflow
- —
- DSCR
- —
- Eligible?
- —
No personal income docs; deal must DSCR.
Hard money
10% down · 12.0% · 12mo
- Down + closing
- —
- Monthly P&I
- —
- Monthly cashflow
- —
- DSCR
- —
- Eligible?
- —
Short-term bridge; refi at stabilization.
Listing history 7 events
-
2026-06-14statusdays on market $980,000 Pending 9 DOM
-
2026-06-10days on market $980,000 Active 7 DOM
-
2026-06-09days on market $980,000 Active 6 DOM
-
2026-06-08days on market $980,000 Active 5 DOM
-
2026-06-07days on market $980,000 Active 4 DOM
-
2026-06-05remarks 692-char remark
-
2026-06-05$980,000 Active 1 DOM
ⓘ Source: listings_history table (triggers on properties + properties_extension) + one-shot
backfill from property_details.listing_events for pre-trigger history.
Tax reassessment forecast CA · Resets to sale price
- Current annual tax
- $5,949 · $496/mo
- Projected year-2 tax
- $7,448 · $621/mo
- Expected delta
- +$1,499/yr (+$125/mo · 25.2%)
ⓘ Screening estimate from a state-policy table — verify with the county assessor before closing.
Climate risk First Street
- Flood 1/10 Low FEMA zone X (unshaded) · 0% chance over 30 yrs
- Wildfire 7/10 Severe
- Heat 8/10 Severe 6 d/yr ≥105°F today · 16 d/yr by 30 yrs out
- Wind 1/10 Low
- Air quality 10/10 Extreme 34 unhealthy d/yr today · 40 by 30 yrs out
Nearby sold comps map
Loading sold comps map…
Walkable amenities ~0.75 mi
Loading nearby amenities…
Taxation est. · year 1
- Rental income
- $96,612
- − Mortgage interest
- −$54,895
- − Property taxes
- −$5,949
- − Insurance
- −$4,900
- − Repairs & maintenance
- −$7,729
- − Management
- −$7,729
- − Depreciation
- −$28,509
- Taxable loss
- −$13,099
- Est. tax savings @ 24.0%
- +$3,144
- After-tax cash flow
- $6,948/yr
For passive investors: Depreciation is non-cash, so a rental often shows a tax loss while cash-flowing — sheltering income. Rental losses are passive: they offset passive income freely, and up to $25,000/yr can offset ordinary (W-2) income if you actively participate and your MAGI is under $100k (phasing out to $0 by $150k); unused losses carry forward. On sale, claimed depreciation is recaptured at up to 25%, and gains may owe capital-gains tax (a 1031 exchange can defer both). Figures are a year-1 estimate at your 24.0% rate — not tax advice; consult a CPA.
Schools (NCES district)
- District
- Kern High
- NCES district ID
- 0619540
- Math proficiency
- 21% ▬ 0.00%
- Reading proficiency
- 51% ▲ 2.00%
- Median HH income
- $49,686
- Composite
- 33.68/100
- National rank
- #10443
- State rank
- #860 of 1400 in CA
Livability — Bakersfield
- Score
- 58/100
- State rank
- #716
- US rank
- #21355
Category grades
Schools grade is shown separately in the Schools card above.
Census & demographics
- Census place
- Bakersfield, CA
- County
- Kern County · 710,371 people
- City population
- 499,124
- Metro
- Bakersfield, CA
- Population (ZIP)
- 74,116
- Household income
- $69,805
- Rent vs Own
- Severe rent burden
- 2871.0
Population outlook (Kern County) Hauer SSP2
- Today (2025)
- 947,286 people
- By 2030
- 978,984 · +3.3%
- By 2040
- 1,045,018 · +10.3%
- By 2050
- 1,105,232 · +16.7%
- By 2075
- 1,229,538 · +29.8%
- By 2100
- 1,238,059 · +30.7%
Race, ethnicity, and origin ACS 2023
- Neighborhood character
- Predominantly Hispanic (67%)
- Race & ethnicity
- Hispanic / Latino 67% White 23% Two or more races 20% Black 3% Asian 2% Native American 1%
- Hispanic origin (detail)
- Mexican 63%
- Common ancestry
- Italian 2% Slovak 1% Russian 1%
- Foreign-born
- 19% · Canada
- Languages at home
- 50% English-only · Spanish 46% Other Asian/Pacific 1% Arabic 1%
Political lean MEDSL · Kern
- 2024 margin
- Strong R (+21.1) · D 38.2% · R 59.3% · Other 2.5%
- 2008→2024 swing
- -3.3pp toward R · 2008: -17.8pp · 2024: -21.1pp
- All cycles
- 2024: R+21.1 2020: R+10.2 2016: R+15.0 2012: R+20.9 2008: R+17.8
Not yet ingested
- Civics
- —
Market trends
- HPI YoY
- ▼ -323.02%
- Current HPI
- 358.5434
- Rent YoY
- ▲ 2.24%
- Metro
- Bakersfield, CA
- State GDP YoY
- ▲ 3.21%
- F500 in state
- 116
Industry mix (Fortune 500 HQ in CA)
| Industry | F500 HQs | Revenue |
|---|---|---|
| Technology | 27 | $1,492B |
|
||
| Financial Services | 3 | $174B |
|
||
| Retail | 3 | $44B |
|
||
| Insurance | 3 | $26B |
|
||
| Media / Entertainment | 2 | $115B |
|
||
| Pharmaceuticals / Biotech | 2 | $62B |
|
||
Price history
1 event — show timeline
- 2026-06-03 Listed $980,000 GEMLS
Property tax history
+2.9%/yrLatest (2025): $5,949 · +2.0% YoY. Source: county tax records.
Cash-flow waterfall
monthlySold comps — $/sqft
last 12 mo · ≤1 miLoading sold comps…