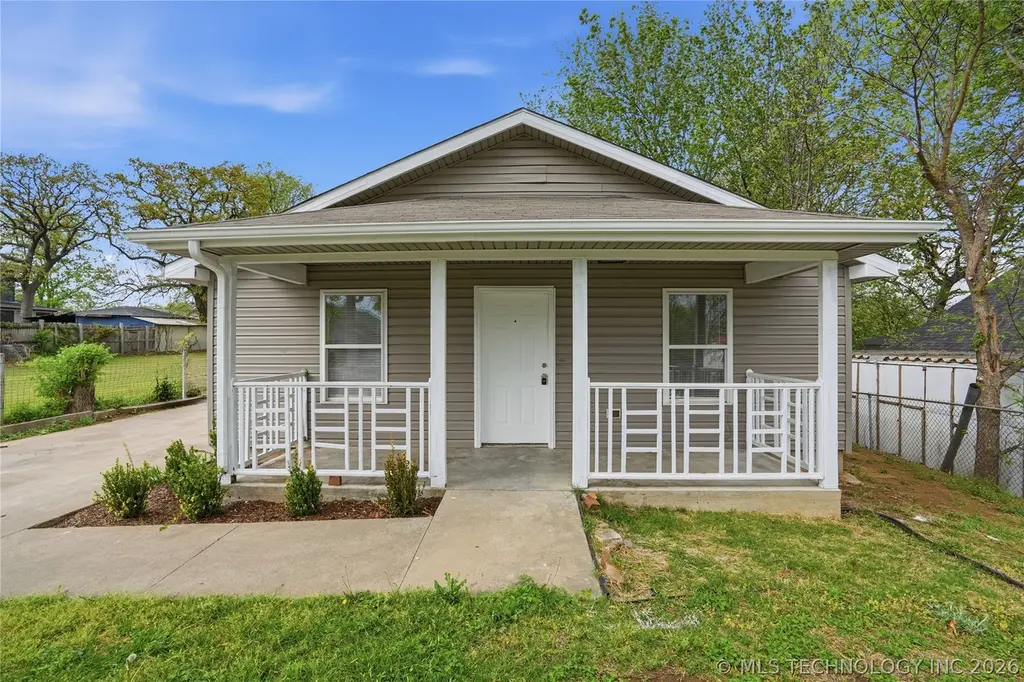
1515 W 1st St · Tulsa, OK
Flood risk 1/10 · Minimal
- FEMA flood zone
- X (unshaded)
- Chance of flooding over 30 yrs
- 0.0%
- Est. flood insurance / yr
- $473 – $860
Fire risk 4/10 · Minor
- Est. fire insurance / yr
- $2,463 – $4,575
Heat risk 6/10 · Moderate
- Hot days now (above 110°F)
- 7 days/yr
- Hot days in 30 yrs
- 18 days/yr
Wind risk 3/10 · Minor
- Chance of severe wind over 30 yrs
- 4.0%
Air-quality risk 2/10 · Minimal
- Unhealthy air days now
- 2 days/yr
- Unhealthy air days in 30 yrs
- 2 days/yr
Risk factors via First Street. Map © Google.
Why this score? — see what drove the D+ grade
The composite is a weighted blend of 9 inputs, each scored 0–100. Each bar is that input's sub-score; the figure is the points it added to the 100-point composite (weight × sub-score).
- Cash flow +23.8/30.0
- DSCR +7.7/10.0
- 1% rule +5.2/10.0
- Livability +3.8/5.0
- Rent growth +3.1/5.0
- Condition / age +2.5/5.0
- Schools +0.8/10.0
- ARV discount +0.0/15.0
- Appreciation +0.0/10.0
$190,000
🖨 Deal sheet 📄 Offer letter ✓ Due diligence
Listing remarks
Well-Maintained & Updated Home with Modern Finishes! This nicely updated home has been well cared for and offers a clean, move-in-ready feel throughout. Featuring luxury vinyl flooring and new carpet, the interior provides a comfortable blend of durability and style. The kitchen includes granite countertops and updated finishes, creating a functional space for everyday living and entertaining. With thoughtful improvements and a well-maintained condition, this home is ready for its next owner to enjoy. Schedule your showing today and come see everything this well-kept home has to offer!
Key facts
- Updated finishes
- Move-in-ready feel
- Granite countertops
Tags
Property features AI
Finance
- HOA & community: Sidewalks; Gutters
Exterior
- Security: Smoke detector(s)
- Utilities: Electricity available; Natural gas available; Public water; Public sewer
- Home design: Single-story home; Faces south; Slab foundation
- Construction: Vinyl siding with wood frame construction; Asphalt/fiberglass roof; Built (year per public records)
- Exterior features: Landscaping; Rain gutters; Covered porch; Shed/storage; Partial fencing; Smoke detectors (no safety shelter)
Interior
- Kitchen: Dishwasher; Oven; Range; Disposal; Plumbed for ice maker; Electric water heater
- Bedrooms: Master bedroom (first level); Bedroom (first level); Bedroom (first level)
- Flooring: Vinyl flooring
- Bathrooms: 1 full bathroom; Hall full bath (first level)
- Heating & cooling: Central heating (gas); Central air conditioning
- Interior features: Aluminum frame windows; Accessible entrance; Granite counters; Electric and gas oven/range connections; Other interior features
- Laundry & utility: Washer hookup; Electric dryer hookup; Gas dryer hookup; Utility room (first level)
Neighborhood map
What this means for you Summary
Snapshot
- This is a 3-bed/1.0-bath single-family listed at $190k.
Deal economics
- At list price, monthly cash flow is $364 ($4k/yr) — positive.
- The deal already cash-flows at list — no discount required.
- Meets the 1% rule at list price ($2k rent vs $190k).
- Recommended offer: $179k (6.0% below list) — sets the bar for market timing.
- Cap rate 8.6% vs local median 3.9% in Tulsa — top-decile yield for the area; either an underpriced asset or a hidden risk that comps aren't pricing in. Stress-test before assuming the spread holds.
Location & tenants
- Location reads 75/100 on livability (#13 in OK, #4,058 nationally) — a middle-class / working-renter tenant base. Strengths: amenities A+, commute A+, cost of living A+; Watch: schools F, crime F, employment D-.
- Tulsa (urban): math 7% / reading 12% proficiency, ranked #250 of 270 in OK (top 93%) — low school quality limits family demand, transient renter base, plan for 1-2y turnover; 76% free/reduced lunch — lower-income household profile, screen leases tightly.
- Market conditions: Rents rising (+2.5%/yr); 113 active listings in the ZIP; 29 comparable units currently listed for rent nearby; rentals leasing fast (median 10d on market — plan ~1-2 weeks tenant-placement turnaround); 2,818 units permitted in Tulsa County in 2024 (518 in 5+ unit buildings).
- At $1,940/mo this rent would consume 50% of the median local household income ($46k/yr) (locally 782% of renters already pay >50% of income on rent) — very limited rent-growth headroom before tenants either downsize or default.
Forward outlook
- Local home prices are declining (-3.0%/yr); year-one equity from $1k of loan paydown is wiped out by about $6k of value loss. Plan a longer hold.
- Tulsa County population projected at +30% by 2050 — long-run rental-demand tailwind backs the buy-and-hold thesis.
Negotiation context
- It's been on market 64 days — a 6% lower offer ($179k) is reasonable based on typical stale-listing flexibility.
- Current owner paid $85k; list at $190k implies a 124% gain — meaningful room to come down on a strong offer.
Risks & watch-outs
- Climate carrying-cost: extreme-heat days projected 7→18/yr by 2055 (HVAC capex compounding) — expect insurance premiums to compound above CPI over the hold.
Questions for the listing agent
- It's been on market 64 days. Have you received any prior offers? Is the seller open to a 6% concession, seller financing, or rate buy-down credit?
- Why hasn't it sold? Are there any deal-killer items the seller is aware of (foundation, flood, title, zoning, code violations)?
- Is there a deadline driving the sale (1031 exchange, divorce, estate, relocation)? That informs how much negotiation room exists.
- Schools are F-rated, which usually means shorter tenancies and higher turnover. Who's the typical renter profile here, and what's been the actual vacancy rate?
- Crime grade is F in this area — have there been break-ins, vandalism, or insurance claims at this property in the last 3 years? What carrier currently insures it and at what premium?
- The area grade is low — what's the realistic commute time and amenity access for the typical tenant pool here? Any planned neighborhood developments (good or bad) we should know about?
- What's the average days-on-market for RENTAL listings here right now (not sales)? A rising rental-DOM trend means longer vacancies and softer asking-rent achievability than the comps imply.
- What's the recent tenant-quality profile in this submarket — average credit score on applications, eviction rate, late-payment / NSF rate, and stable-employment percentage? A property-management company in the area should have these aggregated.
- How much new for-sale + rental construction is in the pipeline within 1–3 miles? Heavy new supply typically softens prices + rents 12–24 months out; constrained supply supports both.
Investment metrics
- 1% rule
- 1.02% ✓
- Cap rate
- 8.59%
- Cash-on-cash
- 8.21%
- DSCR
- 1.37
- GRM
- 8.2
CMA / ARV
- ARV (on-the-fly)
- $159,936
- Comps found
- 12
Show comp detail 12 sales within ~0.75 mi
| Address | Dist | Beds/Ba | Sqft | Sold | Price | $/sf | Match |
|---|---|---|---|---|---|---|---|
| 1815 W Reconciliation Way | 0.39mi | 3/1.0 | 1,144 (-3%) | 4mo | $70,000 | $61 | 74 |
| 1407 W Admiral Blvd | 0.16mi | 2/2.0 (-1) | 1,260 (+7%) | 7mo | $84,000 | $67 | 66 |
| 1812 W Reconciliation Way | 0.37mi | 3/3.0 | 1,264 (+8%) | 1mo | $245,000 | $194 | 62 |
| 1720 W Easton Pl | 0.59mi | 3/1.0 | 1,218 (+4%) | 15mo | $275,000 | $226 | 54 |
| 582 N Xenophon Ave | 0.72mi | 2/1.0 (-1) | 1,130 (-4%) | 2mo | $146,000 | $129 | 53 |
| 148 N Union Ave | 0.29mi | 4/2.0 (+1) | 1,334 (+13%) | 3mo | $73,000 | $55 | 53 |
| 715 S Quanah Ave | 0.38mi | 3/2.0 | 1,024 (-13%) | 8mo | $303,000 | $296 | 51 |
| 1308 W Easton St | 0.45mi | 3/1.0 | 1,295 (+10%) | 16mo | $110,000 | $85 | 49 |
| 127 N Xenophon Ave | 0.38mi | 2/1.0 (-1) | 1,046 (-11%) | 12mo | $142,000 | $136 | 48 |
| 1801 W Easton Ct | 0.63mi | 2/1.5 (-1) | 1,234 (+5%) | 16mo | $180,000 | $146 | 42 |
| 511 N Rosedale Ave | 0.49mi | 2/2.0 (-1) | 1,052 (-10%) | 13mo | $244,000 | $232 | 40 |
| 1906 W Easton Ct | 0.63mi | 4/2.0 (+1) | 1,333 (+13%) | 14mo | $132,500 | $99 | 28 |
Match score weights: distance 35% · size 25% · config 20% · recency 20%. Top-matched comps best support the ARV.
Projected returns pro-forma
-3.0% appreciation · 2.45% rent growth · sell at horizon
- IRR
- -4.4%
- Equity multiple
- 0.84×
- Total profit
- $-8,747
- Equity at exit
- $28,330
- IRR
- 4.6%
- Equity multiple
- 1.33×
- Total profit
- $17,642
- Equity at exit
- $16,428
Cash invested: $53,200 (down + closing). Projections, not guarantees.
Landlord ↔ Tenant lean methodology
- Overall (STATE)
- 83 Strongly Landlord-Friendly
- State Oklahoma
- 83 Strongly Landlord-Friendly · R+20
- County
- — inherits STATE
- City
- — inherits STATE
ZIP-level market 74127
- Home prices YoY
- -20.4%
- Rents YoY
- 2.5%
- Active inventory
- 113
- Price-to-rent
- 8.2×
Monthly cashflow live
- Estimated rent
- $1,940 high interval (Pro) →
- Mortgage (P&I)
- −$996
- Tax from tax record
- −$93 /mo · $1,119/yr
- Insurance
- −$79
- HOA
- −$0
- Vacancy / Maint / Mgmt
- −$407
- Net cashflow
- $364
Break-even live
UW: 25.0% down · 7.5% · 30yr · 1.5% tax · 5.0% vac · 8.0% maint · 8.0% mgmt
Financing live
Cash to close
- Down payment
- $47,500
- Closing costs
- $5,700
- Reserves months
- —
- Total cash needed
- —
Loan-product check · same deal, 3 products live
Conventional
25% down · 7.5% · 30yr
- Down + closing
- —
- Monthly P&I
- —
- Monthly cashflow
- —
- DSCR
- —
- Eligible?
- —
Personal DTI + credit; lowest rate.
DSCR
20% down · 8.5% · 30yr
- Down + closing
- —
- Monthly P&I
- —
- Monthly cashflow
- —
- DSCR
- —
- Eligible?
- —
No personal income docs; deal must DSCR.
Hard money
10% down · 12.0% · 12mo
- Down + closing
- —
- Monthly P&I
- —
- Monthly cashflow
- —
- DSCR
- —
- Eligible?
- —
Short-term bridge; refi at stabilization.
Rent comps 29 comps
| Address | Beds | Baths | Sqft | Rent | $/sqft | DOM | Units | Dist |
|---|---|---|---|---|---|---|---|---|
| 209 N Xenophon Ave Unit B Tulsa, OK | 3.0 | 2.0 | 1150 | $1,500 | $1.30 | 23d | 1 | 0.46mi |
| 1303 S Lawton Ave Tulsa, OK | 2.0 | 2.0 | 1250 | $1,575 | $1.26 | 3d | 1 | 0.73mi |
| 2521 W Cameron St Tulsa, OK | 3.0 | 1.5 | 1161 | $1,295 | $1.12 | 19d | 1 | 0.76mi |
| 1312 S Jackson Ave Unit 3 Tulsa, OK | 2.0 | 1.0 | 775 | $1,050 | $1.35 | 14d | 1 | 0.77mi |
| 2333 W Easton Pl Tulsa, OK | 2.0 | 1.0 | 846 | $700 | $0.83 | 23d | 1 | 0.78mi |
| 1309 S Jackson Ave Tulsa, OK | 2.0 | 1.0 | 775 | $1,050 | $1.35 | 1d | 1 | 0.80mi |
| 424 N Boulder Ave Tulsa, OK | 1.0–3.0 | 1.0–2.5 | 1220 | $3,699 | $3.03 | 1d | 62 | 0.94mi |
| 1703 S Jackson Ave Tulsa, OK | 1.0–2.0 | 1.0–2.0 | 745 | $1,409 | $1.89 | 23d | 28 | 0.94mi |
| 1703 S Jackson Ave Tulsa, OK | 1.0–2.0 | 1.0–2.0 | 745 | $1,375 | $1.84 | 15d | 1 | 0.94mi |
| 403 S Cheyenne Ave Tulsa, OK | 2.0 | 1.0–2.0 | 750 | $1,799 | $2.40 | 1d | 8 | 0.97mi |
| 406 S Boulder Ave Tulsa, OK | 1.0–2.0 | 1.0–2.0 | 1082 | $2,906 | $2.69 | 15d | 3 | 1.01mi |
| 1000 S Denver Ave Tulsa, OK | 1.0–2.0 | 1.0–2.0 | 940 | $1,546 | $1.64 | 1d | 19 | 1.04mi |
| 324 S Main St Tulsa, OK | 1.0–2.0 | 1.0–2.0 | 757 | $1,807 | $2.39 | 1d | 6 | 1.06mi |
| 420 S Main St Tulsa, OK | 2.0 | 1.0–2.0 | 1291 | $2,700 | $2.09 | 1d | 13 | 1.09mi |
| 9 E 4th St Tulsa, OK | 3.0 | 1.0–2.0 | 894 | $2,499 | $2.80 | 1d | 5 | 1.10mi |
| 6 E 5th St Unit 703 Tulsa, OK | 2.0 | 2.0 | 962 | $1,731 | $1.80 | 21d | 1 | 1.14mi |
| 6 E 5th St Tulsa, OK | 1.0–2.0 | 1.0–2.0 | 1103 | $2,500 | $2.27 | 15d | 4 | 1.14mi |
| 6 E 5th St Unit 105 Tulsa, OK | 2.0 | 2.0 | 1361 | $2,450 | $1.80 | 21d | 1 | 1.14mi |
| 1401 S Elwood Ave Tulsa, OK | 3.0 | 1.0 | 1373 | $1,850 | $1.35 | 23d | 1 | 1.15mi |
| 7125 N 220th RD Tulsa, OK | 2.0 | 1.0–2.0 | 750 | $2,800 | $3.73 | 10d | 37 | 1.21mi |
| 310 E 1st St Tulsa, OK | 1.0–2.0 | 1.0–2.0 | 1226 | $2,870 | $2.34 | 1d | 4 | 1.27mi |
| 310 E 1st St Tulsa, OK | 1.0–2.0 | 1.0–2.0 | 1110 | $2,870 | $2.58 | 19d | 5 | 1.27mi |
| 415 E 2nd St S Tulsa, OK | 1.0–2.0 | 1.0–2.0 | 807 | $2,180 | $2.70 | 1d | 28 | 1.33mi |
| 420 E Archer St Tulsa, OK | 1.0–2.0 | 1.0–2.5 | 1159 | $3,646 | $3.15 | 1d | 30 | 1.35mi |
| 1515 S Carson Ave Tulsa, OK | 2.0 | 1.5 | 1100 | $2,200 | $2.00 | 23d | 1 | 1.36mi |
| 401 S Elgin Ave Tulsa, OK | 1.0–2.0 | 1.0–2.0 | 770 | $1,499 | $1.95 | 23d | 3 | 1.37mi |
| 505 E 2nd St S Tulsa, OK | 2.0 | 2.0 | 1087 | $2,180 | $2.01 | 2d | 1 | 1.42mi |
| 1717 Riverside Dr Tulsa, OK | 2.0 | 1.0–2.0 | 910 | $2,201 | $2.42 | 1d | 22 | 1.43mi |
| 211 S Greenwood Ave Tulsa, OK | 1.0–2.0 | 1.0–2.0 | 933 | $2,344 | $2.51 | 1d | 3 | 1.49mi |
Listing history 18 events
-
2026-06-19price $190,000 Active 64 DOM
-
2026-06-18days on market $195,000 Active 64 DOM
-
2026-06-17days on market $195,000 Active 63 DOM
-
2026-06-16days on market $195,000 Active 62 DOM
-
2026-06-15days on market $195,000 Active 61 DOM
-
2026-06-13days on market $195,000 Active 59 DOM
-
2026-06-10days on market $195,000 Active 56 DOM
-
2026-06-09days on market $195,000 Active 55 DOM
-
2026-06-08days on market $195,000 Active 54 DOM
-
2026-06-07days on market $195,000 Active 53 DOM
-
2026-06-05days on market $195,000 Active 50 DOM
-
2026-06-03days on market $195,000 Active 49 DOM
-
2026-06-02days on market $195,000 Active 48 DOM
-
2026-06-01days on market $195,000 Active 47 DOM
-
2026-05-31days on market $195,000 Active 46 DOM
-
2026-05-04price $195,000
-
2026-04-15$200,000 Active
-
2025-12-05soldstatus $85,000
ⓘ Source: listings_history table (triggers on properties + properties_extension) + one-shot
backfill from property_details.listing_events for pre-trigger history.
Tax reassessment forecast OK · Resets to sale price
- Current annual tax
- $1,119 · $93/mo
- Projected year-2 tax
- $1,710 · $142/mo
- Expected delta
- +$591/yr (+$49/mo · 52.8%)
ⓘ Screening estimate from a state-policy table — verify with the county assessor before closing.
Climate risk First Street
- Flood 1/10 Low FEMA zone X (unshaded) · 0% chance over 30 yrs
- Wildfire 4/10 Moderate
- Heat 6/10 Major 7 d/yr ≥110°F today · 18 d/yr by 30 yrs out
- Wind 3/10 Moderate 4% chance of damaging wind over 30 yrs
- Air quality 2/10 Low 2 unhealthy d/yr today · 2 by 30 yrs out
Nearby sold comps map
Loading sold comps map…
Walkable amenities ~0.75 mi
Loading nearby amenities…
Taxation est. · year 1
- Rental income
- $23,279
- − Mortgage interest
- −$10,643
- − Property taxes
- −$1,119
- − Insurance
- −$950
- − Repairs & maintenance
- −$1,862
- − Management
- −$1,862
- − Depreciation
- −$5,527
- Taxable income
- $1,315
- Est. tax owed @ 24.0%
- −$316
- After-tax cash flow
- $4,049/yr
For passive investors: Depreciation is non-cash, so a rental often shows a tax loss while cash-flowing — sheltering income. Rental losses are passive: they offset passive income freely, and up to $25,000/yr can offset ordinary (W-2) income if you actively participate and your MAGI is under $100k (phasing out to $0 by $150k); unused losses carry forward. On sale, claimed depreciation is recaptured at up to 25%, and gains may owe capital-gains tax (a 1031 exchange can defer both). Figures are a year-1 estimate at your 24.0% rate — not tax advice; consult a CPA.
Schools (NCES district)
- District
- Tulsa
- NCES district ID
- 4030240
- Math proficiency
- 7% ▼ -9.00%
- Reading proficiency
- 12% ▼ -7.00%
- Median HH income
- $37,895
- Composite
- 8.04/100
- National rank
- #9919
- State rank
- #250 of 270 in OK
Livability — Tulsa
- Score
- 75/100
- State rank
- #13
- US rank
- #4058
Category grades
Schools grade is shown separately in the Schools card above.
Census & demographics
- Census place
- Tulsa, OK
- County
- Osage County · 26,244 people
- City population
- 389,418
- Metro
- Tulsa, OK
- Population (ZIP)
- 16,324
- Household income
- $46,373
- Rent vs Own
- Severe rent burden
- 782.0
Population outlook (Tulsa County) Hauer SSP2
- Today (2025)
- 723,846 people
- By 2030
- 766,033 · +5.8%
- By 2040
- 851,386 · +17.6%
- By 2050
- 938,389 · +29.6%
- By 2075
- 1,166,011 · +61.1%
- By 2100
- 1,350,277 · +86.5%
Race, ethnicity, and origin ACS 2023
- Neighborhood character
- Diverse neighborhood (Simpson 0.66)
- Race & ethnicity
- White 50% Black 28% Two or more races 10% Hispanic / Latino 7% Native American 7%
- Hispanic origin (detail)
- Mexican 5%
- Common ancestry
- Slovak 2% Italian 1% Iranian 1%
- Foreign-born
- 4% · Canada, Jamaica
- Languages at home
- 94% English-only · Spanish 4%
Political lean MEDSL · Tulsa
- 2024 margin
- R (+15.2) · D 41.3% · R 56.5% · Other 2.2%
- 2008→2024 swing
- +9.2pp toward D · 2008: -24.5pp · 2024: -15.2pp
- All cycles
- 2024: R+15.2 2020: R+15.6 2016: R+22.9 2012: R+27.4 2008: R+24.5
Not yet ingested
- Civics
- —
Market trends
- HPI YoY
- ▼ -59.31%
- Current HPI
- 231.5994
- Rent YoY
- ▲ 2.45%
- Metro
- Tulsa, OK
- State GDP YoY
- ▲ 1.55%
- F500 in state
- 6
Industry mix (Fortune 500 HQ in OK)
| Industry | F500 HQs | Revenue |
|---|---|---|
| Energy | 3 | $48B |
|
||
Price history
+129.4% since first listed3 events — show timeline
- 2026-05-04 Price Changed $195,000 MLS Technology, Inc.
- 2026-04-15 Listed $200,000 MLS Technology, Inc.
- 2025-12-05 Sold (Public Records) $85,000 Public Records
Property tax history
-0.4%/yrLatest (2025): $1,119 · +7.0% YoY. Source: county tax records.
Cash-flow waterfall
monthlySold comps — $/sqft
last 12 mo · ≤1 miLoading sold comps…