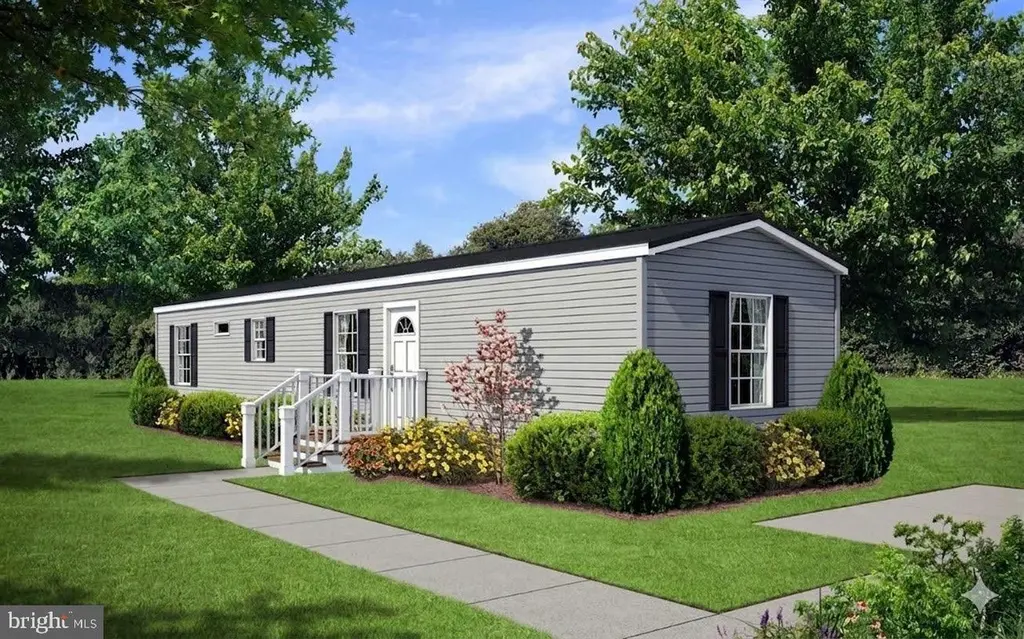
200 W Burkholder Dr Lot 12 · Clay, PA
Flood risk 1/10 · Minimal
- FEMA flood zone
- X (unshaded)
- Chance of flooding over 30 yrs
- 0.0%
- Est. flood insurance / yr
- $507 – $1,088
Fire risk 1/10 · Minimal
- Est. fire insurance / yr
- $511 – $949
Heat risk 5/10 · Moderate
- Hot days now (above 100°F)
- 7 days/yr
- Hot days in 30 yrs
- 14 days/yr
Wind risk 4/10 · Minor
- Chance of severe wind over 30 yrs
- 22.0%
Air-quality risk 4/10 · Minor
- Unhealthy air days now
- 6 days/yr
- Unhealthy air days in 30 yrs
- 7 days/yr
Risk factors via First Street. Map © Google.
Why this score? — see what drove the B grade
The composite is a weighted blend of 9 inputs, each scored 0–100. Each bar is that input's sub-score; the figure is the points it added to the 100-point composite (weight × sub-score).
- Cash flow +30.0/30.0
- 1% rule +10.0/10.0
- DSCR +10.0/10.0
- ARV discount +7.5/15.0
- Schools +4.3/10.0
- Livability +3.2/5.0
- Rent growth +2.5/5.0
- Condition / age +2.5/5.0
- Appreciation +0.0/10.0
$89,900
🖨 Deal sheet 📄 Offer letter ✓ Due diligence
Listing remarks
🏡 BRAND NEW SUPERIOR HOMES SPEC HOME – ORDER TODAY! 🏡 Lititz PA Manufactured Home Community next to beautiful farm land and scenic views! Step inside to a bright and inviting living area that flows seamlessly into the spacious kitchen featuring brand-new appliances, ample cabinetry, and plenty of counter space. The well-designed floor plan offers comfortable bedrooms, a full bath, and energy-efficient construction for peace of mind and affordable living. Enjoy the benefits of brand-new construction along with manufacturer warranties. Monthly lot rent is $450 and includes water, sewer, trash, and snow removal. Drive by and check out this beautiful homesite to see if this could be the p
Key facts
- Brand new appliances
- Scenic views
- 2 parking spots
Tags
Property features AI
Finance
- Other: Property manager present; Irrigation water rights noted; Annual ground rent listed under income/expense
- Financial info: Ownership interest listed as ground rent
- HOA & community: Community fees include water, trash, and snow removal; Ground rent exists ($450 monthly)
Exterior
- Parking: Driveway parking (2 spaces); Total of 2 garage/parking spaces
- Utilities: 100 amp electric service; Propane available; On-site septic; Private/community water; Electric hot water
- Home design: Manufactured home; Single wide (14' x 52'); Champion make; Construction completed; excellent condition
- Construction: Aluminum siding; Architectural shingle roof; Estimated year built
- Exterior features: Above-grade and below-grade structures noted; Not in a federal flood zone; 2+ access exits
Interior
- Kitchen: Refrigerator; Stove
- Bedrooms: 2 bedrooms on the main level
- Bathrooms: 1 full bathroom on the main level
- Heating & cooling: Propane heating (leased and/or owned options noted); Electric hot water
- Interior features: Open floor plan; Tub with shower
- Laundry & utility: Main-floor laundry area with hookups
Neighborhood map
What this means for you Summary
Snapshot
- This is a 2-bed/1.0-bath manufactured listed at $90k.
Deal economics
- At list price, monthly cash flow is $706 ($8k/yr) — positive.
- The deal already cash-flows at list — no discount required.
- Meets the 1% rule at list price ($2k rent vs $90k).
- Recommended offer: $87k (3.0% below list) — sets the bar for market timing.
- Cap rate 15.7% vs local median 0.8% in Clay — top-decile yield for the area; either an underpriced asset or a hidden risk that comps aren't pricing in. Stress-test before assuming the spread holds.
Location & tenants
- Location reads 65/100 on livability (#1,137 in PA) — a middle-class / working-renter tenant base. Strengths: crime A+, cost of living A+, housing A+; Watch: schools F, amenities F, commute F.
- Ephrata Area SD (suburban): math 43% / reading 57% proficiency, ranked #173 of 539 in PA (top 32%) — acceptable for families but not a draw, mixed tenant base, ~2y average lease.
- Market conditions: 214 active listings in the ZIP; solid renter incomes; 1,093 units permitted in Lancaster County in 2024 (201 in 5+ unit buildings).
Forward outlook
- Local home prices are declining (-3.0%/yr); year-one equity from $622 of loan paydown is wiped out by about $3k of value loss. Plan a longer hold.
- Lancaster County population projected at +5% by 2050 — modest demand growth; plan on rents tracking national, not racing it.
- At projected returns (-3.0% appreciation + 3.0% rent growth), your $25k cash investment doubles in ~4 years — after that, you're playing with house money.
Negotiation context
- It's been on market 42 days — a 3% lower offer ($87k) is reasonable based on typical stale-listing flexibility.
Risks & watch-outs
- Climate carrying-cost: extreme-heat days projected 7→14/yr by 2055 (HVAC capex compounding) — expect insurance premiums to compound above CPI over the hold.
Questions for the listing agent
- It's been on market 42 days. Have you received any prior offers? Is the seller open to a 3% concession, seller financing, or rate buy-down credit?
- Is there a deadline driving the sale (1031 exchange, divorce, estate, relocation)? That informs how much negotiation room exists.
- Schools are F-rated, which usually means shorter tenancies and higher turnover. Who's the typical renter profile here, and what's been the actual vacancy rate?
- What's the average days-on-market for RENTAL listings here right now (not sales)? A rising rental-DOM trend means longer vacancies and softer asking-rent achievability than the comps imply.
- What's the recent tenant-quality profile in this submarket — average credit score on applications, eviction rate, late-payment / NSF rate, and stable-employment percentage? A property-management company in the area should have these aggregated.
- How much new for-sale + rental construction is in the pipeline within 1–3 miles? Heavy new supply typically softens prices + rents 12–24 months out; constrained supply supports both.
Investment metrics
- 1% rule
- 1.87% ✓
- Cap rate
- 15.72%
- Cash-on-cash
- 33.66%
- DSCR
- 2.50
- GRM
- 4.5
CMA / ARV
- ARV (median comp)
- $52,241
- List price
- $89,900
- Delta
- 72.09%
- Verdict
- OVERPRICED
- Comps
- 7 within 2.0 mi
Projected returns pro-forma
-3.0% appreciation · 3.0% rent growth · sell at horizon
- IRR
- 29.0%
- Equity multiple
- 2.21×
- Total profit
- $30,423
- Equity at exit
- $13,404
- IRR
- 36.3%
- Equity multiple
- 4.36×
- Total profit
- $84,494
- Equity at exit
- $7,773
Cash invested: $25,172 (down + closing). Projections, not guarantees.
Landlord ↔ Tenant lean methodology
- Overall (STATE)
- 62 Landlord-Friendly
- State Pennsylvania
- 62 Landlord-Friendly · EVEN
- County
- — inherits STATE
- City
- — inherits STATE
ZIP-level market 17543
- Active inventory
- 214
- Price-to-rent
- 4.5×
Monthly cashflow live
- Estimated rent
- $1,680 medium interval (Pro) →
- Mortgage (P&I)
- −$471
- Tax est. 1.5%
- −$112 /mo · $1,348/yr
- Insurance
- −$37
- HOA
- −$0
- Vacancy / Maint / Mgmt
- −$353
- Net cashflow
- $706
Break-even live
UW: 25.0% down · 7.5% · 30yr · 1.5% tax · 5.0% vac · 8.0% maint · 8.0% mgmt
Financing live
Cash to close
- Down payment
- $22,475
- Closing costs
- $2,697
- Reserves months
- —
- Total cash needed
- —
Loan-product check · same deal, 3 products live
Conventional
25% down · 7.5% · 30yr
- Down + closing
- —
- Monthly P&I
- —
- Monthly cashflow
- —
- DSCR
- —
- Eligible?
- —
Personal DTI + credit; lowest rate.
DSCR
20% down · 8.5% · 30yr
- Down + closing
- —
- Monthly P&I
- —
- Monthly cashflow
- —
- DSCR
- —
- Eligible?
- —
No personal income docs; deal must DSCR.
Hard money
10% down · 12.0% · 12mo
- Down + closing
- —
- Monthly P&I
- —
- Monthly cashflow
- —
- DSCR
- —
- Eligible?
- —
Short-term bridge; refi at stabilization.
Listing history 16 events
-
2026-06-18days on market $89,900 Active 42 DOM
-
2026-06-17days on market $89,900 Active 41 DOM
-
2026-06-16days on market $89,900 Active 40 DOM
-
2026-06-15days on market $89,900 Active 39 DOM
-
2026-06-14days on market $89,900 Active 37 DOM
-
2026-06-10days on market $89,900 Active 34 DOM
-
2026-06-09days on market $89,900 Active 33 DOM
-
2026-06-08days on market $89,900 Active 32 DOM
-
2026-06-07days on market $89,900 Active 31 DOM
-
2026-06-03days on market $89,900 Active 27 DOM
-
2026-06-02days on market $89,900 Active 26 DOM
-
2026-06-01days on market $89,900 Active 25 DOM
-
2026-05-31days on market $89,900 Active 24 DOM
-
2026-05-30days on market $89,900 Active 23 DOM
-
2026-05-08price $89,900 1092-char remark
-
2026-05-07$84,900 Active 1092-char remark
ⓘ Source: listings_history table (triggers on properties + properties_extension) + one-shot
backfill from property_details.listing_events for pre-trigger history.
Climate risk First Street
- Flood 1/10 Low FEMA zone X (unshaded) · 0% chance over 30 yrs
- Wildfire 1/10 Low
- Heat 5/10 Major 7 d/yr ≥100°F today · 14 d/yr by 30 yrs out
- Wind 4/10 Moderate 22% chance of damaging wind over 30 yrs
- Air quality 4/10 Moderate 6 unhealthy d/yr today · 7 by 30 yrs out
Nearby sold comps map
Loading sold comps map…
Walkable amenities ~0.75 mi
Loading nearby amenities…
Taxation est. · year 1
- Rental income
- $20,161
- − Mortgage interest
- −$5,036
- − Property taxes
- −$1,348
- − Insurance
- −$450
- − Repairs & maintenance
- −$1,613
- − Management
- −$1,613
- − Depreciation
- −$2,615
- Taxable income
- $7,486
- Est. tax owed @ 24.0%
- −$1,797
- After-tax cash flow
- $6,675/yr
For passive investors: Depreciation is non-cash, so a rental often shows a tax loss while cash-flowing — sheltering income. Rental losses are passive: they offset passive income freely, and up to $25,000/yr can offset ordinary (W-2) income if you actively participate and your MAGI is under $100k (phasing out to $0 by $150k); unused losses carry forward. On sale, claimed depreciation is recaptured at up to 25%, and gains may owe capital-gains tax (a 1031 exchange can defer both). Figures are a year-1 estimate at your 24.0% rate — not tax advice; consult a CPA.
Schools (NCES district)
- District
- Ephrata Area SD
- NCES district ID
- 4209270
- Math proficiency
- 43% ▼ -10.00%
- Reading proficiency
- 57% ▼ -9.00%
- Median HH income
- $54,320
- Composite
- 43.14/100
- National rank
- #3078
- State rank
- #173 of 539 in PA
Livability — Clay
- Score
- 65/100
- State rank
- #1137
- US rank
- #13048
Category grades
Schools grade is shown separately in the Schools card above.
Census & demographics
- County
- Lancaster County · 390,309 people
- Metro
- Lancaster, PA
- Population (ZIP)
- 45,912
- Household income
- $97,435
- Rent vs Own
- Severe rent burden
- 1164.0
Population outlook (Lancaster County) Hauer SSP2
- Today (2025)
- 561,011 people
- By 2030
- 570,969 · +1.8%
- By 2040
- 585,929 · +4.4%
- By 2050
- 591,056 · +5.4%
- By 2075
- 594,747 · +6.0%
- By 2100
- 558,850 · -0.4%
Race, ethnicity, and origin ACS 2023
- Neighborhood character
- Predominantly White (86%)
- Race & ethnicity
- White 86% Hispanic / Latino 6% Two or more races 5% Asian 3% Black 2%
- Hispanic origin (detail)
- Mexican 1% Puerto Rican 3%
- Common ancestry
- Romanian 3% Lithuanian 2% Italian 2%
- Foreign-born
- 4% · Canada, India, Vietnam
- Languages at home
- 92% English-only · Spanish 3% German/W. Germanic 2% Other Indo-European 1%
Political lean MEDSL · Lancaster
- 2024 margin
- R (+15.9) · D 41.5% · R 57.5%
- 2008→2024 swing
- -4.1pp toward R · 2008: -11.8pp · 2024: -15.9pp
- All cycles
- 2024: R+15.9 2020: R+15.8 2016: R+19.7 2012: R+19.2 2008: R+11.8
Not yet ingested
- Civics
- —
Market trends
- HPI YoY
- ▼ -283.22%
- Current HPI
- 265.3653
- Rent YoY
- —
- Metro
- Lancaster, PA
- State GDP YoY
- ▲ 1.68%
- F500 in state
- 34
Industry mix (Fortune 500 HQ in PA)
| Industry | F500 HQs | Revenue |
|---|---|---|
| Healthcare | 2 | $309B |
|
||
| Insurance | 2 | $27B |
|
||
| Telecommunications / Media | 1 | $124B |
|
||
| Industrial Distribution | 1 | $22B |
|
||
| Financial Services | 1 | $20B |
|
||
| Chemicals / Materials | 1 | $18B |
|
||
Price history
+5.9% since first listed2 events — show timeline
- 2026-05-08 Price Changed $89,900 BRIGHT MLS
- 2026-05-07 Listed $84,900 BRIGHT MLS
Property tax history
-1.6%/yrLatest (2026): $85 · +3.9% YoY. Source: county tax records.
Cash-flow waterfall
monthlySold comps — $/sqft
last 12 mo · ≤1 miLoading sold comps…