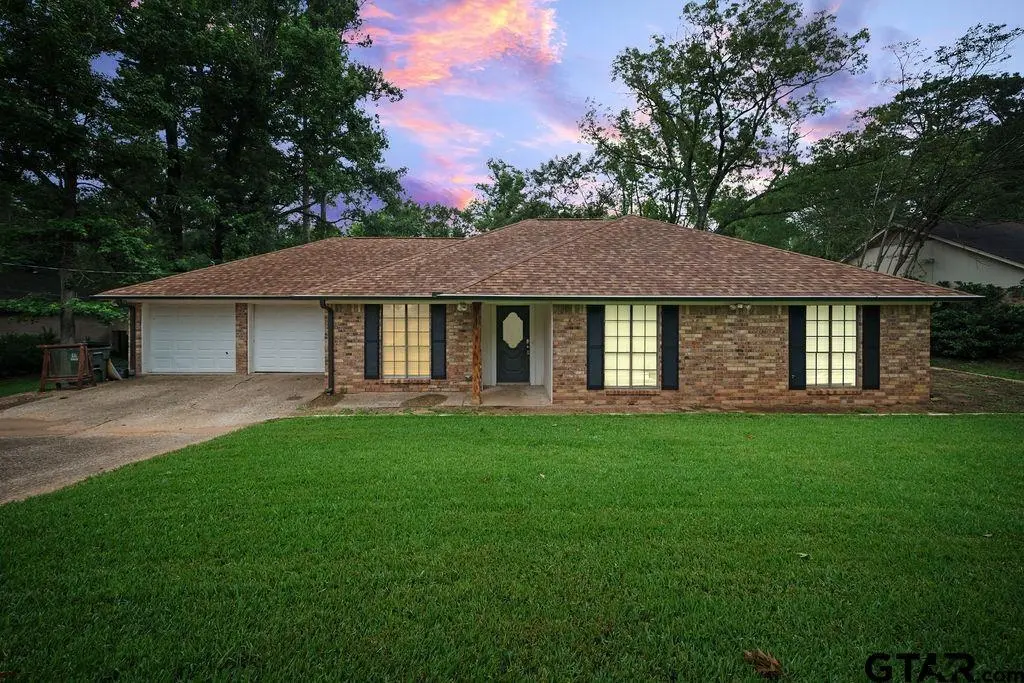
15060 Willowwood Dr · Tyler, TX
Flood risk 1/10 · Minimal
- FEMA flood zone
- X (unshaded)
- Chance of flooding over 30 yrs
- 0.0%
- Est. flood insurance / yr
- $507 – $1,088
Fire risk 4/10 · Minor
- Est. fire insurance / yr
- $1,222 – $2,270
Heat risk 6/10 · Moderate
- Hot days now (above 109°F)
- 7 days/yr
- Hot days in 30 yrs
- 24 days/yr
Wind risk 6/10 · Moderate
- Chance of severe wind over 30 yrs
- 66.0%
Air-quality risk 2/10 · Minimal
- Unhealthy air days now
- 0 days/yr
- Unhealthy air days in 30 yrs
- 1 days/yr
Risk factors via First Street. Map © Google.
Why this score? — see what drove the D+ grade
The composite is a weighted blend of 9 inputs, each scored 0–100. Each bar is that input's sub-score; the figure is the points it added to the 100-point composite (weight × sub-score).
- ARV discount +15.0/15.0
- Cash flow +14.3/30.0
- DSCR +4.4/10.0
- 1% rule +3.9/10.0
- Livability +3.8/5.0
- Schools +3.3/10.0
- Condition / age +2.5/5.0
- Rent growth +2.0/5.0
- Appreciation +0.0/10.0
$299,000
🖨 Deal sheet (PDF) 📄 Offer letter ✓ Due diligence
Listing remarks MLS
Home to be sold as is
Key facts
- 0.36 acre lot
- 2 garage spots
- Built 1983
Tags
Property features AI
Exterior
- Parking: 2-car garage; Concrete parking
- Home design: Single-family detached residence; Single story
- Construction: Brick veneer construction; Composition roof
- Exterior features: Covered patio/porch; Wood fencing; Storage structure
Interior
- Kitchen: Dishwasher; Electric oven; Electric range; Microwave; Garbage disposal
- Bathrooms: 2 full bathrooms
- Heating & cooling: Central heating (Natural Gas); Central air; Ceiling fan(s)
- Interior features: Walk-in closet(s); Wood-burning fireplace (1)
Neighborhood map
What this means for you Summary
Snapshot
- This is a 3-bed/2.0-bath single-family listed at $299k.
Deal economics
- At list price, monthly cash flow is $56 ($676/yr) — positive.
- The deal already cash-flows at list — no discount required.
- To meet the 1% rule (rent ≥ 1% of price), the offer needs to be $265k (11.5% below list).
- Recommended offer: $265k (11.5% below list) — sets the bar for 1% rule.
- Cap rate 6.5% vs local median 3.5% in Tyler — top-decile yield for the area; either an underpriced asset or a hidden risk that comps aren't pricing in. Stress-test before assuming the spread holds.
Location & tenants
- Location reads 75/100 on livability (#147 in TX, #4,181 nationally) — a middle-class / working-renter tenant base. Strengths: cost of living A+, housing A+, health & safety A+; Watch: employment C-, crime D+, commute F.
- Tyler ISD (urban): math 39% / reading 38% proficiency, ranked #449 of 826 in TX (top 54%) — families likely to look elsewhere, expect single-tenant / working-renter base with shorter leases; 66% free/reduced lunch — lower-income household profile, screen leases tightly.
- Zoned schools: Dr Bryan C Jack El (math 53% / reading 51%, grade C-, #742 of 4,322 statewide, top 19%, 685 students, 46% FRL); Three Lakes Middle (math 35% / reading 42%, grade F, #704 of 1,662 statewide, top 43%, 873 students, 64% FRL); Tyler Legacy H S (math 34% / reading 49%, grade F, #767 of 1,632 statewide, top 47%, 2,594 students, 58% FRL).
- Market conditions: Rents soft (-1.9%/yr); 655 active listings in the ZIP; 7 comparable units currently listed for rent nearby; rentals lingering (median 46d on market — plan ~5-8 weeks vacancy on turnover, expect pricing pressure); 57% of comp listings sitting > 30 days — soft ceiling on asking rent; solid renter incomes; 595 units permitted in Smith County in 2024 (45 in 5+ unit buildings).
- This rent runs 40% of the median local income ($79k/yr) — at the standard rent-burdened threshold; future hikes will face affordability resistance.
Forward outlook
- Local home prices are declining (-3.0%/yr); year-one equity from $2k of loan paydown is wiped out by about $9k of value loss. Plan a longer hold.
- Smith County population projected at +24% by 2050 — long-run rental-demand tailwind backs the buy-and-hold thesis.
Negotiation context
- Only 13 days on market — expect competitive offers; lowballing is unlikely to land.
- 5 sale attempts since 12y ago with the ask held roughly flat each time — persistent listings suggest the price (not the market) is what's stuck; bring a comps-based counter.
Risks & watch-outs
- Climate carrying-cost: major wind risk, 66% chance of damaging wind over 30y; extreme-heat days projected 7→24/yr by 2055 (HVAC capex compounding) — expect insurance premiums to compound above CPI over the hold.
Questions for the listing agent
- Is there a deadline driving the sale (1031 exchange, divorce, estate, relocation)? That informs how much negotiation room exists.
- Schools are D-rated, which usually means shorter tenancies and higher turnover. Who's the typical renter profile here, and what's been the actual vacancy rate?
- Crime grade is D in this area — have there been break-ins, vandalism, or insurance claims at this property in the last 3 years? What carrier currently insures it and at what premium?
- The area grade is low — what's the realistic commute time and amenity access for the typical tenant pool here? Any planned neighborhood developments (good or bad) we should know about?
- What's the average days-on-market for RENTAL listings here right now (not sales)? A rising rental-DOM trend means longer vacancies and softer asking-rent achievability than the comps imply.
- What's the recent tenant-quality profile in this submarket — average credit score on applications, eviction rate, late-payment / NSF rate, and stable-employment percentage? A property-management company in the area should have these aggregated.
- How much new for-sale + rental construction is in the pipeline within 1–3 miles? Heavy new supply typically softens prices + rents 12–24 months out; constrained supply supports both.
Investment metrics
- 1% rule
- 0.89% ✗
- Cap rate
- 6.52%
- Cash-on-cash
- 0.81%
- DSCR
- 1.04
- GRM
- 9.4
CMA / ARV
- ARV (on-the-fly)
- $381,888
- Comps found
- 2
Show comp detail 2 sales within ~0.75 mi
| Address | Dist | Beds/Ba | Sqft | Sold | Price | $/sf | Match |
|---|---|---|---|---|---|---|---|
| 7276 Carthage Crk | 0.72mi | 3/2.0 | 1,947 (+10%) | 2mo | $419,900 | $216 | 48 |
| 7294 Carthage Crk | 0.75mi | 3/2.0 | 1,954 (+10%) | 16mo | $400,000 | $205 | 35 |
Match score weights: distance 35% · size 25% · config 20% · recency 20%. Top-matched comps best support the ARV.
Projected returns pro-forma
-3.0% appreciation · 0.0% rent growth · sell at horizon
- IRR
- -18.4%
- Equity multiple
- 0.37×
- Total profit
- $-52,598
- Equity at exit
- $44,582
- IRR
- -18.0%
- Equity multiple
- 0.15×
- Total profit
- $-71,075
- Equity at exit
- $25,852
Cash invested: $83,720 (down + closing). Projections, not guarantees.
Landlord ↔ Tenant lean methodology
- Overall (STATE)
- 87 Strongly Landlord-Friendly
- State Texas
- 87 Strongly Landlord-Friendly · R+5
- County
- — inherits STATE
- City
- — inherits STATE
ZIP-level market 75703
- Rents YoY
- -1.9%
- Active inventory
- 655
- Price-to-rent
- 9.4×
Monthly cashflow live
- Estimated rent
- $2,647 high interval (Pro) →
- Mortgage (P&I)
- −$1,568
- Tax from tax record
- −$342 /mo · $4,106/yr
- Insurance
- −$125
- HOA
- −$0
- Vacancy / Maint / Mgmt
- −$556
- Net cashflow
- $56
Break-even live
Sensitivity live
| Price | -10% $226 | -5% $141 | +0% $56 | +5% $-28 | +10% $-113 |
|---|---|---|---|---|---|
| Rent | -10% $-153 | -5% $-48 | +0% $56 | +5% $161 | +10% $265 |
| Rate | -1.0pp $207 | -0.5pp $132 | base $56 | +0.5pp $-21 | +1.0pp $-100 |
UW: 25.0% down · 7.5% · 30yr · 1.5% tax · 5.0% vac · 8.0% maint · 8.0% mgmt
Financing live
Cash to close
- Down payment
- $74,750
- Closing costs
- $8,970
- Reserves months
- —
- Total cash needed
- —
Loan-product check · same deal, 3 products live
Conventional
25% down · 7.5% · 30yr
- Down + closing
- —
- Monthly P&I
- —
- Monthly cashflow
- —
- DSCR
- —
- Eligible?
- —
Personal DTI + credit; lowest rate.
DSCR
20% down · 8.5% · 30yr
- Down + closing
- —
- Monthly P&I
- —
- Monthly cashflow
- —
- DSCR
- —
- Eligible?
- —
No personal income docs; deal must DSCR.
Hard money
10% down · 12.0% · 12mo
- Down + closing
- —
- Monthly P&I
- —
- Monthly cashflow
- —
- DSCR
- —
- Eligible?
- —
Short-term bridge; refi at stabilization.
Rent comps 7 comps
| Address | Beds | Baths | Sqft | Rent | $/sqft | DOM | Units | Dist |
|---|---|---|---|---|---|---|---|---|
| 10801 Harvestwood Dr Tyler, TX | 4.0 | 2.5 | 1964 | $3,750 | $1.91 | 15d | 1 | 0.28mi |
| 1811 Spruce Pine Ln Tyler, TX | 3.0 | 2.0 | 1662 | $2,500 | $1.50 | 45d | 1 | 0.99mi |
| 15542 County Road 178 Unit I209 Tyler, TX | 3.0 | 2.0 | 1450 | $1,900 | $1.31 | 45d | 1 | 1.00mi |
| 7352 Kingsport Ln Tyler, TX | 3.0 | 2.0 | 1875 | $4,500 | $2.40 | 15d | 1 | 1.09mi |
| 16108 Echo Glen Dr Tyler, TX | 3.0 | 2.0 | 1225 | $1,795 | $1.47 | 45d | 1 | 1.16mi |
| 11201 County Road 166 Tyler, TX | 3.0 | 2.0 | 1635 | $2,595 | $1.59 | 45d | 1 | 1.29mi |
| 2830 W Grande Blvd Tyler, TX | 1.0–3.0 | 1.0–2.0 | 1170 | $2,370 | $2.03 | 15d | 30 | 1.35mi |
Listing history 13 events
-
2026-06-22days on market $299,000 Active 13 DOM
-
2026-06-19days on market $299,000 Active 11 DOM
-
2026-06-18days on market $299,000 Active 10 DOM
-
2026-06-17days on market $299,000 Active 9 DOM
-
2026-06-16days on market $299,000 Active 8 DOM
-
2026-06-15days on market $299,000 Active 7 DOM
-
2026-06-14days on market $299,000 Active 5 DOM
-
2026-06-13days on market $299,000 Active 4 DOM
-
2026-06-10days on market $299,000 Active 2 DOM
-
2026-06-09days on market $299,000 Active 1 DOM
-
2026-06-08days on market $299,000 Active 3 DOM
-
2026-06-07remarks 699-char remark
-
2026-06-07$299,000 Active 2 DOM
ⓘ Source: listings_history table (triggers on properties + properties_extension) + one-shot
backfill from property_details.listing_events for pre-trigger history.
Tax reassessment forecast TX · Resets to sale price
- Current annual tax
- $4,106 · $342/mo
- Projected year-2 tax
- $5,472 · $456/mo
- Expected delta
- +$1,366/yr (+$114/mo · 33.3%)
ⓘ Screening estimate from a state-policy table — verify with the county assessor before closing.
Climate risk First Street
- Flood 1/10 Low FEMA zone X (unshaded) · 0% chance over 30 yrs
- Wildfire 4/10 Moderate
- Heat 6/10 Major 7 d/yr ≥109°F today · 24 d/yr by 30 yrs out
- Wind 6/10 Major 66% chance of damaging wind over 30 yrs
- Air quality 2/10 Low 0 unhealthy d/yr today · 1 by 30 yrs out
Nearby sold comps map
Loading sold comps map…
Walkable amenities ~0.75 mi
Loading nearby amenities…
Taxation est. · year 1
- Rental income
- $31,763
- − Mortgage interest
- −$16,749
- − Property taxes
- −$4,106
- − Insurance
- −$1,495
- − Repairs & maintenance
- −$2,541
- − Management
- −$2,541
- − Depreciation
- −$8,698
- Taxable loss
- −$4,367
- Est. tax savings @ 24.0%
- +$1,048
- After-tax cash flow
- $1,724/yr
For passive investors: Depreciation is non-cash, so a rental often shows a tax loss while cash-flowing — sheltering income. Rental losses are passive: they offset passive income freely, and up to $25,000/yr can offset ordinary (W-2) income if you actively participate and your MAGI is under $100k (phasing out to $0 by $150k); unused losses carry forward. On sale, claimed depreciation is recaptured at up to 25%, and gains may owe capital-gains tax (a 1031 exchange can defer both). Figures are a year-1 estimate at your 24.0% rate — not tax advice; consult a CPA.
Schools (NCES district)
- District
- Tyler ISD
- NCES district ID
- 4843470
- Math proficiency
- 39% ▼ -4.00%
- Reading proficiency
- 38% ▼ -1.00%
- Median HH income
- $44,090
- Composite
- 32.69/100
- National rank
- #5650
- State rank
- #449 of 826 in TX
Livability — Tyler
- Score
- 75/100
- State rank
- #147
- US rank
- #4181
Category grades
Schools grade is shown separately in the Schools card above.
Census & demographics
- County
- Smith County · 180,570 people
- City population
- 127,842
- Metro
- Tyler, TX
- Population (ZIP)
- 46,039
- Household income
- $79,194
- Rent vs Own
- Severe rent burden
- 1585.0
Population outlook (Smith County) Hauer SSP2
- Today (2025)
- 248,890 people
- By 2030
- 261,665 · +5.1%
- By 2040
- 286,114 · +15.0%
- By 2050
- 308,006 · +23.8%
- By 2075
- 354,171 · +42.3%
- By 2100
- 372,828 · +49.8%
Race, ethnicity, and origin ACS 2023
- Neighborhood character
- Predominantly White (66%)
- Race & ethnicity
- White 66% Black 17% Hispanic / Latino 10% Two or more races 7% Asian 4%
- Hispanic origin (detail)
- Mexican 8%
- Common ancestry
- Slovak 3% Italian 2% Lithuanian 2%
- Foreign-born
- 7% · Canada, China, Vietnam
- Languages at home
- 89% English-only · Spanish 6% Other Indo-European 1% Tagalog/Filipino 1%
Political lean MEDSL · Smith
- 2024 margin
- Solid R (+45.1) · D 27.0% · R 72.1%
- 2008→2024 swing
- -5.6pp toward R · 2008: -39.5pp · 2024: -45.1pp
- All cycles
- 2024: R+45.1 2020: R+39.4 2016: R+43.9 2012: R+46.9 2008: R+39.5
Not yet ingested
- Civics
- —
Market trends
- HPI YoY
- ▼ -218.79%
- Current HPI
- 182.3842
- Rent YoY
- ▼ -1.95%
- Metro
- Tyler, TX
- State GDP YoY
- ▲ 3.95%
- F500 in state
- 110
Industry mix (Fortune 500 HQ in TX)
| Industry | F500 HQs | Revenue |
|---|---|---|
| Energy | 16 | $1,198B |
|
||
| Technology | 5 | $198B |
|
||
| Engineering / Construction | 4 | $72B |
|
||
| Energy Services | 3 | $60B |
|
||
| Utilities | 3 | $41B |
|
||
| Healthcare | 2 | $330B |
|
||
Price history
+139.4% since first listed19 events — show timeline
- 2026-06-05 Listed $299,000 GTAR
- 2023-04-13 Sold (MLS) — NTREIS
- 2023-02-08 Sold (Public Records) — Public Records
- 2023-01-21 Pending — NTREIS
- 2023-01-07 Contingent — NTREIS
- 2022-12-13 Price Changed $254,900 NTREIS
- 2022-11-29 Price Changed $274,900 NTREIS
- 2022-11-09 Price Changed $284,900 NTREIS
- 2022-11-09 Relisted — NTREIS
- 2022-09-24 Pending — NTREIS
- 2022-07-12 Listed $289,900 NTREIS
- 2017-01-27 Sold (Public Records) — Public Records
- 2017-01-25 Sold (MLS) — GTAR
- 2017-01-12 Listed $165,900 GTAR
- 2014-02-05 Sold (Public Records) — Public Records
- 2014-02-04 Sold (MLS) — GTAR
- 2014-01-27 Listed $124,900 GTAR
- 2007-09-20 Sold (Public Records) — Public Records
- 1994-06-30 Sold (Public Records) — Public Records
Property tax history
+6.0%/yrLatest (2024): $4,106 · -22.1% YoY. Source: county tax records.
Cash-flow waterfall
monthlySold comps — $/sqft
last 12 mo · ≤1 miLoading sold comps…