 🏷️ Likely Rental
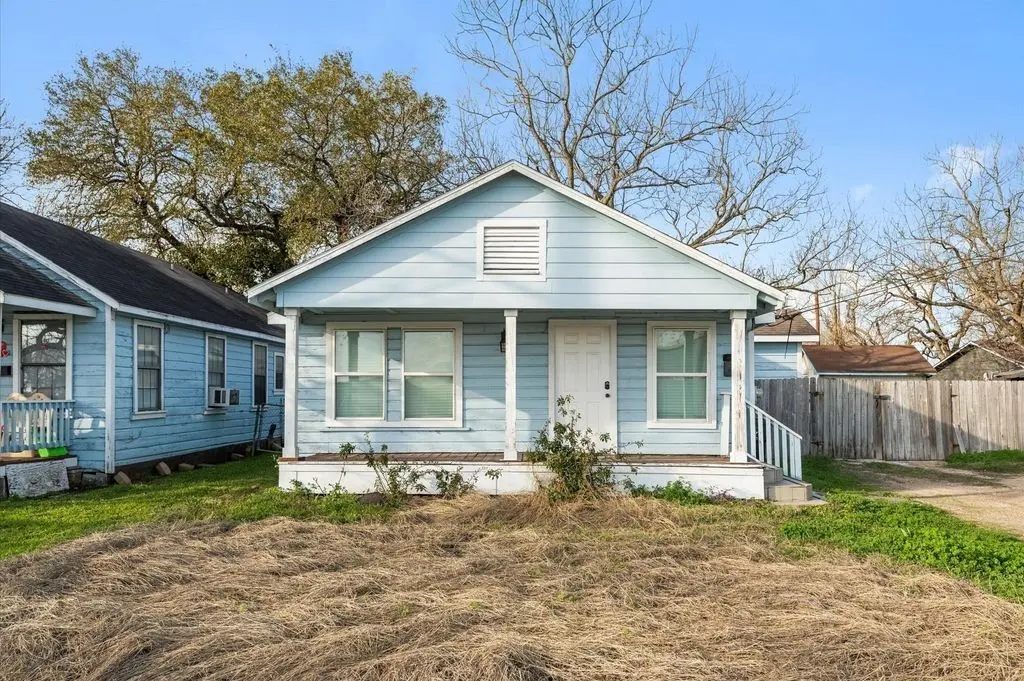
1605 Walnut Ave · Rosenberg, TX
Flood risk 1/10 · Minimal
- FEMA flood zone
- X (unshaded)
- Chance of flooding over 30 yrs
- 0.0%
- Est. flood insurance / yr
- $507 – $1,088
Fire risk 3/10 · Minor
- Est. fire insurance / yr
- $1,222 – $2,270
Heat risk 9/10 · Severe
- Hot days now (above 110°F)
- 7 days/yr
- Hot days in 30 yrs
- 23 days/yr
Wind risk 9/10 · Severe
- Chance of severe wind over 30 yrs
- 99.0%
Air-quality risk 2/10 · Minimal
- Unhealthy air days now
- 1 days/yr
- Unhealthy air days in 30 yrs
- 1 days/yr
Risk factors via First Street. Map © Google.
Why this score? — see what drove the C- grade
The composite is a weighted blend of 9 inputs, each scored 0–100. Each bar is that input's sub-score; the figure is the points it added to the 100-point composite (weight × sub-score).
- Cash flow +15.4/30.0
- ARV discount +15.0/15.0
- DSCR +4.7/10.0
- Schools +4.6/10.0
- 1% rule +3.5/10.0
- Livability +3.1/5.0
- Condition / age +2.5/5.0
- Rent growth +2.3/5.0
- Appreciation +0.0/10.0
$150,000
🖨 Deal sheet 📄 Offer letter ✓ Due diligence
Listing remarks
Great investment opportunity in Rosenberg! Recently remodeled 3-bedroom, 1-bath home on Walnut Ave with a long-term tenant in place for immediate rental income. Updates make it low-maintenance, perfect for investors. Situated on a 4,020 sq ft lot in Kaffenberger Add, this 790 sq ft single-story home is move-in ready. No HOA fees and easy access to US-90A, TX-36, and Hwy 59. High rental demand in the area ensures low vacancy risk. Add this income-producing property to your portfolio today!
Key facts
- 4,020 sq ft lot
- Built 1949
- Listed 9 days
Property features AI
Exterior
- Utilities: Public water; Public sewer
- Home design: Residential property; Single-story entry (all main rooms listed on first floor)
- Construction: Built in 1949; Vinyl and wood siding; Pillar/Post/Pier foundation; Composition roof
- Exterior features: Subdivision lot
Interior
- Bedrooms: Primary bedroom on the first floor; Two additional bedrooms on the first floor; All bedrooms located on the first floor
- Bathrooms: 1 full bathroom on the first floor
- Heating & cooling: Window unit heating; Window unit cooling
- Interior features: Total of 4 rooms
Neighborhood map
What this means for you Summary
Snapshot
- This is a 2-bed/1.0-bath single-family listed at $150k.
Deal economics
- At list price, monthly cash flow is $59 ($708/yr) — positive.
- The deal already cash-flows at list — no discount required.
- To meet the 1% rule (rent ≥ 1% of price), the offer needs to be $128k (14.8% below list).
- Recommended offer: $128k (14.8% below list) — sets the bar for 1% rule.
- Cap rate 6.8% vs local median 3.4% in Rosenberg — top-decile yield for the area; either an underpriced asset or a hidden risk that comps aren't pricing in. Stress-test before assuming the spread holds.
Location & tenants
- Location reads 62/100 on livability (#922 in TX) — a middle-class / working-renter tenant base. Strengths: cost of living A+, housing A+, crime B; Watch: schools D-, amenities F, commute F.
- Lamar CISD (suburban): math 50% / reading 53% proficiency, ranked #116 of 826 in TX (top 14%) — acceptable for families but not a draw, mixed tenant base, ~2y average lease.
- Market conditions: Rents soft (-1.0%/yr); 716 active listings in the ZIP; 3 comparable units currently listed for rent nearby; rentals leasing fast (median 5d on market — plan ~1-2 weeks tenant-placement turnaround); 12,093 units permitted in Fort Bend County in 2024 (815 in 5+ unit buildings).
Forward outlook
- Local home prices are declining (-3.0%/yr); year-one equity from $1k of loan paydown is wiped out by about $4k of value loss. Plan a longer hold.
- Fort Bend County population projected at +75% by 2050 — long-run rental-demand tailwind backs the buy-and-hold thesis.
Negotiation context
- Only 9 days on market — expect competitive offers; lowballing is unlikely to land.
- 5 sale attempts since 6y ago with the ask held roughly flat each time — persistent listings suggest the price (not the market) is what's stuck; bring a comps-based counter.
Risks & watch-outs
- Watch-outs: built in 1949 — expect roof / HVAC / electrical / plumbing capex.
- Climate carrying-cost: severe wind risk, 99% chance of damaging wind over 30y; extreme-heat days projected 7→23/yr by 2055 (HVAC capex compounding) — expect insurance premiums to compound above CPI over the hold.
Questions for the listing agent
- Built in 1949 — when were the roof, HVAC, electrical panel, plumbing, and water heater last replaced?
- Is there a deadline driving the sale (1031 exchange, divorce, estate, relocation)? That informs how much negotiation room exists.
- Schools are D-rated, which usually means shorter tenancies and higher turnover. Who's the typical renter profile here, and what's been the actual vacancy rate?
- What's the average days-on-market for RENTAL listings here right now (not sales)? A rising rental-DOM trend means longer vacancies and softer asking-rent achievability than the comps imply.
- What's the recent tenant-quality profile in this submarket — average credit score on applications, eviction rate, late-payment / NSF rate, and stable-employment percentage? A property-management company in the area should have these aggregated.
- How much new for-sale + rental construction is in the pipeline within 1–3 miles? Heavy new supply typically softens prices + rents 12–24 months out; constrained supply supports both.
Investment metrics
- 1% rule
- 0.85% ✗
- Cap rate
- 6.76%
- Cash-on-cash
- 1.69%
- DSCR
- 1.07
- GRM
- 9.8
CMA / ARV
- ARV (on-the-fly)
- $202,240
- Comps found
- 2
Show comp detail 2 sales within ~0.75 mi
| Address | Dist | Beds/Ba | Sqft | Sold | Price | $/sf | Match |
|---|---|---|---|---|---|---|---|
| 1219 Walnut Ave | 0.25mi | 2/1.0 | 752 (-5%) | 24mo | $65,000 | $86 | 60 |
| 1901 Avenue B | 0.34mi | 3/1.0 (+1) | 780 (-1%) | 24mo | $199,990 | $256 | 57 |
Match score weights: distance 35% · size 25% · config 20% · recency 20%. Top-matched comps best support the ARV.
Projected returns pro-forma
-3.0% appreciation · 0.0% rent growth · sell at horizon
- IRR
- -16.8%
- Equity multiple
- 0.42×
- Total profit
- $-24,329
- Equity at exit
- $22,365
- IRR
- -14.8%
- Equity multiple
- 0.26×
- Total profit
- $-30,960
- Equity at exit
- $12,969
Cash invested: $42,000 (down + closing). Projections, not guarantees.
Landlord ↔ Tenant lean methodology
- Overall (STATE)
- 87 Strongly Landlord-Friendly
- State Texas
- 87 Strongly Landlord-Friendly · R+5
- County
- — inherits STATE
- City
- — inherits STATE
ZIP-level market 77471
- Home prices YoY
- -19.3%
- Rents YoY
- -1.0%
- Active inventory
- 716
- Price-to-rent
- 9.8×
Monthly cashflow live
- Estimated rent
- $1,278 medium interval (Pro) →
- Mortgage (P&I)
- −$787
- Tax from tax record
- −$102 /mo · $1,220/yr
- Insurance
- −$62
- HOA
- −$0
- Vacancy / Maint / Mgmt
- −$268
- Net cashflow
- $59
Break-even live
UW: 25.0% down · 7.5% · 30yr · 1.5% tax · 5.0% vac · 8.0% maint · 8.0% mgmt
Financing live
Cash to close
- Down payment
- $37,500
- Closing costs
- $4,500
- Reserves months
- —
- Total cash needed
- —
Loan-product check · same deal, 3 products live
Conventional
25% down · 7.5% · 30yr
- Down + closing
- —
- Monthly P&I
- —
- Monthly cashflow
- —
- DSCR
- —
- Eligible?
- —
Personal DTI + credit; lowest rate.
DSCR
20% down · 8.5% · 30yr
- Down + closing
- —
- Monthly P&I
- —
- Monthly cashflow
- —
- DSCR
- —
- Eligible?
- —
No personal income docs; deal must DSCR.
Hard money
10% down · 12.0% · 12mo
- Down + closing
- —
- Monthly P&I
- —
- Monthly cashflow
- —
- DSCR
- —
- Eligible?
- —
Short-term bridge; refi at stabilization.
Rent comps 3 comps
| Address | Beds | Baths | Sqft | Rent | $/sqft | DOM | Units | Dist |
|---|---|---|---|---|---|---|---|---|
| 1209 Mulcahy St Unit 1205 Rosenberg, TX | 2.0 | 1.0 | 700 | $1,075 | $1.54 | 2d | 1 | 0.36mi |
| 1747 5th St Rosenberg, TX | 2.0 | 1.0 | 660 | $1,400 | $2.12 | 43d | 1 | 0.90mi |
| 1811 City Hall Dr Rosenberg, TX | 1.0 | 1.0 | 587 | $1,049 | $1.79 | 5d | 6 | 1.01mi |
Listing history 7 events
-
2026-06-18days on market $150,000 Active 9 DOM
-
2026-06-17days on market $150,000 Active 8 DOM
-
2026-06-16days on market $150,000 Active 7 DOM
-
2026-06-15days on market $150,000 Active 6 DOM
-
2026-06-13days on market $150,000 Active 4 DOM
-
2026-06-10remarks 493-char remark
-
2026-06-10$150,000 Active 1 DOM
ⓘ Source: listings_history table (triggers on properties + properties_extension) + one-shot
backfill from property_details.listing_events for pre-trigger history.
Tax reassessment forecast TX · Resets to sale price
- Current annual tax
- $1,220 · $102/mo
- Projected year-2 tax
- $2,745 · $229/mo
- Expected delta
- +$1,525/yr (+$127/mo · 125.0%)
ⓘ Screening estimate from a state-policy table — verify with the county assessor before closing.
Climate risk First Street
- Flood 1/10 Low FEMA zone X (unshaded) · 0% chance over 30 yrs
- Wildfire 3/10 Moderate
- Heat 9/10 Extreme 7 d/yr ≥110°F today · 23 d/yr by 30 yrs out
- Wind 9/10 Extreme 99% chance of damaging wind over 30 yrs
- Air quality 2/10 Low 1 unhealthy d/yr today · 1 by 30 yrs out
Nearby sold comps map
Loading sold comps map…
Walkable amenities ~0.75 mi
Loading nearby amenities…
Taxation est. · year 1
- Rental income
- $15,338
- − Mortgage interest
- −$8,402
- − Property taxes
- −$1,220
- − Insurance
- −$750
- − Repairs & maintenance
- −$1,227
- − Management
- −$1,227
- − Depreciation
- −$4,364
- Taxable loss
- −$1,852
- Est. tax savings @ 24.0%
- +$444
- After-tax cash flow
- $1,152/yr
For passive investors: Depreciation is non-cash, so a rental often shows a tax loss while cash-flowing — sheltering income. Rental losses are passive: they offset passive income freely, and up to $25,000/yr can offset ordinary (W-2) income if you actively participate and your MAGI is under $100k (phasing out to $0 by $150k); unused losses carry forward. On sale, claimed depreciation is recaptured at up to 25%, and gains may owe capital-gains tax (a 1031 exchange can defer both). Figures are a year-1 estimate at your 24.0% rate — not tax advice; consult a CPA.
Schools (NCES district)
- District
- Lamar CISD
- NCES district ID
- 4826580
- Math proficiency
- 50% ▼ -12.00%
- Reading proficiency
- 53% ▼ -4.00%
- Median HH income
- $75,213
- Composite
- 46.43/100
- National rank
- #2452
- State rank
- #116 of 826 in TX
Livability — Rosenberg
- Score
- 62/100
- State rank
- #922
- US rank
- #16414
Category grades
Schools grade is shown separately in the Schools card above.
Census & demographics
- Census place
- Rosenberg, TX
- County
- Fort Bend County · 836,777 people
- City population
- 115,151
- Metro
- Houston-The Woodlands-Sugar Land, TX
- Population (ZIP)
- 45,325
- Household income
- $73,186
- Rent vs Own
- Severe rent burden
- 1688.0
Population outlook (Fort Bend County) Hauer SSP2
- Today (2025)
- 1,004,526 people
- By 2030
- 1,153,104 · +14.8%
- By 2040
- 1,453,718 · +44.7%
- By 2050
- 1,753,781 · +74.6%
- By 2075
- 2,455,772 · +144.5%
- By 2100
- 2,930,528 · +191.7%
Race, ethnicity, and origin ACS 2023
- Neighborhood character
- Diverse neighborhood (Simpson 0.61)
- Race & ethnicity
- Hispanic / Latino 56% White 23% Two or more races 21% Black 12% Asian 7%
- Hispanic origin (detail)
- Mexican 46%
- Common ancestry
- Romanian 1% Lithuanian 1% Slovak 1%
- Foreign-born
- 18% · Canada, China, Vietnam
- Languages at home
- 57% English-only · Spanish 35% Tagalog/Filipino 2% Other Indo-European 1%
Political lean MEDSL · Fort Bend
- 2024 margin
- Toss-up / Even · D 49.5% · R 47.9% · Other 2.6%
- 2008→2024 swing
- +4.0pp toward D · 2008: -2.4pp · 2024: 1.6pp
- All cycles
- 2024: D+1.6 2020: D+10.6 2016: D+6.6 2012: R+6.8 2008: R+2.4
Not yet ingested
- Civics
- —
Market trends
- HPI YoY
- ▼ -74.06%
- Current HPI
- 309.5425
- Rent YoY
- ▼ -0.97%
- Metro
- Houston-The Woodlands-Sugar Land, TX
- State GDP YoY
- ▲ 3.95%
- F500 in state
- 110
Industry mix (Fortune 500 HQ in TX)
| Industry | F500 HQs | Revenue |
|---|---|---|
| Energy | 16 | $1,198B |
|
||
| Technology | 5 | $198B |
|
||
| Engineering / Construction | 4 | $72B |
|
||
| Energy Services | 3 | $60B |
|
||
| Utilities | 3 | $41B |
|
||
| Healthcare | 2 | $330B |
|
||
Price history
+15.4% since first listed13 events — show timeline
- 2026-06-09 Listed $150,000 HARMLS
- 2026-04-15 Listing Removed — HARMLS
- 2025-10-24 Sold (Public Records) — Public Records
- 2025-10-13 Listed $150,000 HARMLS
- 2025-09-30 Listing Removed — HARMLS
- 2025-03-06 Listed $160,000 HARMLS
- 2020-10-22 Sold (MLS) — HARMLS
- 2020-10-16 Pending — HARMLS
- 2020-09-30 Relisted — HARMLS
- 2020-08-19 Pending — HARMLS
- 2020-08-05 Pending — HARMLS
- 2020-07-29 Listed $130,000 HARMLS
- 1996-11-21 Sold (Public Records) — Public Records
Property tax history
+3.3%/yrLatest (2025): $1,220 · -20.5% YoY. Source: county tax records.
Cash-flow waterfall
monthlySold comps — $/sqft
last 12 mo · ≤1 miLoading sold comps…