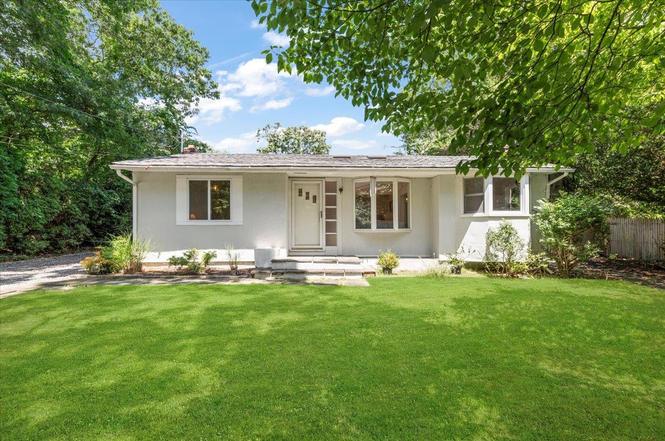
56 W Donellan Rd · Hampton Bays, NY
Flood risk 1/10 · Minimal
- FEMA flood zone
- X (unshaded)
- Chance of flooding over 30 yrs
- 0.0%
- Est. flood insurance / yr
- $473 – $860
Fire risk 1/10 · Minimal
- Est. fire insurance / yr
- $691 – $1,283
Heat risk 4/10 · Minor
- Hot days now (above 90°F)
- 7 days/yr
- Hot days in 30 yrs
- 21 days/yr
Wind risk 8/10 · Major
- Chance of severe wind over 30 yrs
- 80.0%
Air-quality risk 3/10 · Minor
- Unhealthy air days now
- 2 days/yr
- Unhealthy air days in 30 yrs
- 3 days/yr
Risk factors via First Street. Map © Google.
Why this score? — see what drove the B+ grade
The composite is a weighted blend of 9 inputs, each scored 0–100. Each bar is that input's sub-score; the figure is the points it added to the 100-point composite (weight × sub-score).
- Cash flow +29.8/30.0
- ARV discount +15.0/15.0
- DSCR +10.0/10.0
- 1% rule +7.6/10.0
- Rent growth +5.0/5.0
- Schools +4.0/10.0
- Livability +3.4/5.0
- Condition / age +2.5/5.0
- Appreciation +0.0/10.0
$839,000
🖨 Deal sheet 📄 Offer letter ✓ Due diligence
Listing remarks
Tucked away on a peaceful dead-end street well south of Montauk Highway, this hidden gem is the kind of opportunity buyers patiently wait for. Just minutes from both the ocean and bay beaches, this 3-bedroom, 2-bathroom home offers an ideal mix of location, potential, and privacy-positioned perfectly for the next chapter. Set on a generous parcel, the home features an in-ground pool and a detached two-car garage-an excellent candidate for accessory space conversion. Whether you envision a serene personal retreat, a high-performing rental, or a full-time residence, the possibilities here are as endless as the summer sky. Surrounded by the rhythm and beauty of nature-where days begin with sal
Key facts
- In-ground pool
- Generous parcel
- 0.23 acre lot
Tags
Neighborhood map
What this means for you Summary
Snapshot
- This is a 4-bed/2.0-bath single-family listed at $839k.
Deal economics
- At list price, monthly cash flow is $3k ($37k/yr) — positive.
- The deal already cash-flows at list — no discount required.
- Meets the 1% rule at list price ($11k rent vs $839k).
- Recommended offer: $763k (9.0% below list) — sets the bar for market timing.
- Cap rate 10.7% vs local median 6.4% in Hampton Bays — top-decile yield for the area; either an underpriced asset or a hidden risk that comps aren't pricing in. Stress-test before assuming the spread holds.
Location & tenants
- Location reads 68/100 on livability (#551 in NY) — a middle-class / working-renter tenant base. Strengths: crime A+, employment A+, health & safety B+; Watch: amenities F, commute F, cost of living F.
- Hampton Bays Union Free School District (suburban): math 45% / reading 44% proficiency, ranked #434 of 590 in NY (top 74%) — families likely to look elsewhere, expect single-tenant / working-renter base with shorter leases.
- Zoned schools: Hampton Bays Elementary School (math 32% / reading 52%, grade F, #1,361 of 2,108 statewide, top 67%, 682 students, 55% FRL); Hampton Bays Middle School (math 25% / reading 38%, grade F, #522 of 729 statewide, top 73%, 597 students, 64% FRL); Hampton Bays High School (math 98% / reading 57%, grade A-, #580 of 1,100 statewide, top 53%, 769 students, 53% FRL) — zoned schools average 58% FRL vs 38% district-wide (20 pts higher); higher-poverty schools than district average — tighter screening recommended.
- Market conditions: Rents rising fast (+16.1%/yr); 172 active listings in the ZIP; 31 comparable units currently listed for rent nearby; rentals at typical pace (median 25d on market — plan ~3-4 weeks tenant-placement turnaround); high-income renter base; 1,366 units permitted in Suffolk County in 2024 (216 in 5+ unit buildings).
Forward outlook
- Local home prices are declining (-3.0%/yr); year-one equity from $6k of loan paydown is wiped out by about $25k of value loss. Plan a longer hold.
- Suffolk County population projected to shrink 5% by 2050 — rents likely to lag national; underwrite the cash flow, not the appreciation.
- At projected returns (-3.0% appreciation + 8.0% rent growth), your $235k cash investment doubles in ~6 years — after that, you're playing with house money.
Negotiation context
- It's been on market 104 days — a 9% lower offer ($763k) is reasonable based on typical stale-listing flexibility.
- 7 sale attempts since 3y ago with the ask held roughly flat each time — persistent listings suggest the price (not the market) is what's stuck; bring a comps-based counter.
- Current owner paid $114k; list at $839k implies a 639% gain — meaningful room to come down on a strong offer.
Risks & watch-outs
- Watch-outs: built in 1956 — expect roof / HVAC / electrical / plumbing capex.
- Climate carrying-cost: severe wind risk, 80% chance of damaging wind over 30y — expect insurance premiums to compound above CPI over the hold.
Questions for the listing agent
- It's been on market 104 days. Have you received any prior offers? Is the seller open to a 9% concession, seller financing, or rate buy-down credit?
- Built in 1956 — when were the roof, HVAC, electrical panel, plumbing, and water heater last replaced?
- Why hasn't it sold? Are there any deal-killer items the seller is aware of (foundation, flood, title, zoning, code violations)?
- Is there a deadline driving the sale (1031 exchange, divorce, estate, relocation)? That informs how much negotiation room exists.
- Schools are B-rated — typically a magnet for longer-tenancy family renters. What's the average tenant stay here, and is there a school-zone premium baked into asking?
- What's the average days-on-market for RENTAL listings here right now (not sales)? A rising rental-DOM trend means longer vacancies and softer asking-rent achievability than the comps imply.
- What's the recent tenant-quality profile in this submarket — average credit score on applications, eviction rate, late-payment / NSF rate, and stable-employment percentage? A property-management company in the area should have these aggregated.
- How much new for-sale + rental construction is in the pipeline within 1–3 miles? Heavy new supply typically softens prices + rents 12–24 months out; constrained supply supports both.
Investment metrics
- 1% rule
- 1.26% ✓
- Cap rate
- 10.69%
- Cash-on-cash
- 15.70%
- DSCR
- 1.70
- GRM
- 6.6
CMA / ARV
- ARV (on-the-fly)
- $1,077,654
- Comps found
- 12
Show comp detail 12 sales within ~0.75 mi
| Address | Dist | Beds/Ba | Sqft | Sold | Price | $/sf | Match |
|---|---|---|---|---|---|---|---|
| 79 School St | 0.51mi | 3/2.0 (-1) | 1,700 (-3%) | 1mo | $900,000 | $529 | 65 |
| 60 School St | 0.46mi | 5/2.0 (+1) | 1,700 (-3%) | 6mo | $775,000 | $456 | 63 |
| 14C Penny Ln | 0.60mi | 3/2.0 (-1) | 1,778 (+1%) | 6mo | $1,790,000 | $1,007 | 60 |
| 19 Shinnecock Rd | 0.45mi | 4/4.0 | 1,656 (-6%) | 2mo | $1,585,000 | $957 | 60 |
| 34 Shinnecock Rd | 0.53mi | 4/2.0 | 1,650 (-6%) | 11mo | $1,440,000 | $873 | 56 |
| 11 Staller Blvd | 0.47mi | 4/2.5 | 1,626 (-8%) | 12mo | $998,000 | $614 | 54 |
| 50 School St | 0.46mi | 3/2.0 (-1) | 1,674 (-5%) | 15mo | $850,000 | $508 | 53 |
| 4A Last | 0.58mi | 3/2.5 (-1) | 1,623 (-8%) | 8mo | $2,400,000 | $1,479 | 46 |
| 65 Palo Alto Dr | 0.32mi | 4/4.0 | 2,000 (+14%) | 12mo | $1,100,000 | $550 | 44 |
| 88 Lynn Ave | 0.72mi | 3/2.5 (-1) | 1,736 (-1%) | 17mo | $830,000 | $478 | 43 |
| 25 Lynncliff Rd | 0.46mi | 3/2.5 (-1) | 1,530 (-13%) | 15mo | $825,100 | $539 | 38 |
| 8 Higbee Rd | 0.73mi | 3/2.5 (-1) | 2,000 (+14%) | 16mo | $1,225,000 | $613 | 23 |
Match score weights: distance 35% · size 25% · config 20% · recency 20%. Top-matched comps best support the ARV.
Projected returns pro-forma
-3.0% appreciation · 8.0% rent growth · sell at horizon
- IRR
- 11.7%
- Equity multiple
- 1.49×
- Total profit
- $115,594
- Equity at exit
- $125,098
- IRR
- 24.2%
- Equity multiple
- 3.58×
- Total profit
- $606,858
- Equity at exit
- $72,541
Cash invested: $234,920 (down + closing). Projections, not guarantees.
Landlord ↔ Tenant lean methodology
- Overall (STATE)
- 15 Strongly Tenant-Friendly
- State New York
- 15 Strongly Tenant-Friendly · D+10
- County
- — inherits STATE
- City
- — inherits STATE
ZIP-level market 11946
- Home prices YoY
- -20.3%
- Rents YoY
- 16.1%
- Active inventory
- 172
- Price-to-rent
- 6.6×
Monthly cashflow live
- Estimated rent
- $10,593 medium interval (Pro) →
- Mortgage (P&I)
- −$4,400
- Tax from tax record
- −$546 /mo · $6,551/yr
- Insurance
- −$350
- HOA
- −$0
- Vacancy / Maint / Mgmt
- −$2,224
- Net cashflow
- $3,073
Break-even live
UW: 25.0% down · 7.5% · 30yr · 1.5% tax · 5.0% vac · 8.0% maint · 8.0% mgmt
Financing live
Cash to close
- Down payment
- $209,750
- Closing costs
- $25,170
- Reserves months
- —
- Total cash needed
- —
Loan-product check · same deal, 3 products live
Conventional
25% down · 7.5% · 30yr
- Down + closing
- —
- Monthly P&I
- —
- Monthly cashflow
- —
- DSCR
- —
- Eligible?
- —
Personal DTI + credit; lowest rate.
DSCR
20% down · 8.5% · 30yr
- Down + closing
- —
- Monthly P&I
- —
- Monthly cashflow
- —
- DSCR
- —
- Eligible?
- —
No personal income docs; deal must DSCR.
Hard money
10% down · 12.0% · 12mo
- Down + closing
- —
- Monthly P&I
- —
- Monthly cashflow
- —
- DSCR
- —
- Eligible?
- —
Short-term bridge; refi at stabilization.
Rent comps 31 comps
| Address | Beds | Baths | Sqft | Rent | $/sqft | DOM | Units | Dist |
|---|---|---|---|---|---|---|---|---|
| 37 Wakeman Rd Hampton Bays, NY | 5.0 | 1.0 | 2226 | $30,000 | $13.48 | 17d | 1 | 0.18mi |
| 23 N Westbury Rd Hampton Bays, NY | 4.0 | 3.5 | 2212 | $12,000 | $5.42 | 24d | 1 | 0.21mi |
| 40 Kyle Rd Hampton Bays, NY | 3.0 | 2.0 | 1320 | $5,000 | $3.79 | 43d | 1 | 0.22mi |
| 7 Huckleberry Ln Hampton Bays, NY | 4.0 | 2.5 | 1608 | $5,600 | $3.48 | 18d | 1 | 0.25mi |
| 121 Ponquogue Ave Hampton Bays, NY | 3.0 | 3.0 | 1316 | $27,000 | $20.52 | 24d | 1 | 0.29mi |
| 60 Lynncliff Rd Hampton Bays, NY | 3.0 | 2.0 | 1536 | $27,000 | $17.58 | 43d | 1 | 0.39mi |
| 8 Westerly Ct Hampton Bays, NY | 4.0 | 2.0 | 2300 | $25,000 | $10.87 | 24d | 1 | 0.41mi |
| 8 Wakeman Ct Hampton Bays, NY | 4.0 | 3.0 | 1932 | $11,000 | $5.69 | 24d | 1 | 0.46mi |
| 47 School St Hampton Bays, NY | 4.0 | 3.0 | 1700 | $25,000 | $14.71 | 43d | 1 | 0.48mi |
| 6 White Ln Hampton Bays, NY | 4.0 | 4.5 | 2458 | $20,000 | $8.14 | 24d | 1 | 0.50mi |
| 55A Shinnecock Rd Hampton Bays, NY | 4.0 | 2.0 | 2300 | $57,500 | $25.00 | 24d | 1 | 0.53mi |
| 15 Gardners Ln Hampton Bays, NY | 3.0 | 2.0 | 1665 | $30,000 | $18.02 | 18d | 1 | 0.63mi |
| 35 Bay Ave W Hampton Bays, NY | 4.0 | 3.0 | 2221 | $15,000 | $6.75 | 17d | 1 | 0.65mi |
| 71 Hampton Rd Hampton Bays, NY | 3.0 | 2.5 | 1500 | $18,000 | $12.00 | 24d | 1 | 0.66mi |
| 18 Maryland Blvd Unit 1429741P Hampton Bays, NY | 3.0 | 3.0 | 1732 | $7,445 | $4.30 | 2d | 1 | 0.68mi |
| 3 Harbor Rd Hampton Bays, NY | 5.0 | 2.5 | 2500 | $25,000 | $10.00 | 7d | 1 | 0.73mi |
| 38 Woodridge Rd Hampton Bays, NY | 3.0 | 1.0 | 1398 | $8,000 | $5.72 | 24d | 1 | 0.74mi |
| 9 Tramposh Ln Hampton Bays, NY | 4.0 | 2.0 | 2092 | $10,000 | $4.78 | 5d | 1 | 0.77mi |
| 129 Lynncliff Rd Hampton Bays, NY | 3.0 | 3.5 | 2000 | $18,000 | $9.00 | 17d | 1 | 0.78mi |
| 81 Foster Ave Hampton Bays, NY | 4.0 | 3.5 | 1664 | $25,000 | $15.02 | 43d | 1 | 0.84mi |
| 41 Cormorant Dr Hampton Bays, NY | 3.0 | 2.5 | 1874 | $25,000 | $13.34 | 18d | 1 | 0.89mi |
| 36 Nautilus Dr Hampton Bays, NY | 3.0 | 1.5 | 1726 | $36,000 | $20.86 | 43d | 1 | 0.92mi |
| 14 Canal Way Hampton Bays, NY | 3.0 | 3.0 | 2000 | $59,000 | $29.50 | 24d | 1 | 0.94mi |
| 48 Fanning Ave Hampton Bays, NY | 4.0 | 2.5 | 2400 | $12,500 | $5.21 | 18d | 1 | 0.95mi |
| 111 Fanning Ave Hampton Bays, NY | 3.0 | 2.0 | 1474 | $20,000 | $13.57 | 5d | 1 | 1.09mi |
| 10 Ginny Ln Hampton Bays, NY | 4.0 | 3.5 | 2596 | $30,000 | $11.56 | 24d | 1 | 1.09mi |
| 16 Grant Blvd Hampton Bays, NY | 4.0 | 2.5 | 2300 | $8,000 | $3.48 | 15d | 1 | 1.12mi |
| 35 Grant Blvd Hampton Bays, NY | 4.0 | 3.0 | 1484 | $35,000 | $23.58 | 24d | 1 | 1.18mi |
| 23 E Point Ln Hampton Bays, NY | 3.0 | 3.5 | 2614 | $69,000 | $26.40 | 24d | 1 | 1.28mi |
| 5 Ardmore Ct Hampton Bays, NY | 3.0 | 2.0 | 1800 | $28,000 | $15.56 | 18d | 1 | 1.30mi |
| 3 Debbie Trl Hampton Bays, NY | 3.0 | 2.0 | 1375 | $5,500 | $4.00 | 20d | 1 | 1.34mi |
Listing history 16 events
-
2025-11-02status Pending
-
2025-07-21$839,000 Active
-
2025-01-19status Active
-
2024-10-19status Pending
-
2024-09-12$719,000 Active
-
2024-08-30historical
-
2024-07-02price $729,000
-
2024-06-12price $779,000
-
2024-04-19status Active
-
2024-04-10historical
-
2024-02-17status Active
-
2023-11-29price $799,000
-
2023-11-15historical
-
2023-11-14$829,000 Active
-
2023-11-14$829,000 Active
-
1998-12-07soldstatus $113,500
ⓘ Source: listings_history table (triggers on properties + properties_extension) + one-shot
backfill from property_details.listing_events for pre-trigger history.
Tax reassessment forecast NY · Partial reset (capped growth)
- Current annual tax
- $6,551 · $546/mo
- Projected year-2 tax
- $10,365 · $864/mo
- Expected delta
- +$3,814/yr (+$318/mo · 58.2%)
ⓘ Screening estimate from a state-policy table — verify with the county assessor before closing.
Climate risk First Street
- Flood 1/10 Low FEMA zone X (unshaded) · 0% chance over 30 yrs
- Wildfire 1/10 Low
- Heat 4/10 Moderate 7 d/yr ≥90°F today · 21 d/yr by 30 yrs out
- Wind 8/10 Severe 80% chance of damaging wind over 30 yrs
- Air quality 3/10 Moderate 2 unhealthy d/yr today · 3 by 30 yrs out
Nearby sold comps map
Loading sold comps map…
Walkable amenities ~0.75 mi
Loading nearby amenities…
Taxation est. · year 1
- Rental income
- $127,113
- − Mortgage interest
- −$46,997
- − Property taxes
- −$6,551
- − Insurance
- −$4,195
- − Repairs & maintenance
- −$10,169
- − Management
- −$10,169
- − Depreciation
- −$24,407
- Taxable income
- $24,624
- Est. tax owed @ 24.0%
- −$5,910
- After-tax cash flow
- $30,965/yr
For passive investors: Depreciation is non-cash, so a rental often shows a tax loss while cash-flowing — sheltering income. Rental losses are passive: they offset passive income freely, and up to $25,000/yr can offset ordinary (W-2) income if you actively participate and your MAGI is under $100k (phasing out to $0 by $150k); unused losses carry forward. On sale, claimed depreciation is recaptured at up to 25%, and gains may owe capital-gains tax (a 1031 exchange can defer both). Figures are a year-1 estimate at your 24.0% rate — not tax advice; consult a CPA.
Schools (NCES district)
- District
- Hampton Bays Union Free School District
- NCES district ID
- 3613530
- Math proficiency
- 45% ▼ -8.00%
- Reading proficiency
- 44% ▼ -1.00%
- Median HH income
- $70,274
- Composite
- 40.18/100
- National rank
- #3788
- State rank
- #434 of 590 in NY
Livability — Hampton Bays
- Score
- 68/100
- State rank
- #551
- US rank
- #9894
Category grades
Schools grade is shown separately in the Schools card above.
Census & demographics
- Census place
- Hampton Bays, NY
- County
- Suffolk County · 679,920 people
- City population
- 15,819
- Metro
- New York-Newark-Jersey City, NY-NJ-PA
- Population (ZIP)
- 15,819
- Household income
- $133,918
- Rent vs Own
- Severe rent burden
- 199.0
Population outlook (Suffolk County) Hauer SSP2
- Today (2025)
- 1,505,262 people
- By 2030
- 1,498,318 · -0.5%
- By 2040
- 1,471,101 · -2.3%
- By 2050
- 1,424,848 · -5.3%
- By 2075
- 1,337,157 · -11.2%
- By 2100
- 1,217,720 · -19.1%
Race, ethnicity, and origin ACS 2023
- Neighborhood character
- Majority White (62%)
- Race & ethnicity
- White 62% Hispanic / Latino 32% Two or more races 13% Asian 3% Black 2%
- Hispanic origin (detail)
- Mexican 6%
- Common ancestry
- Romanian 4% Slovak 2% Portuguese 2%
- Foreign-born
- 26% · Canada, Jamaica, Guatemala
- Languages at home
- 64% English-only · Spanish 29% Other Indo-European 2% French/Haitian/Cajun 2%
Political lean MEDSL · Suffolk
- 2024 margin
- Lean R (+10.0) · D 45.0% · R 55.0%
- 2008→2024 swing
- -16.0pp toward R · 2008: 6.0pp · 2024: -10.0pp
- All cycles
- 2024: R+10.0 2020: R+0.0 2016: R+8.2 2012: D+2.9 2008: D+6.0
Not yet ingested
- Civics
- —
Market trends
- HPI YoY
- ▼ -118.82%
- Current HPI
- 467.2466
- Rent YoY
- ▲ 16.07%
- Metro
- New York-Newark-Jersey City, NY-NJ-PA
- State GDP YoY
- ▲ 2.60%
- F500 in state
- 92
Industry mix (Fortune 500 HQ in NY)
| Industry | F500 HQs | Revenue |
|---|---|---|
| Financial Services | 10 | $950B |
|
||
| Consumer Goods | 9 | $162B |
|
||
| Insurance | 4 | $225B |
|
||
| Telecommunications | 2 | $144B |
|
||
| Pharmaceuticals | 2 | $112B |
|
||
| Media / Entertainment | 2 | $69B |
|
||
Price history
+639.2% since first listed16 events — show timeline
- 2025-11-02 Pending — OneKey® MLS as Distributed by MLS Grid
- 2025-07-21 Listed $839,000 OneKey® MLS as Distributed by MLS Grid
- 2025-01-19 Relisted — OneKey® MLS as Distributed by MLS Grid
- 2024-10-19 Pending — OneKey® MLS as Distributed by MLS Grid
- 2024-09-12 Listed $719,000 OneKey® MLS as Distributed by MLS Grid
- 2024-08-30 Listing Removed — OneKey® MLS as Distributed by MLS Grid
- 2024-07-02 Price Changed $729,000 OneKey® MLS as Distributed by MLS Grid
- 2024-06-12 Price Changed $779,000 OneKey® MLS as Distributed by MLS Grid
- 2024-04-19 Relisted — OneKey® MLS as Distributed by MLS Grid
- 2024-04-10 Listing Removed — OneKey® MLS as Distributed by MLS Grid
- 2024-02-17 Relisted — OneKey® MLS as Distributed by MLS Grid
- 2023-11-29 Price Changed $799,000 OneKey® MLS as Distributed by MLS Grid
- 2023-11-15 Listing Removed — OneKey® MLS as Distributed by MLS Grid
- 2023-11-14 Listed $829,000 OneKey® MLS as Distributed by MLS Grid
- 2023-11-14 Listed $829,000 OneKey® MLS as Distributed by MLS Grid
- 1998-12-07 Sold (Public Records) $113,500 Public Records
Property tax history
+1.4%/yrLatest (2024): $6,551 · +0.0% YoY. Source: county tax records.
Cash-flow waterfall
monthlySold comps — $/sqft
last 12 mo · ≤1 miLoading sold comps…