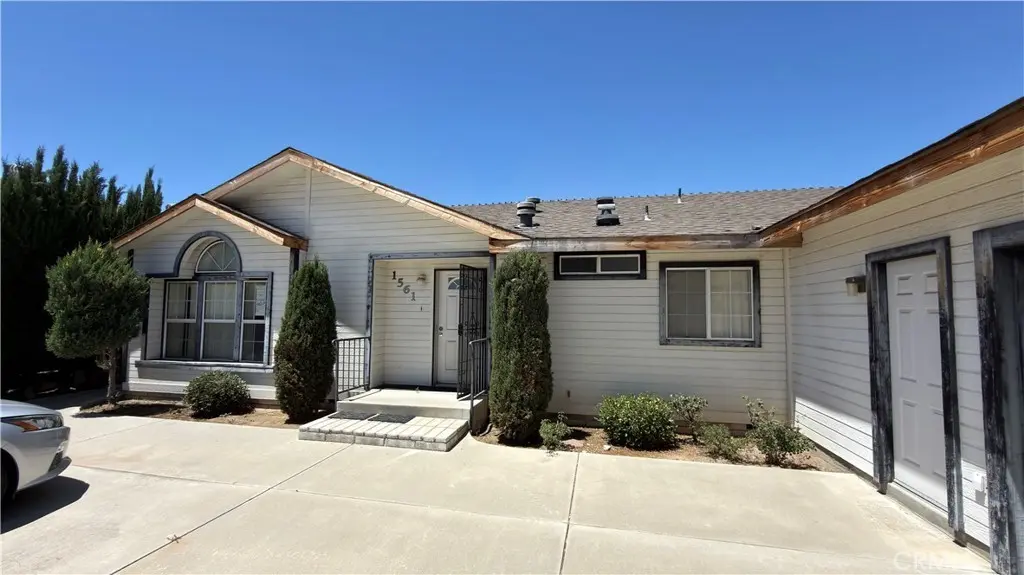
1561 Ailanthus · Hemet, CA
Flood risk 1/10 · Minimal
- FEMA flood zone
- X (shaded)
- Chance of flooding over 30 yrs
- 0.0%
- Est. flood insurance / yr
- $507 – $1,088
Fire risk 7/10 · Major
- Est. fire insurance / yr
- $659 – $1,223
Heat risk 8/10 · Major
- Hot days now (above 104°F)
- 7 days/yr
- Hot days in 30 yrs
- 21 days/yr
Wind risk 1/10 · Minimal
- Chance of severe wind over 30 yrs
- —
Air-quality risk 6/10 · Moderate
- Unhealthy air days now
- 9 days/yr
- Unhealthy air days in 30 yrs
- 11 days/yr
Risk factors via First Street. Map © Google.
Why this score? — see what drove the B grade
The composite is a weighted blend of 9 inputs, each scored 0–100. Each bar is that input's sub-score; the figure is the points it added to the 100-point composite (weight × sub-score).
- Cash flow +28.5/30.0
- ARV discount +15.0/15.0
- DSCR +10.0/10.0
- 1% rule +8.1/10.0
- Rent growth +3.4/5.0
- Livability +2.6/5.0
- Schools +2.5/10.0
- Condition / age +2.5/5.0
- Appreciation +0.0/10.0
$199,000
🖨 Deal sheet (PDF) 📄 Offer letter ✓ Due diligence
Listing remarks
Fixer Bring your ideas and contractor.
Key facts
- 7,841 sq ft lot
- 2 garage spots
- Community pool
Property features AI
Finance
- Other: Property is a single-unit residence
- HOA & community: Part of an association (Seven Hills); Monthly association fee of $46; Association amenities include golf; Located in a senior community; Community features include a golf course
Exterior
- Parking: Attached garage; Two garage spaces (two total parking spaces)
- Utilities: Public sewer; District/public water
- Home design: Single-story house; No attached dwelling unit (no ADU)
- Construction: Year built from assessor; No common walls
- Exterior features: House; Community pool; Front yard; Has a view
Interior
- Bedrooms: Three main-level bedrooms
- Bathrooms: Two full bathrooms
- Heating & cooling: Central furnace heating
- Interior features: One-level home; All bedrooms on the main floor; Entry at main level
- Laundry & utility: Separate laundry room
Neighborhood map
What this means for you Summary
Snapshot
- This is a 3-bed/2.0-bath manufactured listed at $199k.
Deal economics
- At list price, monthly cash flow is $648 ($8k/yr) — positive.
- The deal already cash-flows at list — no discount required.
- Meets the 1% rule at list price ($3k rent vs $199k).
- Cap rate 10.2% vs local median 4.9% in Hemet — top-decile yield for the area; either an underpriced asset or a hidden risk that comps aren't pricing in. Stress-test before assuming the spread holds.
Location & tenants
- Location reads 51/100 on livability (#1,056 in CA) — a working-class tenant base; expect higher turnover. Strengths: housing A+; Watch: crime D+, schools F, amenities F.
- Hemet Unified (suburban): math 19% / reading 41% proficiency, ranked #360 of 517 in CA (top 70%) — families likely to look elsewhere, expect single-tenant / working-renter base with shorter leases; 66% free/reduced lunch — lower-income household profile, screen leases tightly.
- Market conditions: Rents rising (+3.7%/yr); 290 active listings in the ZIP; 19 comparable units currently listed for rent nearby; rentals at typical pace (median 19d on market — plan ~3-4 weeks tenant-placement turnaround); 9,195 units permitted in Riverside County in 2024 (1,512 in 5+ unit buildings).
- At $2,609/mo this rent would consume 49% of the median local household income ($64k/yr) (locally 1813% of renters already pay >50% of income on rent) — very limited rent-growth headroom before tenants either downsize or default.
Forward outlook
- Local home prices are declining (-3.0%/yr); year-one equity from $1k of loan paydown is wiped out by about $6k of value loss. Plan a longer hold.
- Riverside County population projected at +22% by 2050 — long-run rental-demand tailwind backs the buy-and-hold thesis.
- At projected returns (-3.0% appreciation + 3.7% rent growth), your $56k cash investment doubles in ~8 years — after that, you're playing with house money.
Negotiation context
- Only 6 days on market — expect competitive offers; lowballing is unlikely to land.
- 3 sale attempts since 19y ago with the ask held roughly flat each time — persistent listings suggest the price (not the market) is what's stuck; bring a comps-based counter.
Risks & watch-outs
- Climate carrying-cost: major wildfire risk; extreme-heat days projected 7→21/yr by 2055 (HVAC capex compounding) — expect insurance premiums to compound above CPI over the hold.
Questions for the listing agent
- What does the HOA fee cover, when was the last increase, and are there any pending special assessments or reserve-fund shortfalls?
- Is there a deadline driving the sale (1031 exchange, divorce, estate, relocation)? That informs how much negotiation room exists.
- Schools are F-rated, which usually means shorter tenancies and higher turnover. Who's the typical renter profile here, and what's been the actual vacancy rate?
- Crime grade is D in this area — have there been break-ins, vandalism, or insurance claims at this property in the last 3 years? What carrier currently insures it and at what premium?
- What's the average days-on-market for RENTAL listings here right now (not sales)? A rising rental-DOM trend means longer vacancies and softer asking-rent achievability than the comps imply.
- What's the recent tenant-quality profile in this submarket — average credit score on applications, eviction rate, late-payment / NSF rate, and stable-employment percentage? A property-management company in the area should have these aggregated.
- How much new for-sale + rental construction is in the pipeline within 1–3 miles? Heavy new supply typically softens prices + rents 12–24 months out; constrained supply supports both.
Investment metrics
- 1% rule
- 1.31% ✓
- Cap rate
- 10.20%
- Cash-on-cash
- 13.95%
- DSCR
- 1.62
- GRM
- 6.4
CMA / ARV
- ARV (on-the-fly)
- $275,184
- Comps found
- 12
Show comp detail 12 sales within ~0.75 mi
| Address | Dist | Beds/Ba | Sqft | Sold | Price | $/sf | Match |
|---|---|---|---|---|---|---|---|
| 2526 Peach Tree | 0.19mi | 2/2.0 (-1) | 1,711 (-3%) | 3mo | $290,000 | $169 | 78 |
| 2953 Manzanita Way | 0.35mi | 2/2.0 (-1) | 1,716 (-3%) | 3mo | $284,000 | $166 | 71 |
| 1272 Lodgepole | 0.54mi | 2/2.0 (-1) | 1,760 (-0%) | 0mo | $229,000 | $130 | 69 |
| 2908 Jacaranda Way | 0.43mi | 2/2.0 (-1) | 1,760 (-0%) | 7mo | $310,000 | $176 | 69 |
| 1272 Brentwood Way | 0.32mi | 2/2.0 (-1) | 1,670 (-5%) | 5mo | $259,000 | $155 | 67 |
| 1293 Yellowood | 0.60mi | 3/2.0 | 1,820 (+3%) | 3mo | $260,000 | $143 | 64 |
| 1718 Burr Oak Way | 0.69mi | 2/2.0 (-1) | 1,736 (-2%) | 2mo | $270,000 | $156 | 59 |
| 1348 Jasmine | 0.25mi | 2/2.0 (-1) | 1,512 (-14%) | 1mo | $193,205 | $128 | 58 |
| 2683 Chamise Way | 0.46mi | 2/2.0 (-1) | 1,596 (-10%) | 1mo | $265,000 | $166 | 57 |
| 1361 Lodgepole Dr | 0.50mi | 2/2.0 (-1) | 1,900 (+8%) | 3mo | $289,900 | $153 | 56 |
| 1232 Brentwood Way | 0.37mi | 2/2.0 (-1) | 1,512 (-14%) | 1mo | $240,000 | $159 | 53 |
| 1262 Sorrel | 0.59mi | 3/2.0 | 1,560 (-12%) | 3mo | $215,000 | $138 | 51 |
Match score weights: distance 35% · size 25% · config 20% · recency 20%. Top-matched comps best support the ARV.
Projected returns pro-forma
-3.0% appreciation · 3.74% rent growth · sell at horizon
- IRR
- 5.1%
- Equity multiple
- 1.20×
- Total profit
- $11,033
- Equity at exit
- $29,672
- IRR
- 15.2%
- Equity multiple
- 2.28×
- Total profit
- $71,144
- Equity at exit
- $17,206
Cash invested: $55,720 (down + closing). Projections, not guarantees.
Landlord ↔ Tenant lean methodology
- Overall (STATE)
- 18 Strongly Tenant-Friendly
- State California
- 18 Strongly Tenant-Friendly · D+13
- County
- — inherits STATE
- City
- — inherits STATE
ZIP-level market 92545
- Home prices YoY
- -24.6%
- Rents YoY
- 3.7%
- Active inventory
- 290
- Price-to-rent
- 6.4×
Monthly cashflow live
- Estimated rent
- $2,609 high interval (Pro) →
- Mortgage (P&I)
- −$1,044
- Tax from tax record
- −$241 /mo · $2,890/yr
- Insurance
- −$83
- HOA
- −$46
- Vacancy / Maint / Mgmt
- −$548
- Net cashflow
- $648
Break-even live
Sensitivity live
| Price | -10% $760 | -5% $704 | +0% $648 | +5% $592 | +10% $535 |
|---|---|---|---|---|---|
| Rent | -10% $442 | -5% $545 | +0% $648 | +5% $751 | +10% $854 |
| Rate | -1.0pp $748 | -0.5pp $698 | base $648 | +0.5pp $596 | +1.0pp $544 |
UW: 25.0% down · 7.5% · 30yr · 1.5% tax · 5.0% vac · 8.0% maint · 8.0% mgmt
Financing live
Cash to close
- Down payment
- $49,750
- Closing costs
- $5,970
- Reserves months
- —
- Total cash needed
- —
Loan-product check · same deal, 3 products live
Conventional
25% down · 7.5% · 30yr
- Down + closing
- —
- Monthly P&I
- —
- Monthly cashflow
- —
- DSCR
- —
- Eligible?
- —
Personal DTI + credit; lowest rate.
DSCR
20% down · 8.5% · 30yr
- Down + closing
- —
- Monthly P&I
- —
- Monthly cashflow
- —
- DSCR
- —
- Eligible?
- —
No personal income docs; deal must DSCR.
Hard money
10% down · 12.0% · 12mo
- Down + closing
- —
- Monthly P&I
- —
- Monthly cashflow
- —
- DSCR
- —
- Eligible?
- —
Short-term bridge; refi at stabilization.
Rent comps 19 comps
| Address | Beds | Baths | Sqft | Rent | $/sqft | DOM | Units | Dist |
|---|---|---|---|---|---|---|---|---|
| 1354 Jasmine Way Hemet, CA | 2.0 | 2.0 | 1440 | $1,650 | $1.15 | 44d | 1 | 0.23mi |
| 2971 Peach Tree St Hemet, CA | 3.0 | 2.0 | 1834 | $2,395 | $1.31 | 44d | 1 | 0.27mi |
| 1955 Silver Oak Way Hemet, CA | 3.0 | 2.0 | 1318 | $2,250 | $1.71 | 44d | 1 | 0.46mi |
| 3138 Greengable Ln Hemet, CA | 4.0 | 3.0 | 2475 | $3,400 | $1.37 | 44d | 1 | 0.49mi |
| 1096 Burton St Hemet, CA | 3.0 | 2.5 | 1477 | $2,595 | $1.76 | 0d | 1 | 0.55mi |
| 3147 Red Cedar Trl Hemet, CA | 4.0 | 2.5 | 2390 | $3,500 | $1.46 | 25d | 1 | 0.56mi |
| 2971 Pembroke Ave Hemet, CA | 3.0 | 2.0 | 1572 | $3,000 | $1.91 | 19d | 1 | 0.83mi |
| 3080 Hampton Ave Hemet, CA | 4.0 | 2.0 | 1552 | $2,695 | $1.74 | 8d | 1 | 0.85mi |
| 1460 Caprice Ct Hemet, CA | 4.0 | 3.0 | 1898 | $3,250 | $1.71 | 25d | 1 | 0.88mi |
| 828 Greenwich Ct Hemet, CA | 3.0 | 3.0 | 1977 | $2,700 | $1.37 | 19d | 1 | 0.88mi |
| 1018 San Nicolas St Hemet, CA | 2.0 | 2.0 | 2448 | $1,750 | $0.71 | 18d | 1 | 0.98mi |
| 4277 Harbor Ct Hemet, CA | 4.0 | 3.0 | 1775 | $3,650 | $2.06 | 19d | 1 | 1.08mi |
| 1510 Sunnybank Dr Hemet, CA | 4.0 | 2.0 | 1759 | $2,750 | $1.56 | 0d | 1 | 1.10mi |
| 1610 Stoneside Dr Hemet, CA | 4.0 | 2.0 | 1760 | $3,100 | $1.76 | 44d | 1 | 1.16mi |
| 795 Cameo Ave Hemet, CA | 4.0 | 2.0 | 1600 | $2,900 | $1.81 | 15d | 1 | 1.20mi |
| 2099 Rosemary Ct Hemet, CA | 4.0 | 2.0 | 2187 | $2,700 | $1.23 | 8d | 1 | 1.25mi |
| 1833 Bayside Ct Hemet, CA | 4.0 | 3.0 | 1775 | $2,900 | $1.63 | 44d | 1 | 1.27mi |
| 1241 Sandlewood Dr Hemet, CA | 2.0 | 1.5 | 1504 | $2,000 | $1.33 | 44d | 1 | 1.40mi |
| 611 S Palm Ave Unit K Hemet, CA | 2.0 | 2.0 | 1254 | $1,895 | $1.51 | 8d | 1 | 1.48mi |
HOA detail
- Monthly dues
- $46 · $552/yr
Listing history 5 events
-
2026-06-09days on market $199,000 Active 6 DOM
-
2026-06-08days on market $199,000 Active 5 DOM
-
2026-06-07days on market $199,000 Active 4 DOM
-
2026-06-04remarks 38-char remark
-
2026-06-04$199,000 Active 1 DOM
ⓘ Source: listings_history table (triggers on properties + properties_extension) + one-shot
backfill from property_details.listing_events for pre-trigger history.
Tax reassessment forecast CA · Resets to sale price
- Current annual tax
- $2,890 · $241/mo
- Projected year-2 tax
- $2,890 · $241/mo
- Expected delta
- $0/yr ($0/mo · 0.0%)
ⓘ Screening estimate from a state-policy table — verify with the county assessor before closing.
Climate risk First Street
- Flood 1/10 Low FEMA zone X (shaded) · 0% chance over 30 yrs
- Wildfire 7/10 Severe
- Heat 8/10 Severe 7 d/yr ≥104°F today · 21 d/yr by 30 yrs out
- Wind 1/10 Low
- Air quality 6/10 Major 9 unhealthy d/yr today · 11 by 30 yrs out
Nearby sold comps map
Loading sold comps map…
Walkable amenities ~0.75 mi
Loading nearby amenities…
Taxation est. · year 1
- Rental income
- $31,309
- − Mortgage interest
- −$11,147
- − Property taxes
- −$2,890
- − Insurance
- −$995
- − Repairs & maintenance
- −$2,505
- − Management
- −$2,505
- − HOA
- −$552
- − Depreciation
- −$5,789
- Taxable income
- $4,926
- Est. tax owed @ 24.0%
- −$1,182
- After-tax cash flow
- $6,592/yr
For passive investors: Depreciation is non-cash, so a rental often shows a tax loss while cash-flowing — sheltering income. Rental losses are passive: they offset passive income freely, and up to $25,000/yr can offset ordinary (W-2) income if you actively participate and your MAGI is under $100k (phasing out to $0 by $150k); unused losses carry forward. On sale, claimed depreciation is recaptured at up to 25%, and gains may owe capital-gains tax (a 1031 exchange can defer both). Figures are a year-1 estimate at your 24.0% rate — not tax advice; consult a CPA.
Schools (NCES district)
- District
- Hemet Unified
- NCES district ID
- 0616920
- Math proficiency
- 19% ▼ -3.00%
- Reading proficiency
- 41% ▲ 4.00%
- Median HH income
- $39,962
- Composite
- 25.16/100
- National rank
- #7517
- State rank
- #360 of 517 in CA
Livability — Hemet
- Score
- 51/100
- State rank
- #1056
- US rank
- #25208
Category grades
Schools grade is shown separately in the Schools card above.
Census & demographics
- Census place
- Hemet, CA
- County
- Riverside County · 2,287,001 people
- City population
- 137,670
- Metro
- Riverside-San Bernardino-Ontario, CA
- Population (ZIP)
- 45,982
- Household income
- $63,770
- Rent vs Own
- Severe rent burden
- 1813.0
Population outlook (Riverside County) Hauer SSP2
- Today (2025)
- 2,664,475 people
- By 2030
- 2,802,692 · +5.2%
- By 2040
- 3,050,904 · +14.5%
- By 2050
- 3,256,783 · +22.2%
- By 2075
- 3,655,058 · +37.2%
- By 2100
- 3,766,594 · +41.4%
Race, ethnicity, and origin ACS 2023
- Neighborhood character
- Diverse neighborhood (Simpson 0.65)
- Race & ethnicity
- Hispanic / Latino 46% White 35% Two or more races 17% Black 8% Asian 5% Native American 1%
- Hispanic origin (detail)
- Mexican 40%
- Common ancestry
- Slovak 2% Lithuanian 2% Portuguese 1%
- Foreign-born
- 19% · Canada, Vietnam, Jamaica
- Languages at home
- 69% English-only · Spanish 27% Tagalog/Filipino 1% Other Indo-European 1%
Political lean MEDSL · Riverside
- 2024 margin
- Toss-up / Even · D 48.0% · R 49.3% · Other 2.6%
- 2008→2024 swing
- -3.6pp toward R · 2008: 2.3pp · 2024: -1.3pp
- All cycles
- 2024: R+1.3 2020: D+8.0 2016: D+4.3 2012: R+0.4 2008: D+2.3
Not yet ingested
- Civics
- —
Market trends
- HPI YoY
- ▼ -116.25%
- Current HPI
- 356.9414
- Rent YoY
- ▲ 3.74%
- Metro
- Riverside-San Bernardino-Ontario, CA
- State GDP YoY
- ▲ 3.21%
- F500 in state
- 116
Industry mix (Fortune 500 HQ in CA)
| Industry | F500 HQs | Revenue |
|---|---|---|
| Technology | 27 | $1,492B |
|
||
| Financial Services | 3 | $174B |
|
||
| Retail | 3 | $44B |
|
||
| Insurance | 3 | $26B |
|
||
| Media / Entertainment | 2 | $115B |
|
||
| Pharmaceuticals / Biotech | 2 | $62B |
|
||
Price history
-27.6% since first listed5 events — show timeline
- 2026-06-03 Listed $199,000 CRMLS
- 2008-05-30 Listing Removed — CRMLS
- 2007-11-29 Listed $239,900 CRMLS
- 2007-04-07 Listing Removed — CRMLS
- 2007-04-07 Listed $275,000 CRMLS
Property tax history
+1.6%/yrLatest (2025): $2,890 · +2.0% YoY. Source: county tax records.
Cash-flow waterfall
monthlySold comps — $/sqft
last 12 mo · ≤1 miLoading sold comps…