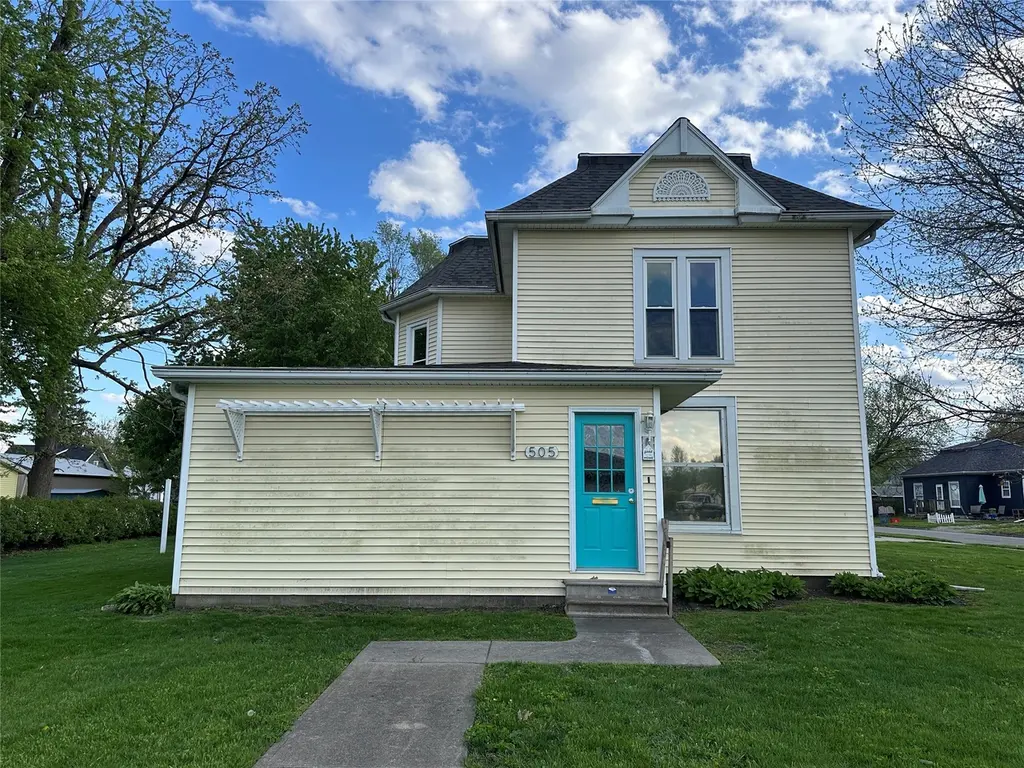
505 S 3rd Ave E · Newton, IA
Flood risk 1/10 · Minimal
- FEMA flood zone
- X (unshaded)
- Chance of flooding over 30 yrs
- 0.0%
- Est. flood insurance / yr
- $473 – $860
Fire risk 1/10 · Minimal
- Est. fire insurance / yr
- $902 – $1,676
Heat risk 3/10 · Minor
- Hot days now (above 104°F)
- 7 days/yr
- Hot days in 30 yrs
- 15 days/yr
Wind risk 2/10 · Minimal
- Chance of severe wind over 30 yrs
- —
Air-quality risk 1/10 · Minimal
- Unhealthy air days now
- 0 days/yr
- Unhealthy air days in 30 yrs
- 0 days/yr
Risk factors via First Street. Map © Google.
Why this score? — see what drove the C- grade
The composite is a weighted blend of 9 inputs, each scored 0–100. Each bar is that input's sub-score; the figure is the points it added to the 100-point composite (weight × sub-score).
- ARV discount +15.0/15.0
- Cash flow +14.2/30.0
- Schools +5.1/10.0
- 1% rule +4.3/10.0
- DSCR +4.3/10.0
- Livability +3.9/5.0
- Rent growth +2.5/5.0
- Condition / age +2.5/5.0
- Appreciation +0.0/10.0
$171,000
🖨 Deal sheet (PDF) 📄 Offer letter ✓ Due diligence
Listing remarks
Welcome home to this charming 1.5-story home offering over 2,212 sq. ft. of living space and plenty of room to spread out. The main floor features a spacious family room, formal dining room, large kitchen, master bedroom with a half bath, full bathroom, and a versatile bonus room with laundry hookups. Upstairs, you'll find three generously sized bedrooms and an additional full bathroom. Outside, the detached 2-car garage and corner lot provide extra space and convenience. Located close to shopping, dining, parks, and all the amenities Newton has to offer, this home is ready for its next owners to make it their own.
Key facts
- 0.3 acre lot
- 2 garage spots
- Built 1900
Property features AI
Exterior
- Parking: Detached 2-car garage
- Utilities: Public water; Public sewer
- Home design: 2-story house; Residential zoning
- Construction: Vinyl siding; Asphalt shingle roof; Brick/mortar foundation
- Exterior features: Open patio
Interior
- Kitchen: Dishwasher; Microwave; Stove
- Bedrooms: 2 main-level bedrooms
- Flooring: Carpet; Hardwood; Vinyl
- Bathrooms: 2 full bathrooms; 1 half bathroom
- Heating & cooling: Forced air heating (natural gas); Central air conditioning
- Interior features: Dining area; Partial unfinished basement
- Laundry & utility: Main-level laundry
Neighborhood map
What this means for you Summary
Snapshot
- This is a 4-bed/2.5-bath single-family listed at $171k.
Deal economics
- At list price, monthly cash flow is $28 ($342/yr) — positive.
- The deal already cash-flows at list — no discount required.
- To meet the 1% rule (rent ≥ 1% of price), the offer needs to be $159k (7.3% below list).
- Recommended offer: $159k (7.3% below list) — sets the bar for 1% rule.
- Cap rate 6.5% vs local median 3.1% in Newton — top-decile yield for the area; either an underpriced asset or a hidden risk that comps aren't pricing in. Stress-test before assuming the spread holds.
Location & tenants
- Location reads 77/100 on livability (#169 in IA, #3,069 nationally) — a middle-class / working-renter tenant base. Strengths: cost of living A+, housing A+, health & safety A+; Watch: crime C-, employment D+, amenities F.
- Newton Community School District (town): math 59% / reading 62% proficiency, ranked #245 of 289 in IA (top 85%) — acceptable for families but not a draw, mixed tenant base, ~2y average lease.
- Market conditions: 242 active listings in the ZIP; 3 comparable units currently listed for rent nearby; rentals at typical pace (median 24d on market — plan ~3-4 weeks tenant-placement turnaround); 16 units permitted in Jasper County in 2024 (0 in 5+ unit buildings).
- This rent runs 31% of the median local income ($62k/yr) — at the standard rent-burdened threshold; future hikes will face affordability resistance.
Forward outlook
- Local home prices are declining (-3.0%/yr); year-one equity from $1k of loan paydown is wiped out by about $5k of value loss. Plan a longer hold.
- Jasper County population projected to shrink 7% by 2050 — rents likely to lag national; underwrite the cash flow, not the appreciation.
Negotiation context
- It's been on market 36 days — a 3% lower offer ($166k) is reasonable based on typical stale-listing flexibility.
- 2 sale attempts since 4y ago; this cycle's ask has dropped $19k (10%) from the opening price — seller is motivated, your offer sets the floor, not the list.
Risks & watch-outs
- Watch-outs: built in 1900 — expect roof / HVAC / electrical / plumbing capex.
Questions for the listing agent
- It's been on market 36 days. Have you received any prior offers? Is the seller open to a 7% concession, seller financing, or rate buy-down credit?
- Built in 1900 — when were the roof, HVAC, electrical panel, plumbing, and water heater last replaced?
- Is there a deadline driving the sale (1031 exchange, divorce, estate, relocation)? That informs how much negotiation room exists.
- Schools are A-rated — typically a magnet for longer-tenancy family renters. What's the average tenant stay here, and is there a school-zone premium baked into asking?
- What's the average days-on-market for RENTAL listings here right now (not sales)? A rising rental-DOM trend means longer vacancies and softer asking-rent achievability than the comps imply.
- What's the recent tenant-quality profile in this submarket — average credit score on applications, eviction rate, late-payment / NSF rate, and stable-employment percentage? A property-management company in the area should have these aggregated.
- How much new for-sale + rental construction is in the pipeline within 1–3 miles? Heavy new supply typically softens prices + rents 12–24 months out; constrained supply supports both.
Investment metrics
- 1% rule
- 0.93% ✗
- Cap rate
- 6.49%
- Cash-on-cash
- 0.71%
- DSCR
- 1.03
- GRM
- 9.0
CMA / ARV
- ARV (median comp)
- $211,525
- List price
- $171,000
- Delta
- -19.16%
- Verdict
- UNDERPRICED
- Comps
- 20 within 1.0 mi
Show comp detail 7 sales within ~0.75 mi
| Address | Dist | Beds/Ba | Sqft | Sold | Price | $/sf | Match |
|---|---|---|---|---|---|---|---|
| 420 S 3rd Ave E | 0.05mi | 3/2.5 (-1) | 2,225 (+1%) | 12mo | $282,500 | $127 | 82 |
| 618 N 6th Ave E | 0.49mi | 4/1.5 | 2,229 (+1%) | 14mo | $166,000 | $74 | 60 |
| 314 E 3rd St N | 0.35mi | 4/2.0 | 1,932 (-13%) | 3mo | $189,000 | $98 | 58 |
| 323 W 2nd St S | 0.37mi | 3/2.5 (-1) | 2,152 (-3%) | 24mo | $228,500 | $106 | 53 |
| 600 S 3rd Ave W | 0.64mi | 4/3.0 | 2,044 (-8%) | 11mo | $187,000 | $91 | 46 |
| 320 S 3rd Ave W | 0.47mi | 4/1.5 | 1,920 (-13%) | 15mo | $149,000 | $78 | 39 |
| 522 1st Ave W | 0.66mi | 5/2.0 (+1) | 2,463 (+11%) | 17mo | $262,000 | $106 | 29 |
Match score weights: distance 35% · size 25% · config 20% · recency 20%. Top-matched comps best support the ARV.
Projected returns pro-forma
-3.0% appreciation · 3.0% rent growth · sell at horizon
- IRR
- -15.1%
- Equity multiple
- 0.46×
- Total profit
- $-25,846
- Equity at exit
- $25,497
- IRR
- -6.5%
- Equity multiple
- 0.58×
- Total profit
- $-19,968
- Equity at exit
- $14,785
Cash invested: $47,880 (down + closing). Projections, not guarantees.
Landlord ↔ Tenant lean methodology
- Overall (STATE)
- 83 Strongly Landlord-Friendly
- State Iowa
- 83 Strongly Landlord-Friendly · R+6
- County
- — inherits STATE
- City
- — inherits STATE
ZIP-level market 50208
- Home prices YoY
- -14.4%
- Active inventory
- 242
- Price-to-rent
- 9.0×
Monthly cashflow live
- Estimated rent
- $1,585 medium interval (Pro) →
- Mortgage (P&I)
- −$897
- Tax from tax record
- −$256 /mo · $3,070/yr
- Insurance
- −$71
- HOA
- −$0
- Vacancy / Maint / Mgmt
- −$333
- Net cashflow
- $28
Break-even live
Sensitivity live
| Price | -10% $125 | -5% $77 | +0% $28 | +5% $-20 | +10% $-68 |
|---|---|---|---|---|---|
| Rent | -10% $-97 | -5% $-34 | +0% $28 | +5% $91 | +10% $154 |
| Rate | -1.0pp $115 | -0.5pp $72 | base $28 | +0.5pp $-16 | +1.0pp $-61 |
UW: 25.0% down · 7.5% · 30yr · 1.5% tax · 5.0% vac · 8.0% maint · 8.0% mgmt
Financing live
Cash to close
- Down payment
- $42,750
- Closing costs
- $5,130
- Reserves months
- —
- Total cash needed
- —
Loan-product check · same deal, 3 products live
Conventional
25% down · 7.5% · 30yr
- Down + closing
- —
- Monthly P&I
- —
- Monthly cashflow
- —
- DSCR
- —
- Eligible?
- —
Personal DTI + credit; lowest rate.
DSCR
20% down · 8.5% · 30yr
- Down + closing
- —
- Monthly P&I
- —
- Monthly cashflow
- —
- DSCR
- —
- Eligible?
- —
No personal income docs; deal must DSCR.
Hard money
10% down · 12.0% · 12mo
- Down + closing
- —
- Monthly P&I
- —
- Monthly cashflow
- —
- DSCR
- —
- Eligible?
- —
Short-term bridge; refi at stabilization.
Rent comps 3 comps
| Address | Beds | Baths | Sqft | Rent | $/sqft | DOM | Units | Dist |
|---|---|---|---|---|---|---|---|---|
| 527 1st Ave W Newton, IA | 4.0 | 2.0 | 2136 | $1,850 | $0.87 | 44d | 1 | 0.66mi |
| 812 N 3rd Ave W Newton, IA | 4.0 | 1.0 | 1450 | $1,450 | $1.00 | 15d | 1 | 0.88mi |
| 712 W 12th St S Newton, IA | 3.0 | 2.5 | 2087 | $1,700 | $0.81 | 24d | 1 | 1.03mi |
Listing history 22 events
-
2026-06-18days on market $171,000 Active 36 DOM
-
2026-06-17price $171,000 Active 35 DOM
-
2026-06-17days on market $190,000 Active 35 DOM
-
2026-06-16days on market $190,000 Active 34 DOM
-
2026-06-15days on market $190,000 Active 33 DOM
-
2026-06-14days on market $190,000 Active 31 DOM
-
2026-06-13days on market $190,000 Active 30 DOM
-
2026-06-10days on market $190,000 Active 28 DOM
-
2026-06-09days on market $190,000 Active 27 DOM
-
2026-06-08days on market $190,000 Active 26 DOM
-
2026-06-07days on market $190,000 Active 25 DOM
-
2026-06-05days on market $190,000 Active 22 DOM
-
2026-06-03days on market $190,000 Active 21 DOM
-
2026-06-02days on market $190,000 Active 20 DOM
-
2026-06-01days on market $190,000 Active 19 DOM
-
2026-05-31days on market $190,000 Active 18 DOM
-
2026-05-31days on market $190,000 Active 17 DOM
-
2026-05-12$190,000 Active 622-char remark
-
2022-06-03soldstatus $182,000 Closed
-
2022-04-25status Pending
-
2022-04-14$182,500 Active
-
2017-07-20soldstatus $106,000
ⓘ Source: listings_history table (triggers on properties + properties_extension) + one-shot
backfill from property_details.listing_events for pre-trigger history.
Tax reassessment forecast IA · Partial reset (capped growth)
- Current annual tax
- $3,070 · $256/mo
- Projected year-2 tax
- $3,070 · $256/mo
- Expected delta
- $0/yr ($0/mo · 0.0%)
ⓘ Screening estimate from a state-policy table — verify with the county assessor before closing.
Climate risk First Street
- Flood 1/10 Low FEMA zone X (unshaded) · 0% chance over 30 yrs
- Wildfire 1/10 Low
- Heat 3/10 Moderate 7 d/yr ≥104°F today · 15 d/yr by 30 yrs out
- Wind 2/10 Low
- Air quality 1/10 Low 0 unhealthy d/yr today · 0 by 30 yrs out
Nearby sold comps map
Loading sold comps map…
Walkable amenities ~0.75 mi
Loading nearby amenities…
Taxation est. · year 1
- Rental income
- $19,022
- − Mortgage interest
- −$9,579
- − Property taxes
- −$3,070
- − Insurance
- −$855
- − Repairs & maintenance
- −$1,522
- − Management
- −$1,522
- − Depreciation
- −$4,975
- Taxable loss
- −$2,499
- Est. tax savings @ 24.0%
- +$600
- After-tax cash flow
- $942/yr
For passive investors: Depreciation is non-cash, so a rental often shows a tax loss while cash-flowing — sheltering income. Rental losses are passive: they offset passive income freely, and up to $25,000/yr can offset ordinary (W-2) income if you actively participate and your MAGI is under $100k (phasing out to $0 by $150k); unused losses carry forward. On sale, claimed depreciation is recaptured at up to 25%, and gains may owe capital-gains tax (a 1031 exchange can defer both). Figures are a year-1 estimate at your 24.0% rate — not tax advice; consult a CPA.
Schools (NCES district)
- District
- Newton Community School District
- NCES district ID
- 1920610
- Math proficiency
- 59% ▼ -13.00%
- Reading proficiency
- 62% ▼ -9.00%
- Median HH income
- $46,447
- Composite
- 51.15/100
- National rank
- #1762
- State rank
- #245 of 289 in IA
Livability — Newton
- Score
- 77/100
- State rank
- #169
- US rank
- #3069
Category grades
Schools grade is shown separately in the Schools card above.
Census & demographics
- Census place
- Newton, IA
- County
- Jasper County · 20,595 people
- City population
- 20,595
- Metro
- Des Moines-West Des Moines, IA
- Population (ZIP)
- 20,595
- Household income
- $62,306
- Rent vs Own
- Severe rent burden
- 536.0
Population outlook (Jasper County) Hauer SSP2
- Today (2025)
- 36,216 people
- By 2030
- 35,730 · -1.3%
- By 2040
- 34,727 · -4.1%
- By 2050
- 33,802 · -6.7%
- By 2075
- 33,382 · -7.8%
- By 2100
- 32,761 · -9.5%
Race, ethnicity, and origin ACS 2023
- Neighborhood character
- Predominantly White (88%)
- Race & ethnicity
- White 88% Hispanic / Latino 5% Two or more races 4% Black 3%
- Common ancestry
- Iranian 8% Portuguese 3% Lithuanian 2%
- Foreign-born
- 4% · Canada
- Languages at home
- 92% English-only · Spanish 4% Arabic 2% Chinese 1%
Political lean MEDSL · Jasper
- 2024 margin
- Strong R (+27.6) · D 35.4% · R 63.0% · Other 1.5%
- 2008→2024 swing
- -35.1pp toward R · 2008: 7.5pp · 2024: -27.6pp
- All cycles
- 2024: R+27.6 2020: R+21.5 2016: R+18.4 2012: D+7.1 2008: D+7.5
Not yet ingested
- Civics
- —
Market trends
- HPI YoY
- ▼ -45.48%
- Current HPI
- 269.6454
- Rent YoY
- —
- Metro
- Des Moines-West Des Moines, IA
- State GDP YoY
- ▲ 2.48%
- F500 in state
- 4
Industry mix (Fortune 500 HQ in IA)
| Industry | F500 HQs | Revenue |
|---|---|---|
| Financial Services | 1 | $16B |
|
||
| Retail / Convenience | 1 | $15B |
|
||
Price history
+61.3% since first listed6 events — show timeline
- 2026-06-17 Price Changed $171,000 DMMLS
- 2026-05-12 Listed $190,000 DMMLS
- 2022-06-03 Sold (MLS) $182,000 DMMLS
- 2022-04-25 Pending — DMMLS
- 2022-04-14 Listed $182,500 DMMLS
- 2017-07-20 Sold (Public Records) $106,000 Public Records
Property tax history
+3.9%/yrLatest (2025): $3,070 · +0.7% YoY. Source: county tax records.
Cash-flow waterfall
monthlySold comps — $/sqft
last 12 mo · ≤1 miLoading sold comps…