2 Lake View Ln · Huntsville, TX
Flood risk 1/10 · Minimal
- FEMA flood zone
- X (unshaded)
- Chance of flooding over 30 yrs
- 0.0%
- Est. flood insurance / yr
- $507 – $1,088
Fire risk 4/10 · Minor
- Est. fire insurance / yr
- $1,222 – $2,270
Heat risk 8/10 · Major
- Hot days now (above 110°F)
- 7 days/yr
- Hot days in 30 yrs
- 23 days/yr
Wind risk 8/10 · Major
- Chance of severe wind over 30 yrs
- 97.0%
Air-quality risk 2/10 · Minimal
- Unhealthy air days now
- 0 days/yr
- Unhealthy air days in 30 yrs
- 1 days/yr
Risk factors via First Street. Map © Google.
Why this score? — see what drove the B- grade
The composite is a weighted blend of 9 inputs, each scored 0–100. Each bar is that input's sub-score; the figure is the points it added to the 100-point composite (weight × sub-score).
- Cash flow +29.9/30.0
- DSCR +10.0/10.0
- ARV discount +7.5/15.0
- 1% rule +7.4/10.0
- Livability +3.2/5.0
- Rent growth +2.8/5.0
- Schools +2.6/10.0
- Condition / age +2.5/5.0
- Appreciation +0.0/10.0
$109,900
🖨 Deal sheet 📄 Offer letter ✓ Due diligence
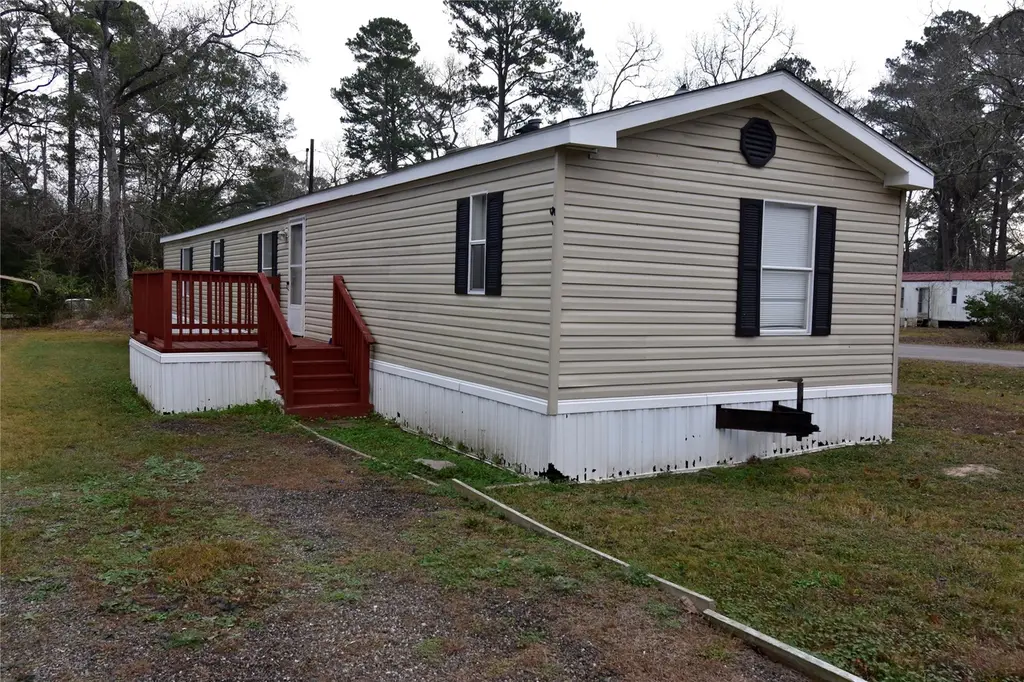
Listing remarks
This exceptional Residence, situated on a corner lot offers a tranquil living experience, complete with brand new roof installed in 2025 and a state-of-the-art sewer system. residents will appreciate the central air conditioning, ceiling fans throughout, and a spacious kitchen featuring ample cabinet space and included appliances. The primary bedroom boasts a walk-in closet and a private bathroom with a large soaking tub and separate stand-up shower. conveniently located near Sam Houston State University. This meticulously maintained property provides an ideal blend of location and layout, ready for its next owner.
Key facts
- Brand new roof
- Ceiling fans
- Spacious kitchen
Tags
Neighborhood map
What this means for you Summary
Snapshot
- This is a 3-bed/2.0-bath manufactured listed at $110k.
Deal economics
- At list price, monthly cash flow is $405 ($5k/yr) — positive.
- The deal already cash-flows at list — no discount required.
- Meets the 1% rule at list price ($1k rent vs $110k).
- Recommended offer: $108k (1.5% below list) — sets the bar for market timing.
- Cap rate 10.7% vs local median 2.6% in Huntsville — top-decile yield for the area; either an underpriced asset or a hidden risk that comps aren't pricing in. Stress-test before assuming the spread holds.
Location & tenants
- Location reads 63/100 on livability (#825 in TX) — a middle-class / working-renter tenant base. Strengths: cost of living A+; Watch: amenities C-, schools D-, crime D-.
- Huntsville ISD (town): math 25% / reading 37% proficiency, ranked #621 of 826 in TX (top 75%) — families likely to look elsewhere, expect single-tenant / working-renter base with shorter leases.
- Market conditions: Rents rising (+1.3%/yr); 600 active listings in the ZIP; 527 units permitted in Walker County in 2024 (0 in 5+ unit buildings).
- This rent runs 34% of the median local income ($49k/yr) — at the standard rent-burdened threshold; future hikes will face affordability resistance.
Forward outlook
- Local home prices are declining (-3.0%/yr); year-one equity from $760 of loan paydown is wiped out by about $3k of value loss. Plan a longer hold.
- Walker County population projected at +29% by 2050 — long-run rental-demand tailwind backs the buy-and-hold thesis.
- At projected returns (-3.0% appreciation + 1.3% rent growth), your $31k cash investment doubles in ~9 years — after that, you're playing with house money.
Negotiation context
- It's been on market 28 days — a 2% lower offer ($108k) is reasonable based on typical stale-listing flexibility.
Risks & watch-outs
- Climate carrying-cost: severe wind risk, 97% chance of damaging wind over 30y; extreme-heat days projected 7→23/yr by 2055 (HVAC capex compounding) — expect insurance premiums to compound above CPI over the hold.
Questions for the listing agent
- Is there a deadline driving the sale (1031 exchange, divorce, estate, relocation)? That informs how much negotiation room exists.
- Schools are D-rated, which usually means shorter tenancies and higher turnover. Who's the typical renter profile here, and what's been the actual vacancy rate?
- Crime grade is D in this area — have there been break-ins, vandalism, or insurance claims at this property in the last 3 years? What carrier currently insures it and at what premium?
- What's the average days-on-market for RENTAL listings here right now (not sales)? A rising rental-DOM trend means longer vacancies and softer asking-rent achievability than the comps imply.
- What's the recent tenant-quality profile in this submarket — average credit score on applications, eviction rate, late-payment / NSF rate, and stable-employment percentage? A property-management company in the area should have these aggregated.
- How much new for-sale + rental construction is in the pipeline within 1–3 miles? Heavy new supply typically softens prices + rents 12–24 months out; constrained supply supports both.
Investment metrics
- 1% rule
- 1.24% ✓
- Cap rate
- 10.72%
- Cash-on-cash
- 15.80%
- DSCR
- 1.70
- GRM
- 6.7
CMA / ARV
No comps found within radius.
Projected returns pro-forma
-3.0% appreciation · 1.27% rent growth · sell at horizon
- IRR
- 4.8%
- Equity multiple
- 1.18×
- Total profit
- $5,626
- Equity at exit
- $16,386
- IRR
- 12.7%
- Equity multiple
- 1.93×
- Total profit
- $28,727
- Equity at exit
- $9,502
Cash invested: $30,772 (down + closing). Projections, not guarantees.
Landlord ↔ Tenant lean methodology
- Overall (STATE)
- 87 Strongly Landlord-Friendly
- State Texas
- 87 Strongly Landlord-Friendly · R+5
- County
- — inherits STATE
- City
- — inherits STATE
ZIP-level market 77340
- Home prices YoY
- -30.6%
- Rents YoY
- 1.3%
- Active inventory
- 600
- Price-to-rent
- 6.7×
Monthly cashflow live
- Estimated rent
- $1,367 medium interval (Pro) →
- Mortgage (P&I)
- −$576
- Tax from tax record
- −$53 /mo · $636/yr
- Insurance
- −$46
- HOA
- −$0
- Vacancy / Maint / Mgmt
- −$287
- Net cashflow
- $405
Break-even live
UW: 25.0% down · 7.5% · 30yr · 1.5% tax · 5.0% vac · 8.0% maint · 8.0% mgmt
Financing live
Cash to close
- Down payment
- $27,475
- Closing costs
- $3,297
- Reserves months
- —
- Total cash needed
- —
Loan-product check · same deal, 3 products live
Conventional
25% down · 7.5% · 30yr
- Down + closing
- —
- Monthly P&I
- —
- Monthly cashflow
- —
- DSCR
- —
- Eligible?
- —
Personal DTI + credit; lowest rate.
DSCR
20% down · 8.5% · 30yr
- Down + closing
- —
- Monthly P&I
- —
- Monthly cashflow
- —
- DSCR
- —
- Eligible?
- —
No personal income docs; deal must DSCR.
Hard money
10% down · 12.0% · 12mo
- Down + closing
- —
- Monthly P&I
- —
- Monthly cashflow
- —
- DSCR
- —
- Eligible?
- —
Short-term bridge; refi at stabilization.
Listing history 23 events
-
2026-06-19pricedays on market $109,900 Active 28 DOM
-
2026-06-18days on market $114,900 Active 27 DOM
-
2026-06-17days on market $114,900 Active 26 DOM
-
2026-06-16days on market $114,900 Active 25 DOM
-
2026-06-15days on market $114,900 Active 24 DOM
-
2026-06-14days on market $114,900 Active 22 DOM
-
2026-06-13days on market $114,900 Active 21 DOM
-
2026-06-10days on market $114,900 Active 19 DOM
-
2026-06-09days on market $114,900 Active 18 DOM
-
2026-06-08days on market $114,900 Active 17 DOM
-
2026-06-07days on market $114,900 Active 16 DOM
-
2026-06-05days on market $114,900 Active 13 DOM
-
2026-06-03days on market $114,900 Active 12 DOM
-
2026-06-02days on market $114,900 Active 11 DOM
-
2026-06-01days on market $114,900 Active 10 DOM
-
2026-05-31days on market $114,900 Active 9 DOM
-
2026-05-30days on market $114,900 Active 8 DOM
-
2026-05-18historical
-
2026-01-08$119,900 Active
-
2022-08-31soldstatus
-
2022-03-25soldstatus
-
2012-09-17soldstatus
-
2009-03-19soldstatus
ⓘ Source: listings_history table (triggers on properties + properties_extension) + one-shot
backfill from property_details.listing_events for pre-trigger history.
Tax reassessment forecast TX · Resets to sale price
- Current annual tax
- $636 · $53/mo
- Projected year-2 tax
- $2,011 · $168/mo
- Expected delta
- +$1,375/yr (+$115/mo · 216.1%)
ⓘ Screening estimate from a state-policy table — verify with the county assessor before closing.
Climate risk First Street
- Flood 1/10 Low FEMA zone X (unshaded) · 0% chance over 30 yrs
- Wildfire 4/10 Moderate
- Heat 8/10 Severe 7 d/yr ≥110°F today · 23 d/yr by 30 yrs out
- Wind 8/10 Severe 97% chance of damaging wind over 30 yrs
- Air quality 2/10 Low 0 unhealthy d/yr today · 1 by 30 yrs out
Nearby sold comps map
Loading sold comps map…
Walkable amenities ~0.75 mi
Loading nearby amenities…
Taxation est. · year 1
- Rental income
- $16,410
- − Mortgage interest
- −$6,156
- − Property taxes
- −$636
- − Insurance
- −$550
- − Repairs & maintenance
- −$1,313
- − Management
- −$1,313
- − Depreciation
- −$3,197
- Taxable income
- $3,245
- Est. tax owed @ 24.0%
- −$779
- After-tax cash flow
- $4,083/yr
For passive investors: Depreciation is non-cash, so a rental often shows a tax loss while cash-flowing — sheltering income. Rental losses are passive: they offset passive income freely, and up to $25,000/yr can offset ordinary (W-2) income if you actively participate and your MAGI is under $100k (phasing out to $0 by $150k); unused losses carry forward. On sale, claimed depreciation is recaptured at up to 25%, and gains may owe capital-gains tax (a 1031 exchange can defer both). Figures are a year-1 estimate at your 24.0% rate — not tax advice; consult a CPA.
Schools (NCES district)
- District
- Huntsville ISD
- NCES district ID
- 4824030
- Math proficiency
- 25% ▼ -6.00%
- Reading proficiency
- 37% ▼ -2.00%
- Median HH income
- $36,597
- Composite
- 25.71/100
- National rank
- #7383
- State rank
- #621 of 826 in TX
Livability — Huntsville
- Score
- 63/100
- State rank
- #825
- US rank
- #14909
Category grades
Schools grade is shown separately in the Schools card above.
Census & demographics
- County
- Walker County · 75,669 people
- City population
- 75,669
- Metro
- Huntsville, TX
- Population (ZIP)
- 37,517
- Household income
- $48,538
- Rent vs Own
- Severe rent burden
- 1961.0
Population outlook (Walker County) Hauer SSP2
- Today (2025)
- 77,602 people
- By 2030
- 82,007 · +5.7%
- By 2040
- 90,436 · +16.5%
- By 2050
- 100,240 · +29.2%
- By 2075
- 123,667 · +59.4%
- By 2100
- 135,073 · +74.1%
Race, ethnicity, and origin ACS 2023
- Neighborhood character
- Diverse neighborhood (Simpson 0.63)
- Race & ethnicity
- White 54% Black 20% Hispanic / Latino 19% Two or more races 10% Asian 2%
- Hispanic origin (detail)
- Mexican 16%
- Common ancestry
- Italian 3% Lithuanian 2% Serbian 2%
- Foreign-born
- 7% · Canada
- Languages at home
- 83% English-only · Spanish 13% Other Asian/Pacific 1% Tagalog/Filipino 1%
Political lean MEDSL · Walker
- 2024 margin
- Solid R (+40.0) · D 29.6% · R 69.6%
- 2008→2024 swing
- -17.6pp toward R · 2008: -22.4pp · 2024: -40.0pp
- All cycles
- 2024: R+40.0 2020: R+31.7 2016: R+34.5 2012: R+28.4 2008: R+22.4
Not yet ingested
- Civics
- —
Market trends
- HPI YoY
- ▼ -80.44%
- Current HPI
- 182.8905
- Rent YoY
- ▲ 1.27%
- Metro
- Huntsville, TX
- State GDP YoY
- ▲ 3.95%
- F500 in state
- 110
Industry mix (Fortune 500 HQ in TX)
| Industry | F500 HQs | Revenue |
|---|---|---|
| Energy | 16 | $1,198B |
|
||
| Technology | 5 | $198B |
|
||
| Engineering / Construction | 4 | $72B |
|
||
| Energy Services | 3 | $60B |
|
||
| Utilities | 3 | $41B |
|
||
| Healthcare | 2 | $330B |
|
||
Price history
6 events — show timeline
- 2026-05-18 Listing Removed — HARMLS
- 2026-01-08 Listed $119,900 HARMLS
- 2022-08-31 Sold (Public Records) — Public Records
- 2022-03-25 Sold (Public Records) — Public Records
- 2012-09-17 Sold (Public Records) — Public Records
- 2009-03-19 Sold (Public Records) — Public Records
Property tax history
+21.0%/yrLatest (2025): $636 · +21.1% YoY. Source: county tax records.
Cash-flow waterfall
monthlySold comps — $/sqft
last 12 mo · ≤1 miLoading sold comps…