 Duplex
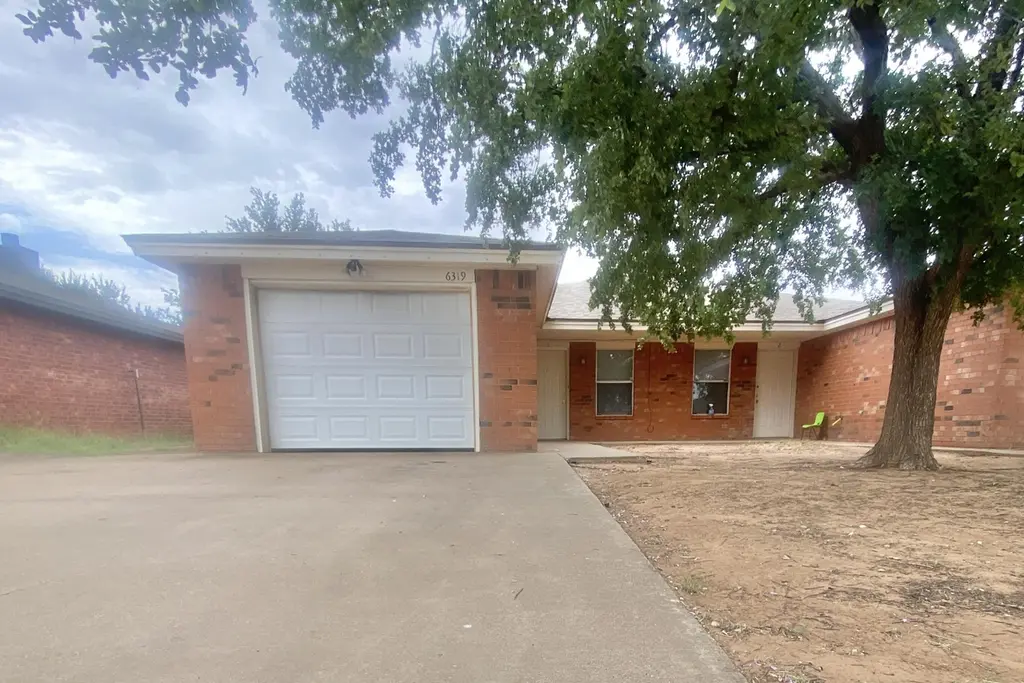
6319 7th St · Lubbock, TX
Flood risk 1/10 · Minimal
- FEMA flood zone
- X (unshaded)
- Chance of flooding over 30 yrs
- 0.0%
- Est. flood insurance / yr
- $507 – $1,088
Fire risk 2/10 · Minimal
- Est. fire insurance / yr
- $1,222 – $2,270
Heat risk 5/10 · Moderate
- Hot days now (above 99°F)
- 7 days/yr
- Hot days in 30 yrs
- 21 days/yr
Wind risk 2/10 · Minimal
- Chance of severe wind over 30 yrs
- —
Air-quality risk 2/10 · Minimal
- Unhealthy air days now
- 1 days/yr
- Unhealthy air days in 30 yrs
- 1 days/yr
Risk factors via First Street. Map © Google.
Why this score? — see what drove the C grade
The composite is a weighted blend of 9 inputs, each scored 0–100. Each bar is that input's sub-score; the figure is the points it added to the 100-point composite (weight × sub-score).
- Cash flow +24.1/30.0
- DSCR +7.8/10.0
- ARV discount +7.5/15.0
- 1% rule +6.3/10.0
- Schools +4.4/10.0
- Livability +4.0/5.0
- Rent growth +3.1/5.0
- Condition / age +2.5/5.0
- Appreciation +0.0/10.0
$245,000
🖨 Deal sheet 📄 Offer letter ✓ Due diligence
Multi-family units
County records classify this as Multi-Family (2-4 Unit). Listing-text estimate: 2 units. confirmed
Listing remarks MLS
Duplex with immediate income! This property is a great pick up for investor, or someone wanting to house hack. Both sides are currently leased on long term contracts. The property is in good condition and has a great layout, with 2 bedrooms, 2 bathrooms and 1 car garage on each side!
Key facts
- 6,600 sq ft lot
- 2 garage spots
- Built 2003
Neighborhood map
What this means for you Summary
Snapshot
- This is a 2 × 2-bed/2.0-bath units multifamily listed at $245k.
Deal economics
- At list price, monthly cash flow is $483 ($6k/yr) — positive. Per door: $241/mo.
- The deal already cash-flows at list — no discount required.
- Meets the 1% rule at list price ($3k rent vs $245k).
- Recommended offer: $223k (9.0% below list) — sets the bar for market timing.
Location & tenants
- Location reads 80/100 on livability (#37 in TX, #1,749 nationally) — a professional / high-income tenant draw. Strengths: commute A+, cost of living A+, housing A+; Watch: employment C-, schools D+, crime F.
- Frenship ISD (urban): math 47% / reading 54% proficiency, ranked #162 of 826 in TX (top 20%) — acceptable for families but not a draw, mixed tenant base, ~2y average lease.
- Market conditions: Rents rising (+2.2%/yr); 464 active listings in the ZIP; 29 comparable units currently listed for rent nearby; rentals at typical pace (median 21d on market — plan ~3-4 weeks tenant-placement turnaround); 45% of comp listings sitting > 30 days — soft ceiling on asking rent; 2,219 units permitted in Lubbock County in 2024 (252 in 5+ unit buildings).
- At $2,762/mo this rent would consume 52% of the median local household income ($64k/yr) (locally 2214% of renters already pay >50% of income on rent) — very limited rent-growth headroom before tenants either downsize or default.
Forward outlook
- Local home prices are declining (-3.0%/yr); year-one equity from $2k of loan paydown is wiped out by about $7k of value loss. Plan a longer hold.
- Lubbock County population projected at +39% by 2050 — long-run rental-demand tailwind backs the buy-and-hold thesis.
Negotiation context
- It's been on market 92 days — a 9% lower offer ($223k) is reasonable based on typical stale-listing flexibility.
Risks & watch-outs
- Climate carrying-cost: extreme-heat days projected 7→21/yr by 2055 (HVAC capex compounding) — expect insurance premiums to compound above CPI over the hold.
Questions for the listing agent
- It's been on market 92 days. Have you received any prior offers? Is the seller open to a 9% concession, seller financing, or rate buy-down credit?
- Can we see the unit-by-unit rent roll, current vacancy, and any below-market leases? What's the average tenancy length?
- What capital expenditures (roof, boiler, parking lot, exteriors) have been made in the last 5 years, and what's planned in the next 2?
- Why hasn't it sold? Are there any deal-killer items the seller is aware of (foundation, flood, title, zoning, code violations)?
- Is there a deadline driving the sale (1031 exchange, divorce, estate, relocation)? That informs how much negotiation room exists.
- Schools are D-rated, which usually means shorter tenancies and higher turnover. Who's the typical renter profile here, and what's been the actual vacancy rate?
- Crime grade is F in this area — have there been break-ins, vandalism, or insurance claims at this property in the last 3 years? What carrier currently insures it and at what premium?
- What's the average days-on-market for RENTAL listings here right now (not sales)? A rising rental-DOM trend means longer vacancies and softer asking-rent achievability than the comps imply.
- What's the recent tenant-quality profile in this submarket — average credit score on applications, eviction rate, late-payment / NSF rate, and stable-employment percentage? A property-management company in the area should have these aggregated.
- How much new apartment / multifamily construction is in the pipeline within 1–3 miles? Heavy new supply (>2% of stock underway) typically softens rents 12–24 months out; light construction supports rent growth.
Investment metrics
- 1% rule
- 1.13% ✓
- Cap rate
- 8.66%
- Cash-on-cash
- 8.45%
- DSCR
- 1.38
- GRM
- 7.4
CMA / ARV
No comps found within radius.
Projected returns pro-forma
-3.0% appreciation · 2.21% rent growth · sell at horizon
- IRR
- -4.4%
- Equity multiple
- 0.84×
- Total profit
- $-11,077
- Equity at exit
- $36,530
- IRR
- 4.4%
- Equity multiple
- 1.31×
- Total profit
- $21,345
- Equity at exit
- $21,183
Cash invested: $68,600 (down + closing). Projections, not guarantees.
Landlord ↔ Tenant lean methodology
- Overall (STATE)
- 87 Strongly Landlord-Friendly
- State Texas
- 87 Strongly Landlord-Friendly · R+5
- County
- — inherits STATE
- City
- — inherits STATE
ZIP-level market 79416
- Home prices YoY
- -20.0%
- Rents YoY
- 2.2%
- Active inventory
- 464
- Price-to-rent
- 14.8×
Monthly cashflow live
- Estimated rent
- $2,762 high interval (Pro) →
- Mortgage (P&I)
- −$1,285
- Tax from tax record
- −$312 /mo · $3,746/yr
- Insurance
- −$102
- HOA
- −$0
- Vacancy / Maint / Mgmt
- −$580
- Net cashflow
- $483
Break-even live
2-unit breakdown (identical units grouped — click to expand)
| Units | Beds | Baths | Est. rent |
|---|---|---|---|
| 2× units | 2 | 2 | $2,762 |
| #1 | 2 | 2 | $1,381 |
| #2 | 2 | 2 | $1,381 |
| Total (2 units) | $2,762 | ||
UW: 25.0% down · 7.5% · 30yr · 1.5% tax · 5.0% vac · 8.0% maint · 8.0% mgmt
Financing live
Cash to close
- Down payment
- $61,250
- Closing costs
- $7,350
- Reserves months
- —
- Total cash needed
- —
Loan-product check · same deal, 3 products live
Conventional
25% down · 7.5% · 30yr
- Down + closing
- —
- Monthly P&I
- —
- Monthly cashflow
- —
- DSCR
- —
- Eligible?
- —
Personal DTI + credit; lowest rate.
DSCR
20% down · 8.5% · 30yr
- Down + closing
- —
- Monthly P&I
- —
- Monthly cashflow
- —
- DSCR
- —
- Eligible?
- —
No personal income docs; deal must DSCR.
Hard money
10% down · 12.0% · 12mo
- Down + closing
- —
- Monthly P&I
- —
- Monthly cashflow
- —
- DSCR
- —
- Eligible?
- —
Short-term bridge; refi at stabilization.
Rent comps 29 comps
| Address | Beds | Baths | Sqft | Rent | $/sqft | DOM | Units | Dist |
|---|---|---|---|---|---|---|---|---|
| 6505 8th St Lubbock, TX | 3.0 | 2.0 | 1633 | $1,600 | $0.98 | 13d | 1 | 0.12mi |
| 6513 8th St Lubbock, TX | 3.0 | 2.0 | 1720 | $1,750 | $1.02 | 43d | 1 | 0.15mi |
| 6521 8th St Lubbock, TX | 3.0 | 2.0 | 1865 | $1,795 | $0.96 | 43d | 1 | 0.18mi |
| 403 Kirby Ave Lubbock, TX | 3.0 | 2.0 | 1800 | $695 | $0.39 | 43d | 1 | 0.26mi |
| 1003 Oshkosh Ave Lubbock, TX | 3.0 | 2.0 | 1835 | $2,000 | $1.09 | 13d | 1 | 0.36mi |
| 6111 10th Dr Lubbock, TX | 4.0 | 2.0 | 1917 | $1,649 | $0.86 | 21d | 1 | 0.48mi |
| 6724 4th St Lubbock, TX | 3.0 | 3.0 | 1640 | $1,500 | $0.91 | 43d | 1 | 0.50mi |
| 6806 4th St Unit D Lubbock, TX | 3.0 | 3.0 | 1640 | $1,550 | $0.95 | 43d | 1 | 0.55mi |
| 6106 17th St Lubbock, TX | 3.0 | 2.0 | 1589 | $1,400 | $0.88 | 43d | 1 | 0.69mi |
| 310 Homestead Ave Unit 4 Lubbock, TX | 3.0 | 2.5 | 1783 | $1,795 | $1.01 | 13d | 1 | 0.69mi |
| 310 Homestead Ave Lubbock, TX | 3.0 | 3.0 | 1783 | $1,995 | $1.12 | 43d | 1 | 0.70mi |
| 5811 11th Pl Unit 9 Lubbock, TX | 3.0 | 2.5 | 2404 | $2,000 | $0.83 | 43d | 1 | 0.85mi |
| 7105 14th St Lubbock, TX | 4.0 | 2.0 | 1600 | $1,950 | $1.22 | 21d | 1 | 1.00mi |
| 504 N Juneau Ave Lubbock, TX | 3.0 | 2.0 | 1809 | $1,699 | $0.94 | 13d | 1 | 1.08mi |
| 6927 20th St Lubbock, TX | 3.0 | 2.0 | 1611 | $1,599 | $0.99 | 21d | 1 | 1.12mi |
| 518 N Juneau Ave Lubbock, TX | 3.0 | 2.0 | 1816 | $1,625 | $0.89 | 13d | 1 | 1.14mi |
| 6040 24th St Unit 8 Lubbock, TX | 3.0 | 3.5 | 1699 | $1,600 | $0.94 | 43d | 1 | 1.17mi |
| 6040 24th St Unit 17 Lubbock, TX | 3.0 | 3.5 | 1700 | $1,729 | $1.02 | 43d | 1 | 1.18mi |
| 6040 24th St Unit 17 Lubbock, TX | 3.0 | 2.0 | 1700 | $1,729 | $1.02 | 21d | 1 | 1.18mi |
| 6040 24th St Unit 33 Lubbock, TX | 3.0 | 3.5 | 1795 | $1,600 | $0.89 | 21d | 1 | 1.18mi |
| 7324 9th St Lubbock, TX | 4.0 | 2.0 | 1778 | $1,950 | $1.10 | 21d | 1 | 1.20mi |
| 6040 24th St Lubbock, TX | 3.0 | 3.0 | 1795 | $1,799 | $1.00 | 21d | 1 | 1.21mi |
| 6040 24th St Unit 16 Lubbock, TX | 3.0 | 3.5 | 1600 | $1,699 | $1.06 | 13d | 1 | 1.21mi |
| 6040 24th St Apt 25 Lubbock, TX | 3.0 | 2.5 | 1795 | $1,700 | $0.95 | 21d | 1 | 1.21mi |
| 6040 24th St Apt 25 Lubbock, TX | 3.0 | 3.5 | 1795 | $1,700 | $0.95 | 43d | 1 | 1.21mi |
| 6040 24th St Lubbock, TX | 3.0 | 3.5 | 1795 | $1,650 | $0.92 | 43d | 1 | 1.21mi |
| 5518 16th Pl Lubbock, TX | 3.0 | 2.0 | 1637 | $1,700 | $1.04 | 13d | 1 | 1.42mi |
| 5501 9th St Lubbock, TX | 4.0 | 2.0 | 1867 | $1,800 | $0.96 | 21d | 1 | 1.43mi |
| 5741 Duke St Lubbock, TX | 4.0 | 2.0 | 1693 | $1,699 | $1.00 | 43d | 1 | 1.43mi |
Listing history 19 events
-
2026-06-18days on market $245,000 Active 92 DOM
-
2026-06-17days on market $245,000 Active 91 DOM
-
2026-06-16days on market $245,000 Active 90 DOM
-
2026-06-15days on market $245,000 Active 89 DOM
-
2026-06-13days on market $245,000 Active 86 DOM
-
2026-06-10days on market $245,000 Active 84 DOM
-
2026-06-09days on market $245,000 Active 83 DOM
-
2026-06-08days on market $245,000 Active 82 DOM
-
2026-06-07days on market $245,000 Active 81 DOM
-
2026-06-05days on market $245,000 Active 78 DOM
-
2026-06-03days on market $245,000 Active 77 DOM
-
2026-06-02days on market $245,000 Active 76 DOM
-
2026-06-01days on market $245,000 Active 75 DOM
-
2026-05-31days on market $245,000 Active 74 DOM
-
2026-05-30days on market $245,000 Active 73 DOM
-
2026-05-11price $245,000 284-char remark
Show marketing remark (284 chars)
Duplex with immediate income! This property is a great pick up for investor, or someone wanting to house hack. Both sides are currently leased on long term contracts. The property is in good condition and has a great layout, with 2 bedrooms, 2 bathrooms and 1 car garage on each side!
-
2026-03-18$250,000 Active 284-char remark
Show marketing remark (284 chars)
Duplex with immediate income! This property is a great pick up for investor, or someone wanting to house hack. Both sides are currently leased on long term contracts. The property is in good condition and has a great layout, with 2 bedrooms, 2 bathrooms and 1 car garage on each side!
-
2024-03-08soldstatus
-
2009-07-08soldstatus
ⓘ Source: listings_history table (triggers on properties + properties_extension) + one-shot
backfill from property_details.listing_events for pre-trigger history.
Tax reassessment forecast TX · Resets to sale price
- Current annual tax
- $3,746 · $312/mo
- Projected year-2 tax
- $4,484 · $374/mo
- Expected delta
- +$737/yr (+$61/mo · 19.7%)
ⓘ Screening estimate from a state-policy table — verify with the county assessor before closing.
Climate risk First Street
- Flood 1/10 Low FEMA zone X (unshaded) · 0% chance over 30 yrs
- Wildfire 2/10 Low
- Heat 5/10 Major 7 d/yr ≥99°F today · 21 d/yr by 30 yrs out
- Wind 2/10 Low
- Air quality 2/10 Low 1 unhealthy d/yr today · 1 by 30 yrs out
Nearby sold comps map
Loading sold comps map…
Walkable amenities ~0.75 mi
Loading nearby amenities…
Taxation est. · year 1
- Rental income
- $33,144
- − Mortgage interest
- −$13,724
- − Property taxes
- −$3,746
- − Insurance
- −$1,225
- − Repairs & maintenance
- −$2,652
- − Management
- −$2,652
- − Depreciation
- −$7,127
- Taxable income
- $2,019
- Est. tax owed @ 24.0%
- −$484
- After-tax cash flow
- $5,310/yr
For passive investors: Depreciation is non-cash, so a rental often shows a tax loss while cash-flowing — sheltering income. Rental losses are passive: they offset passive income freely, and up to $25,000/yr can offset ordinary (W-2) income if you actively participate and your MAGI is under $100k (phasing out to $0 by $150k); unused losses carry forward. On sale, claimed depreciation is recaptured at up to 25%, and gains may owe capital-gains tax (a 1031 exchange can defer both). Figures are a year-1 estimate at your 24.0% rate — not tax advice; consult a CPA.
Schools (NCES district)
- District
- Frenship ISD
- NCES district ID
- 4819830
- Math proficiency
- 47% ▼ -8.00%
- Reading proficiency
- 54% ▬ 0.00%
- Median HH income
- $54,376
- Composite
- 43.59/100
- National rank
- #2976
- State rank
- #162 of 826 in TX
Livability — Lubbock
- Score
- 80/100
- State rank
- #37
- US rank
- #1749
Category grades
Schools grade is shown separately in the Schools card above.
Census & demographics
- Census place
- Lubbock, TX
- County
- Lubbock County · 293,542 people
- City population
- 283,030
- Metro
- Lubbock, TX
- Population (ZIP)
- 36,442
- Household income
- $63,896
- Rent vs Own
- Severe rent burden
- 2214.0
Population outlook (Lubbock County) Hauer SSP2
- Today (2025)
- 345,960 people
- By 2030
- 371,449 · +7.4%
- By 2040
- 424,539 · +22.7%
- By 2050
- 481,150 · +39.1%
- By 2075
- 633,467 · +83.1%
- By 2100
- 746,853 · +115.9%
Race, ethnicity, and origin ACS 2023
- Neighborhood character
- Diverse neighborhood (Simpson 0.62)
- Race & ethnicity
- White 49% Hispanic / Latino 35% Two or more races 14% Black 9% Asian 3%
- Hispanic origin (detail)
- Mexican 28%
- Common ancestry
- Slovak 3% Italian 1% Serbian 1%
- Foreign-born
- 7% · Canada, China, South Korea
- Languages at home
- 81% English-only · Spanish 13% Chinese 1% Tagalog/Filipino 1%
Political lean MEDSL · Lubbock
- 2024 margin
- Solid R (+39.5) · D 29.7% · R 69.2% · Other 1.0%
- 2008→2024 swing
- -2.8pp toward R · 2008: -36.7pp · 2024: -39.5pp
- All cycles
- 2024: R+39.5 2020: R+32.2 2016: R+38.4 2012: R+40.9 2008: R+36.7
Not yet ingested
- Civics
- —
Market trends
- HPI YoY
- ▼ -56.94%
- Current HPI
- 227.7841
- Rent YoY
- ▲ 2.21%
- Metro
- Lubbock, TX
- State GDP YoY
- ▲ 3.95%
- F500 in state
- 110
Industry mix (Fortune 500 HQ in TX)
| Industry | F500 HQs | Revenue |
|---|---|---|
| Energy | 16 | $1,198B |
|
||
| Technology | 5 | $198B |
|
||
| Engineering / Construction | 4 | $72B |
|
||
| Energy Services | 3 | $60B |
|
||
| Utilities | 3 | $41B |
|
||
| Healthcare | 2 | $330B |
|
||
Price history
-2.0% since first listed4 events — show timeline
- 2026-05-11 Price Changed $245,000 LARMLS
- 2026-03-18 Listed $250,000 LARMLS
- 2024-03-08 Sold (Public Records) — Public Records
- 2009-07-08 Sold (Public Records) — Public Records
Property tax history
+2.4%/yrLatest (2025): $3,746 · -1.9% YoY. Source: county tax records.
Cash-flow waterfall
monthlySold comps — $/sqft
last 12 mo · ≤1 miLoading sold comps…