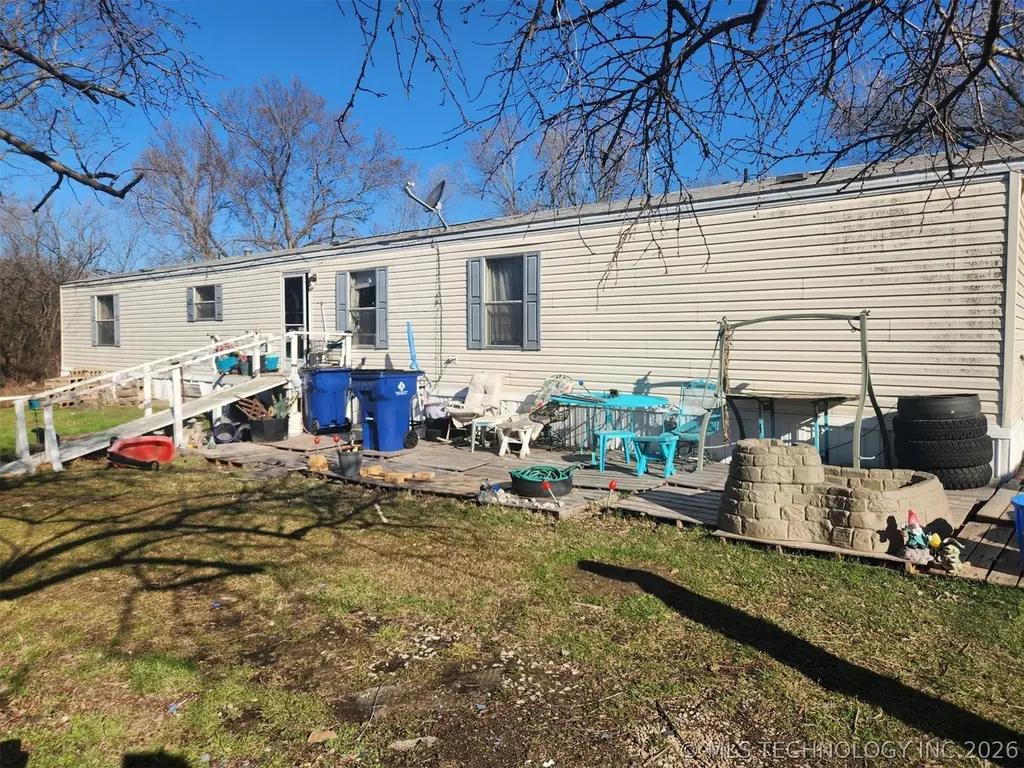
414 E Golden Ave · Copan, OK
Flood risk 1/10 · Minimal
- FEMA flood zone
- X (unshaded)
- Chance of flooding over 30 yrs
- 0.0%
- Est. flood insurance / yr
- $507 – $1,088
Fire risk 6/10 · Moderate
- Est. fire insurance / yr
- $2,463 – $4,575
Heat risk 5/10 · Moderate
- Hot days now (above 110°F)
- 7 days/yr
- Hot days in 30 yrs
- 18 days/yr
Wind risk 2/10 · Minimal
- Chance of severe wind over 30 yrs
- 3.0%
Air-quality risk 3/10 · Minor
- Unhealthy air days now
- 3 days/yr
- Unhealthy air days in 30 yrs
- 3 days/yr
Risk factors via First Street. Map © Google.
Why this score? — see what drove the C+ grade
The composite is a weighted blend of 9 inputs, each scored 0–100. Each bar is that input's sub-score; the figure is the points it added to the 100-point composite (weight × sub-score).
- Cash flow +22.1/30.0
- ARV discount +13.8/15.0
- DSCR +7.1/10.0
- Appreciation +5.0/10.0
- 1% rule +4.6/10.0
- Livability +2.8/5.0
- Rent growth +2.5/5.0
- Condition / age +2.5/5.0
- Schools +1.4/10.0
$120,000
🖨 Deal sheet (PDF) 📄 Offer letter ✓ Due diligence
Listing remarks
Great location! Just west of Copan Round-up Club. 7.20 acres m/l per CH. Nice 14'x30' shop with electirc and plumbed for bathroom. Nice size master bedroom on west wing with spacious bath suite.
Key facts
- 14x30 shop
- Plumbed for bathroom
- 7.2 acre lot
Tags
Property features AI
Finance
- Other: Tax information available
Exterior
- Parking: Dirt driveway
- Security: No safety shelter
- Utilities: Electricity available; Public water; Public sewer; Cable available; High-speed internet available; Satellite internet available
- Home design: Manufactured single-wide home; One story; Faces south; Permanent foundation
- Construction: Aluminum siding; Metal roof; Manufactured construction
- Exterior features: Deck; Porch; Dirt driveway; Storage structure; Mature trees on property
Interior
- Kitchen: Eat-in kitchen; Electric oven/range connection; Refrigerator; Dishwasher; Stove/Range
- Bedrooms: Master bedroom with private bath and walk-in closet (first level); Two additional bedrooms (first level)
- Flooring: Carpet; Vinyl
- Bathrooms: Master bath with bathtub, double sink and shower (first level); Hall full bathroom (first level)
- Heating & cooling: Central heating (electric); Central air conditioning
- Interior features: Vaulted ceilings; Ceiling fans; Laminate countertops; Accessible approach with ramp and accessible entrance; Vinyl windows
- Laundry & utility: Inside utility room (separate); Washer and dryer included; Electric dryer hookup; Electric water heater
Neighborhood map
What this means for you Summary
Snapshot
- This is a 3-bed/2.0-bath single-family listed at $120k.
Deal economics
- At list price, monthly cash flow is $193 ($2k/yr) — positive.
- The deal already cash-flows at list — no discount required.
- To meet the 1% rule (rent ≥ 1% of price), the offer needs to be $116k (3.7% below list).
- Recommended offer: $113k (6.0% below list) — sets the bar for market timing.
Location & tenants
- Location reads 56/100 on livability (#538 in OK) — a working-class tenant base; expect higher turnover. Strengths: cost of living A+, housing A+; Watch: schools F, crime F, amenities F.
- Copan (rural): math 6% / reading 15% proficiency, ranked #488 of 513 in OK (top 95%) — low school quality limits family demand, transient renter base, plan for 1-2y turnover.
- Market conditions: 9 active listings in the ZIP; 46 units permitted in Washington County in 2024 (0 in 5+ unit buildings).
Forward outlook
- In year one you build about $4k of equity ($830 loan paydown + $4k appreciation (3.0% local appreciation)).
- Washington County population projected at +12% by 2050 — modest demand growth; plan on rents tracking national, not racing it.
- At projected returns (3.0% appreciation + 3.0% rent growth), your $34k cash investment doubles in ~5 years — after that, you're playing with house money.
- By year 8, paydown + projected appreciation supports a ~$33k cash-out refi (75% LTV) — recoverable capital for the next deal without selling this one.
Negotiation context
- It's been on market 77 days — a 6% lower offer ($113k) is reasonable based on typical stale-listing flexibility.
- 2 sale attempts with the ask held roughly flat each time — persistent listings suggest the price (not the market) is what's stuck; bring a comps-based counter.
- Current owner paid $13k; list at $120k implies a 823% gain — meaningful room to come down on a strong offer.
Risks & watch-outs
- Climate carrying-cost: major wildfire risk; extreme-heat days projected 7→18/yr by 2055 (HVAC capex compounding) — expect insurance premiums to compound above CPI over the hold.
Questions for the listing agent
- It's been on market 77 days. Have you received any prior offers? Is the seller open to a 6% concession, seller financing, or rate buy-down credit?
- Why hasn't it sold? Are there any deal-killer items the seller is aware of (foundation, flood, title, zoning, code violations)?
- Is there a deadline driving the sale (1031 exchange, divorce, estate, relocation)? That informs how much negotiation room exists.
- Schools are F-rated, which usually means shorter tenancies and higher turnover. Who's the typical renter profile here, and what's been the actual vacancy rate?
- Crime grade is F in this area — have there been break-ins, vandalism, or insurance claims at this property in the last 3 years? What carrier currently insures it and at what premium?
- What's the average days-on-market for RENTAL listings here right now (not sales)? A rising rental-DOM trend means longer vacancies and softer asking-rent achievability than the comps imply.
- What's the recent tenant-quality profile in this submarket — average credit score on applications, eviction rate, late-payment / NSF rate, and stable-employment percentage? A property-management company in the area should have these aggregated.
- How much new for-sale + rental construction is in the pipeline within 1–3 miles? Heavy new supply typically softens prices + rents 12–24 months out; constrained supply supports both.
Investment metrics
- 1% rule
- 0.96% ✗
- Cap rate
- 8.22%
- Cash-on-cash
- 6.89%
- DSCR
- 1.31
- GRM
- 8.7
CMA / ARV
- ARV (on-the-fly)
- $139,536
- Comps found
- 10
Show comp detail 10 sales within ~0.75 mi
| Address | Dist | Beds/Ba | Sqft | Sold | Price | $/sf | Match |
|---|---|---|---|---|---|---|---|
| 211 Chestnut St | 0.49mi | 4/2.0 (+1) | 1,368 (0%) | 15mo | $140,000 | $102 | 60 |
| 300 W Weldon Ave | 0.67mi | 3/1.5 | 1,444 (+6%) | 1mo | $165,000 | $114 | 56 |
| 302 S Chestnut St | 0.63mi | 3/1.5 | 1,463 (+7%) | 4mo | $168,800 | $115 | 54 |
| 111 S Baker St | 0.44mi | 3/2.0 | 1,516 (+11%) | 10mo | $85,000 | $56 | 53 |
| 130 S Gertrude St | 0.42mi | 3/1.0 | 1,248 (-9%) | 12mo | $125,000 | $100 | 51 |
| 211 Walker St | 0.62mi | 2/1.5 (-1) | 1,433 (+5%) | 6mo | $127,000 | $89 | 51 |
| 251 S Bryan St | 0.54mi | 4/1.5 (+1) | 1,280 (-6%) | 14mo | $79,900 | $62 | 45 |
| 400 S Caney St | 0.68mi | 2/1.5 (-1) | 1,231 (-10%) | 1mo | $82,500 | $67 | 44 |
| 8442 N 3982 Dr | 0.71mi | 3/1.0 | 1,350 (-1%) | 22mo | $150,000 | $111 | 42 |
| 7361 N 3980 Rd | 0.63mi | 2/2.0 (-1) | 1,308 (-4%) | 23mo | $210,000 | $161 | 39 |
Match score weights: distance 35% · size 25% · config 20% · recency 20%. Top-matched comps best support the ARV.
Projected returns pro-forma
3.0% appreciation · 3.0% rent growth · sell at horizon
- IRR
- 13.9%
- Equity multiple
- 1.79×
- Total profit
- $26,688
- Equity at exit
- $53,957
- IRR
- 15.7%
- Equity multiple
- 3.31×
- Total profit
- $77,743
- Equity at exit
- $83,154
Cash invested: $33,600 (down + closing). Projections, not guarantees.
Landlord ↔ Tenant lean methodology
- Overall (STATE)
- 83 Strongly Landlord-Friendly
- State Oklahoma
- 83 Strongly Landlord-Friendly · R+20
- County
- — inherits STATE
- City
- — inherits STATE
ZIP-level market 74022
- Active inventory
- 9
- Price-to-rent
- 8.7×
Monthly cashflow live
- Estimated rent
- $1,155 medium interval (Pro) →
- Mortgage (P&I)
- −$629
- Tax from tax record
- −$40 /mo · $484/yr
- Insurance
- −$50
- HOA
- −$0
- Vacancy / Maint / Mgmt
- −$243
- Net cashflow
- $193
Break-even live
Sensitivity live
| Price | -10% $261 | -5% $227 | +0% $193 | +5% $159 | +10% $125 |
|---|---|---|---|---|---|
| Rent | -10% $102 | -5% $147 | +0% $193 | +5% $238 | +10% $284 |
| Rate | -1.0pp $253 | -0.5pp $223 | base $193 | +0.5pp $162 | +1.0pp $130 |
UW: 25.0% down · 7.5% · 30yr · 1.5% tax · 5.0% vac · 8.0% maint · 8.0% mgmt
Financing live
Cash to close
- Down payment
- $30,000
- Closing costs
- $3,600
- Reserves months
- —
- Total cash needed
- —
Loan-product check · same deal, 3 products live
Conventional
25% down · 7.5% · 30yr
- Down + closing
- —
- Monthly P&I
- —
- Monthly cashflow
- —
- DSCR
- —
- Eligible?
- —
Personal DTI + credit; lowest rate.
DSCR
20% down · 8.5% · 30yr
- Down + closing
- —
- Monthly P&I
- —
- Monthly cashflow
- —
- DSCR
- —
- Eligible?
- —
No personal income docs; deal must DSCR.
Hard money
10% down · 12.0% · 12mo
- Down + closing
- —
- Monthly P&I
- —
- Monthly cashflow
- —
- DSCR
- —
- Eligible?
- —
Short-term bridge; refi at stabilization.
Listing history 20 events
-
2026-06-19days on market $120,000 Active 77 DOM
-
2026-06-18days on market $120,000 Active 76 DOM
-
2026-06-17days on market $120,000 Active 75 DOM
-
2026-06-16days on market $120,000 Active 74 DOM
-
2026-06-15days on market $120,000 Active 73 DOM
-
2026-06-14days on market $120,000 Active 71 DOM
-
2026-06-12days on market $120,000 Active 70 DOM
-
2026-06-09days on market $120,000 Active 67 DOM
-
2026-06-08days on market $120,000 Active 66 DOM
-
2026-06-07days on market $120,000 Active 65 DOM
-
2026-06-05days on market $120,000 Active 62 DOM
-
2026-06-03days on market $120,000 Active 61 DOM
-
2026-06-02days on market $120,000 Active 60 DOM
-
2026-06-01days on market $120,000 Active 59 DOM
-
2026-05-31days on market $120,000 Active 58 DOM
-
2026-05-30days on market $120,000 Active 57 DOM
-
2026-04-03$120,000 Active
-
2026-03-28historical
-
2025-09-29$120,000 Active
-
1996-05-30soldstatus $13,000
ⓘ Source: listings_history table (triggers on properties + properties_extension) + one-shot
backfill from property_details.listing_events for pre-trigger history.
Tax reassessment forecast OK · Resets to sale price
- Current annual tax
- $484 · $40/mo
- Projected year-2 tax
- $1,080 · $90/mo
- Expected delta
- +$596/yr (+$50/mo · 123.1%)
ⓘ Screening estimate from a state-policy table — verify with the county assessor before closing.
Climate risk First Street
- Flood 1/10 Low FEMA zone X (unshaded) · 0% chance over 30 yrs
- Wildfire 6/10 Major
- Heat 5/10 Major 7 d/yr ≥110°F today · 18 d/yr by 30 yrs out
- Wind 2/10 Low 3% chance of damaging wind over 30 yrs
- Air quality 3/10 Moderate 3 unhealthy d/yr today · 3 by 30 yrs out
Nearby sold comps map
Loading sold comps map…
Walkable amenities ~0.75 mi
Loading nearby amenities…
Taxation est. · year 1
- Rental income
- $13,860
- − Mortgage interest
- −$6,722
- − Property taxes
- −$484
- − Insurance
- −$600
- − Repairs & maintenance
- −$1,109
- − Management
- −$1,109
- − Depreciation
- −$3,491
- Taxable income
- $346
- Est. tax owed @ 24.0%
- −$83
- After-tax cash flow
- $2,231/yr
For passive investors: Depreciation is non-cash, so a rental often shows a tax loss while cash-flowing — sheltering income. Rental losses are passive: they offset passive income freely, and up to $25,000/yr can offset ordinary (W-2) income if you actively participate and your MAGI is under $100k (phasing out to $0 by $150k); unused losses carry forward. On sale, claimed depreciation is recaptured at up to 25%, and gains may owe capital-gains tax (a 1031 exchange can defer both). Figures are a year-1 estimate at your 24.0% rate — not tax advice; consult a CPA.
Schools (NCES district)
- District
- Copan
- NCES district ID
- 4008610
- Math proficiency
- 6% ▼ -4.00%
- Reading proficiency
- 15% ▲ 5.00%
- Median HH income
- $49,074
- Composite
- 13.56/100
- National rank
- #14485
- State rank
- #488 of 513 in OK
Livability — Copan
- Score
- 56/100
- State rank
- #538
- US rank
- #23068
Category grades
Schools grade is shown separately in the Schools card above.
Census & demographics
- Census place
- Copan, OK
- Population (ZIP)
- 1,710
Population outlook (Washington County) Hauer SSP2
- Today (2025)
- 54,946 people
- By 2030
- 56,249 · +2.4%
- By 2040
- 58,867 · +7.1%
- By 2050
- 61,600 · +12.1%
- By 2075
- 69,355 · +26.2%
- By 2100
- 73,067 · +33.0%
Race, ethnicity, and origin ACS 2023
- Neighborhood character
- Predominantly White (73%)
- Race & ethnicity
- White 73% Two or more races 15% Native American 9% Hispanic / Latino 8%
- Hispanic origin (detail)
- Mexican 7%
- Common ancestry
- Portuguese 3% Italian 2% Slovak 1%
- Foreign-born
- 0%
- Languages at home
- 96% English-only · Spanish 4%
Political lean MEDSL · Washington
- 2024 margin
- Solid R (+47.6) · D 25.0% · R 72.7% · Other 2.4%
- 2008→2024 swing
- -3.1pp toward R · 2008: -44.6pp · 2024: -47.6pp
- All cycles
- 2024: R+47.6 2020: R+48.0 2016: R+48.5 2012: R+47.8 2008: R+44.6
Not yet ingested
- Civics
- —
Market trends
- HPI YoY
- —
- Current HPI
- —
- Rent YoY
- —
- Metro
- —
- State GDP YoY
- ▲ 1.55%
- F500 in state
- 6
Industry mix (Fortune 500 HQ in OK)
| Industry | F500 HQs | Revenue |
|---|---|---|
| Energy | 3 | $48B |
|
||
Price history
+823.1% since first listed4 events — show timeline
- 2026-04-03 Listed $120,000 MLS Technology, Inc.
- 2026-03-28 Listing Removed — MLS Technology, Inc.
- 2025-09-29 Listed $120,000 MLS Technology, Inc.
- 1996-05-30 Sold (Public Records) $13,000 Public Records
Property tax history
-0.1%/yrLatest (2025): $484 · -1.2% YoY. Source: county tax records.
Cash-flow waterfall
monthlySold comps — $/sqft
last 12 mo · ≤1 miLoading sold comps…